- DL manuals
- LeCroy
- Test Equipment
- SDA
- Operator's Manual
LeCroy SDA Operator's Manual
Summary of SDA
Page 1
S erial d ata a nalyzer o perator ’ s m anual december, 2007.
Page 2
Lecroy corporation 700 chestnut ridge road chestnut ridge, ny 10977–6499 tel: (845) 578 6020, fax: (845) 578 5985 internet: www.Lecroy.Com © 2007 by lecroy corporation. All rights reserved. Lecroy, activedso, wavelink, jittertrack, wavepro, wavemaster, wavesurfer, waveexpert, waverunner and wavejet ...
Page 3: Sda Operator’S Manual
Sda operator’s manual sda-om-e rev h 3 introduction ......................................................................................................... 18 how to use online help .............................................................................................. 18 type styles .........
Page 4
4 sda-om-e rev h color waveform display .............................................................................................. 35 analog persistence display .................................................................................................... 36 zoom expansion traces ............
Page 5: Sda Operator’S Manual
Sda operator’s manual sda-om-e rev h 5 trace annotation ......................................................................................................... 50 annotating a waveform .......................................................................................................... 51 tur...
Page 6
6 sda-om-e rev h probe attenuation ........................................................................................................ 68 setting probe attenuation ....................................................................................................... 68 bandwidth limit ...........
Page 7: Sda Operator’S Manual
Sda operator’s manual sda-om-e rev h 7 smart triggers .......................................................................................................... 83 width trigger .............................................................................................................................
Page 8
8 sda-om-e rev h disk utilities ............................................................................................................... 110 deleting a single file ............................................................................................................ 110 deleting all fil...
Page 9: Sda Operator’S Manual
Sda operator’s manual sda-om-e rev h 9 cursor measurement icons .................................................................................................. 136 cursors setup ............................................................................................................ 137 quick ...
Page 10
10 sda-om-e rev h waveform qualifier setup ..................................................................................................... 178 waveform math ................................................................................................. 178 introduction to math traces and fun...
Page 11: Sda Operator’S Manual
Sda operator’s manual sda-om-e rev h 11 fft algorithms ..................................................................................................................... 199 glossary .....................................................................................................................
Page 12
12 sda-om-e rev h service ...................................................................................................................... 217 show windows desktop ............................................................................................ 217 touch-screen calibration ...........
Page 13: Sda Operator’S Manual
Sda operator’s manual sda-om-e rev h 13 arithmetic operators .................................................................................................. 254 vbs controls ............................................................................................................. 255 if . . . ...
Page 14
14 sda-om-e rev h creating a customdso setup file............................................................................ 283 customdso plugin mode ......................................................................................... 284 creating a customdso plugin..............................
Page 15: Sda Operator’S Manual
Sda operator’s manual sda-om-e rev h 15 jitter wizard ............................................................................................................... 309 sda basic setup ....................................................................................................... 312 pll se...
Page 16
16 sda-om-e rev h sda function reference .................................................................................. 346 altncycle ................................................................................................................... 347 altncycle control summary ...................
Page 17: Sda Operator’S Manual
Sda operator’s manual sda-om-e rev h 17 vertical noise compensation .................................................................................... 385 introduction ........................................................................................................................... 385 si...
Page 18: Introduction
Introduction how to use online help type styles activators of pop-up text and images appear as green, underlined, italic: pop-up . To close pop-up text and images after opening them, touch the pop-up text again. Link text appears blue and underlined: link . Links jump you to other topics, urls, or i...
Page 19: Sda Operator’S Manual
Sda operator’s manual once opened, the help window will display its navigation pane: the part of the window that shows the table of contents and index. When you touch anywhere outside of the help window, this navigation pane will disappear to reveal more of your signal. To make it return, touch the ...
Page 20
20 sda-om-e rev h staying up-to-date to maintain your instrument’s performance within specifications, have us calibrate it at least once a year. Lecroy offers state-of-the-art performance by continually refining and improving the instrument’s capabilities and operation. We frequently update both fir...
Page 21: Sda Operator’S Manual
Sda operator’s manual sda-om-e rev h 21 end-user license agreement for lecroy x-stream software important-read carefully: this end-user license agreement (“eula”) is a legal agreement between the individual or entity licensing the software product (“you” or “your”) and lecroy corporation (“lecroy”) ...
Page 22
22 sda-om-e rev h software product is licensed as a single product. Its component parts may not be separated for use by more than one user. This eula does not grant you any rights in connection with any trademarks or service marks of lecroy. The software product is protected by copyright laws and in...
Page 23: Sda Operator’S Manual
Sda operator’s manual sda-om-e rev h 23 software product. “interoperability” will have the same meaning in this eula as defined in the digital millennium copyright act, 17 u.S.C. §1201(f), the ability of computer programs to exchange information and of such programs mutually to use the information w...
Page 24
24 sda-om-e rev h you shall bear the responsibility for any breaches of confidentiality by your employees and consultants. Within ten (10) days after request of the disclosing party, and in the disclosing party's sole discretion, the receiving party shall either return to the disclosing party origin...
Page 25: Sda Operator’S Manual
Sda operator’s manual sda-om-e rev h 25 5. U.S. Government restricted rights. If any software product or documentation is acquired by or on behalf of a unit or agency of the united states government (any such unit or agency, the “government”), the government agrees that the software product or docum...
Page 26
26 sda-om-e rev h 7. Risk allocation. 7.1 no warranty. The software product is not error-free and the software product and support services is/are being provided "as is" without warranty of any kind. Lecroy, for itself and its suppliers, hereby disclaims all warranties, whether express or implied, o...
Page 27: Sda Operator’S Manual
Sda operator’s manual sda-om-e rev h 27 8.3 entire agreement; waiver; severability. This eula constitutes the entire agreement between the parties with regard to the subject matter hereof. No provision of, right, power or privilege under this eula will be deemed to have been waived by any act, delay...
Page 28: Sda Specifications
Sda specifications note: specifications are subject to change without notice. Vertical system sda 6000/6000a/6020 sda 5000/5000a sda 4000a/4020 sda 3010 analog bandwitdth at 50 Ω (-3 db) 6 ghz 5 ghz 4 ghz 3 ghz rise time (10-90% typical) 75 ps 90 ps 105 ps 150 ps rise time (20-80% typical) na na na ...
Page 29: Sda Operator’S Manual
Sda operator’s manual sda-om-e rev h 29 horizontal system • timebases: internal timebase common to 4 input channels; an external clock may be applied at the auxiliary input (sda 6020 only) • math & zoom traces: 8 math/zoom traces standard • clock accuracy: ≤ 1 ppm @ 0 to 40 degrees c (sda 3010 ≤ 10 ...
Page 30
30 sda-om-e rev h memory • sda 6020/4020: 20 mpts/ch. Option sda-xl: 25 mpts/ch, 50 mpts/ch for 2 or 1 • ch.Sda6000a xxl/sda4000a xxl: 50 mpts/ch, 100 mpts/ch for 2 or 1 ch • sda3010: 10 mpts/ch, 20 mpts/ch for 2 or 1 ch. Option sda-xl: 25 mpts/ch, 50 mpts.Ch for 2 or 1 ch. Sda 18000/13000/11000/900...
Page 31: Sda Operator’S Manual
Sda operator’s manual • external trigger input range: aux (±0.4 v); aux x10 (±0.04 v); aux /10 (±4 v) not available on sda 6000a, sda 5000a, sda 4000a automatic setup • auto setup: automatically sets timebase, trigger, and sensitivity to display a wide range of repetitive signals. • vertical find sc...
Page 32
32 sda-om-e rev h serial trigger available on sda 6000a (xxl), sda 5000a (xxl), sda 4000a (xxl) data type nrz encoded for clock extraction (needs edge density > 20%) sensitivity 1 division minimum and at least 10 mv p-p min. Frequency 50 mhz max. Frequency 2.7 ghz serial trigger length up to 32 bits...
Page 33: Sda Operator’S Manual
Sda operator’s manual sda-om-e rev h 33 math tools – standard display up to eight math function traces (f1 to f8). The easy-to-use graphical interface simplifies setup of up to two operations on each function trace. Function traces can be chained together to perform math-on-math. Absolute value aver...
Page 34
34 sda-om-e rev h pass/fail testing simultaneously test multiple parameters against selectable parameter limits or pre-defined masks. Pass or fail conditions can initiate actions including document to local or networked files, email the image of the failure, save waveforms, send a pulse out of the f...
Page 35: Sda Operator’S Manual
Sda operator’s manual sda-om-e rev h 35 asda-j - standard this package includes: • edge-to-edge jitter • clock jitter • filtered jitter • effective and mjsq jitter • isi plot of data dependent jitter • n-cycle jitter plot • bit error rate analysis • mask violation 8b/10b protocol decoding - standard...
Page 36
36 sda-om-e rev h analog persistence display • analog & color-graded persistence: variable saturation levels; stores each traces persistence data in memory. • persistence selections: select analog, color, or three dimensional. • trace selection: activate analog persistence on all or any combination ...
Page 37: Sda Operator’S Manual
Sda operator’s manual sda-om-e rev h 37 general • auto calibration: ensures specified dc and timing accuracy is maintained for 1 year minimum. • power requirements: 100 to 120 vac at 50/60/400 hz; 200 to 240 vac at 50/60 hz; power consumption: 650 va, 650 w max. (sda 3010/4000a/5000a/6000a); 800 va,...
Page 38
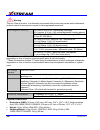
Warning this is a class a product. In a domestic environment this product may cause radio interference, in which case the user may be required to take appropriate measures. Electromagnetic immunity: en 61000-4-2/a2:2001* electrostatic discharge (4 kv contact, 8 kv air, 4 kv vertical/horizontal coupl...
Page 39: Sda Operator’S Manual
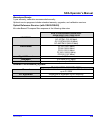
Sda operator’s manual warranty and service 3-year warranty; calibration recommended annually. Optional service programs include extended warranty, upgrades, and calibration services. Optical reference receiver (with oe425/oe455) 4th order bessel-thompson filter response at the following data rates: ...
Page 40
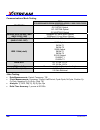
Communications mask testing sda 3010/4000a/4020/5000a/6020/6000a/9000/11000/13000/18000 sonet/sdh oc-1/stm0 oc-3/stm1 optical oc-12/stm4 optical oc-48/stm16 optical ethernet ieee std 802.3 and ansi x3.263-1995 1000base-sx short wave optical 1000base-lx long wave optical fibre channel electrical (ans...
Page 41: Sda Operator’S Manual
Sda operator’s manual bit error rate (optional) sda 4000a/sda 5000a/sda 6000a data rate ≤ 2.7 gb/s maximum capture buffer size (bits) 20 gs/s at 2.5 gb/s data rate (8 samples/bit) std. Vl (32m) xl (50m) xxl (100m) 1m 3m 5m 10m minimum detectable ber (single acquisition) 1 x 10 -7 sda-om-e rev h 41.
Page 42: Safety
Safety safety requirements this section contains information and warnings that must be observed to keep the instrument operating in a correct and safe condition. You are required to follow generally accepted safety procedures in addition to the safety precautions specified in this section. Safety sy...
Page 43: Sda Operator’S Manual
Sda operator’s manual cat i installation (overvoltage) category rating per en 61010-1 safety standard and is applicable for the oscilloscope front panel measuring terminals. Cat i rated terminals must only be connected to source circuits in which measures are taken to limit transient voltages to an ...
Page 44
Installation (overvoltage) category ii refers to local distribution level, which is applicable to equipment connected to the mains supply (ac power source). Installation (overvoltage) category i refers to signal level, which is applicable to equipment measuring terminals that are connected to source...
Page 45: Sda Operator’S Manual
Sda operator’s manual power consumption sda 6020, 4020, 9000, 11000, 13000, 18000: ≤ 800 watts (800 va) depending on accessories installed (internal printer, probes, pc port plug-ins, etc.) sda 4000a, 5000a, 6000a: ≤ 650 watts (650 va) the power supply of the scope is protected against short circuit...
Page 46
Standby (power) switch and scope operational states the front standby (power) switch controls the operational state of the scope. This toggle switch is activated by momentarily pressing and releasing it. The color of the led below the switch indicates the status of the scope as follows: • on (led gr...
Page 47: Sda Operator’S Manual
Sda operator’s manual calibration the recommended calibration interval is one year and should be performed by qualified personnel only. Cleaning clean only the exterior of the instrument, using a damp, soft cloth. Do not use chemicals or abrasive elements. Under no circumstances allow moisture to pe...
Page 48: Basic Controls
Basic controls alternate access methods note:the instrument often provides more than one way to access dialogs and menus. Mouse and keyboard operation touch-screen operation is used for most procedures explained in our manuals. However, if you have a mouse connected to the instrument, you can also b...
Page 49: Sda Operator’S Manual
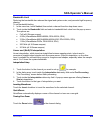
Sda operator’s manual another example includes the buttons appearing at the bottom of the measure px dialogs. Each button opens a menu from which to choose a math trace (f1 to fx - the number of math traces available depends on the software options loaded on your scope, so please refer to your scope...
Page 50
Shown (as follows) the timebase and trigger labels are setup information for horizontal cursors, including the time between cursors and the frequency. Trace annotation the instrument gives you the ability to add an identifying label, bearing your own text, to a waveform display: for each waveform, y...
Page 51: Sda Operator’S Manual
Sda operator’s manual annotating a waveform 1. Touch the waveform you want to annotate, and then set label... In the pop-up menu. A dialog box opens in which to create the label. If you are creating a label for the first time for this waveform, label1 is displayed with default text. If you are modif...
Page 52
Turning on a channel trace label note: if you want to display each trace on its own grid automatically, enable autogrid by touching display in the menu bar, then autogrid in the drop-down menu. • on the front panel, press a channel select button, such as , to display the trace label for that input c...
Page 53: Sda Operator’S Manual
Sda operator’s manual installation software checking the scope status to find out the scope's software and hardware configuration, including software version and installed options, proceed as follows: • in the menu bar, touch . • touch the tab. You can find information related to hard drive memory, ...
Page 54
2. In the dialog area, touch the tab. 3. Touch . 4. Use the pop-up keyboard to type the key code. Touch o.K. On the keyboard to enter the information. 5. The name of the feature you just installed is shown below the list of key codes. You can use the scroll buttons to see the name of the option inst...
Page 55: Sda Operator’S Manual
Sda operator’s manual if you minimize the application, touch the appropriate task bar or desktop icon to maximize it: restarting the operating system to restart the windows® operating system, reboot the scope by pressing and holding in the power switch for 10 seconds (until the system shuts down). P...
Page 56: Connecting to A Signal
Protective cover connecting to a signal probus interface lecroy's probus® probe system provides a complete measurement solution from probe tip to oscilloscope display. Probus allows you to control transparent gain and offset directly from your front panel. It is particularly useful for voltage, diff...
Page 57: Sda Operator’S Manual
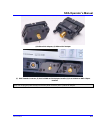
Sda operator’s manual (1) bma-to-sma adapter; (2) bma-to-bnc adapter (1) bma female connector, (2) prolink bma-to-sma adapter installed, (3) prolink bma-to-bnc adapter installed note: when connecting an active probe to the instrument, be sure to use a prolink bma-to-bnc adapter (item 3 in the figure...
Page 58
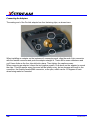
Connecting the adapters the mating end of the prolink adapter has four fastening clips, as shown here: when installing an adapter on the instrument's connector panel, align the male 6-pin connector with the female connector and push the adapter straight in. There will be some resistance and you'll h...
Page 59: Sda Operator’S Manual
Sda operator’s manual ap-1m hi-z adapter the ap-1m adapter provides a means to connect a high-impedance input to your instrument. In order to achieve high bandwidth with excellent signal integrity, these instruments have a ±4 v dynamic range and 50 Ω termination to ground. However, for applications ...
Page 60
Auxiliary output signals in addition to a calibration signal, the following signals can be output through the aux output connector: square wave trigger out - can be used to trigger another scope dc level - a reference level trigger enabled - can be used as a gating function to trigger another instru...
Page 61: Sda Operator’S Manual
Sda operator’s manual sampling modes sampling modes depending on your timebase, you can choose either single-shot (real time) , sequence , or ris mode sampling. Sampling mode selection 1. In the menu bar, touch timebase, then horizontal setup... In the drop-down menu. 2. In the "horizontal" dialog, ...
Page 62
Because each instrument input channel has a dedicated adc (analog-to-digital converter), the voltage on each is sampled and measured at the same instant. This allows very reliable time measurements between the channels. On fast timebase settings, the maximum single-shot sampling rate is used. But fo...
Page 63: Sda Operator’S Manual
Sda operator’s manual you can also use sequence mode in remote operation to take full advantage of the instrument's high data-transfer capability. How the instrument captures segments sequence mode setup note: once a single acquisition has started, you can interrupt the acquisition at any time by pr...
Page 64
7. At the far right of the "display" dialog, touch inside the display mode field, and make a selection from the pop-up menu. 8. Touch inside the num seg displayed field and enter a value from 1 to 80, using the pop-up numeric keypad. 9. Touch inside the starting at field and enter a starting segment...
Page 65: Sda Operator’S Manual
Sda operator’s manual overlay perspective the number of segments you choose to display (80 maximum) can be less than the total number of segments in the waveform. For example, in the pop-up images above, the number of display segments is 10, but the total number of segments entered in the timebase d...
Page 66
Viewing time stamps 1. In the menu bar, touch timebase, then touch acquisition status... In the drop-down menu. 2. Touch the time tab. 3. Touch one of the channel buttons under select waveform. 4. Touch inside the select segment field and enter a segment number, using the pop-up keypad. Ris sampling...
Page 67: Sda Operator’S Manual
Sda operator’s manual roll mode roll mode applies only to wavepro 7000 and waverunner 6000 series scopes. It is invoked automatically when the time per division is 500 ms/div or greater. However, you can cancel roll mode and return to real time mode at any time. Roll mode displays, in real time, inc...
Page 68
Adjusting the waveform's position turn the vertical offset adjust knob directly above the channel button whose waveform you want to move vertically. Or, you can touch inside the offset field and type in a value on the pop-up keypad. To set the vertical offset to zero, touch the zero offset button di...
Page 69: Sda Operator’S Manual
Sda operator’s manual bandwidth limit reducing the bandwidth also reduces the signal and system noise, and prevents high frequency aliasing. To set bandwidth limiting 1. In the menu bar, touch vertical, then select a channel from the drop-down menu. 2. Touch inside the bandwidth field and select a b...
Page 70
70 sda-om-e rev h finding scale you can access the find scale button from the channel setup dialog. This feature automatically calculates peak-to-peak voltage, and chooses an appropriate volts/div scale to fully display the waveform. Using find scale 1. Touch the trace label for the waveform you des...
Page 71: Sda Operator’S Manual
Sda operator’s manual group delay compensation group delay is defined as the rate of change of the total phase shift with respect to angular frequency through a device or transmission medium. An unavoidable consequence of correcting for group delay is that preshoot and overshoot will be added to the...
Page 72
Timebase and acquisition system timebase setup and control set up the timebase by using the front panel horizontal controls, just as for analog scopes. For additional timebase setups 1. Touch timebase in the menu bar, then horizontal setup... In the drop-down menu. The "horizontal" dialog appears. 2...
Page 73: Sda Operator’S Manual
Sda operator’s manual sda 13000/11000/9000 dbi controls when 13/11/9 ghz is selected, the active channels are either c2 or c3 or both, providing 40 gs/s sampling on each channel. For 6 ghz bandwidth, all four channels can be used, providing 20 gs/s sampling on each channel. Channels can be set to al...
Page 74: Triggering
74 sda-om-e rev h smart memory setup 1. Touch timebase in the menu bar, then smart mem setup... In the drop-down menu. 2. Touch the smart memory tab. 3. Under timebase mode, touch the set maximum memory or fixed sample rate button. Information about your choice appears below the buttons. The calcula...
Page 75: Sda Operator’S Manual
Sda operator’s manual in normal mode, the scope sweeps only if the input signal reaches the set trigger point. Otherwise it continues to display the last acquired waveform. In single mode, only one sweep occurs each time you press the button. Stop mode inhibits all sweeps until you select one of the...
Page 76
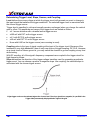
Determining trigger level, slope, source, and coupling level defines the source voltage at which the trigger circuit will generate an event: a change in the input signal that satisfies the trigger conditions. The selected trigger level is associated with the chosen trigger source. Trigger level is s...
Page 77: Sda Operator’S Manual
Sda operator’s manual sda-om-e rev h 77 trigger source the trigger on source may be one of the following: • the acquisition channel signal (ch 1, ch 2, ch 3 or ch 4) conditioned for the overall voltage gain, coupling, and bandwidth. • the line voltage that powers the oscilloscope (line). This can be...
Page 78
Hold off by time sometimes you can achieve a stable display of complex, repetitive waveforms by placing a condition on the time between each successive trigger event. This time would otherwise be limited only by the input signal, the coupling, and the instrument's bandwidth. Select a positive or neg...
Page 79: Sda Operator’S Manual
Sda operator’s manual hold off by events select a positive or negative slope and a number of events. An event is the number of times the trigger condition is met after the last trigger. A trigger is generated when the condition is met after this number, counted from the last trigger. The count is re...
Page 80
Control edge triggering horizontal: turn the delay knob in the horizontal control group to adjust the trigger's horizontal position. Or, touch inside the delay field in the timebase setup dialog and enter a value, using the pop-up keypad. The trigger location is shown by a marker under the grid: pos...
Page 81: Sda Operator’S Manual
Sda operator’s manual 3. Touch inside the trigger on data entry field and select an input from the pop-up menu: 4. Touch inside the level data entry field . In the pop-up numeric keypad, enter a value in millivolts or use the up/down buttons to increase or decrease the value in increments of 1 mv. O...
Page 82
• or, use the up/down buttons to increase or decrease the time value in increments of 200 ps. Or, touch one of the preset value buttons: the preset time values are as follows: max. 20.0 s default 50.0 ns min. 2 ns the preset events values are as follows: max. 1,000,000,000 events default 1 event min...
Page 83: Sda Operator’S Manual
Sda operator’s manual smart triggers width trigger how width trigger works width trigger allows you to define a positive- or negative-going pulse width bounded by a voltage level, above or below which a trigger will occur. You can specify a pulse width and voltage range, within or outside of which a...
Page 84
Glitch trigger how glitch trigger works glitch trigger can be used to catch glitches. You can specify a pulse width or a pulse width range. Pulse smaller than selected pulse width: set a maximum pulse width. This glitch trigger is generated on the selected edge (positive or negative) when the pulse ...
Page 85: Sda Operator’S Manual
Sda operator’s manual glitch trigger setup 1. In the menu bar, touch trigger, then trigger setup... In the drop-down menu. 2. Touch the glitch trigger button . 3. Touch inside the trigger on data entry field and select a source on which to trigger. 4. Touch inside the level data entry field and ente...
Page 86
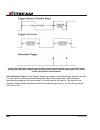
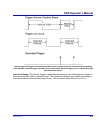
Interval trigger that triggers when the interval width is smaller than the selected interval. The broken, upward- pointing arrow indicates a potential trigger, while the bold one shows where the actual trigger occurs on the positive edge within the selected interval. Interval greater than: for this ...
Page 87: Sda Operator’S Manual
Sda operator’s manual interval trigger that triggers when the interval width is larger than the set interval. The broken upward-pointing arrow indicates a potential trigger, while the bold one shows where the actual trigger occurs on the positive edge after the selected interval. Interval in range: ...
Page 88
Interval trigger that triggers when the interval falls within the selected range: t1 = range's lower time limit; t2 = range's upper limit. The broken upward-pointing arrow indicates a potential trigger, while the bold one indicates where the actual trigger occurs on the positive edge within the sele...
Page 89: Sda Operator’S Manual
Sda operator’s manual 6. Touch the delta button to set up a nominal range, plus or minus a delta value in seconds. Touch inside the nominal width and delta data entry fields and enter values using the pop-up numeric keypads. 7. Touch the limits button to set up a precise range. Touch inside the lowe...
Page 90
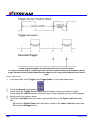
Edge qualified and wait: trigger after timeout. The broken upward-pointing arrows indicate potential triggers, while the bold ones show where the actual triggers occur. Qualified first trigger qualified first trigger is intended to be used exclusively in sequence mode to speed up the trigger rate. W...
Page 91: Sda Operator’S Manual
Sda operator’s manual 4. Touch inside the after data entry field and select the qualifying signal source from the pop-up menu. If you select an input channel or external source, touch inside the has gone data entry field and select a logic level: above or below. Then touch inside the level field and...
Page 92
State qualified trigger setup 1. In the menu bar, touch trigger, then trigger setup... In the drop-down menu. 2. Touch the state trigger button . 3. Touch inside the trigger on data entry field and select a source on which to trigger: 4. Select positive or negative slope. 5. Touch inside the has gon...
Page 93: Sda Operator’S Manual
Sda operator’s manual how dropout trigger works dropout trigger: occurs when the timeout has expired. The bold upward-pointing arrows show where the trigger occurs. Dropout trigger setup 1. In the menu bar, touch trigger, then trigger setup... In the drop-down menu. 2. Touch the dropout trigger butt...
Page 94
Logic trigger how logic trigger works logic trigger enables triggering on a logical combination of up to five inputs: ch 1, ch 2, ch 3, ch 4, and ext. The combination of inputs is referred to as a pattern. There are four logic gates available: and, nand, or, nor. A trigger state is either high or lo...
Page 95: Sda Operator’S Manual
Sda operator’s manual 5. Touch inside the level data entry field for each input included in the pattern and enter a voltage level threshold using the pop-up numeric keypad. 6. Touch the trigger tab. 7. If you want to hold off the trigger (either in time or events) when the pattern becomes true, touc...
Page 96: Display Formats
5. Touch vertical in the menu bar, then channels status... In the drop-down menu to view a summary of the aux input setup: display formats display setup 1. In the menu bar, touch display; then touch display setup in the drop-down menu. 2. Touch one of the grid combination buttons: as selections are ...
Page 97: Sda Operator’S Manual
Sda operator’s manual 6. Choose a line style for your trace: solid line or points . Sequence mode display to a set up sequence mode display, you must first have selected sequence trigger mode in the timebase "horizontal" dialog. You must also have entered a num segments value. 1. In the menu bar, to...
Page 98
You can select a saturation level as a percentage of the maximum population. All populations above the saturation population are then assigned the highest color intensity: that is, they are saturated. At the same time, all populations below the saturation level are assigned the remaining intensities...
Page 99: Sda Operator’S Manual
Sda operator’s manual sda-om-e rev h 99 here is a monochrome (analog) view of the same waveform. The lightest areas indicate highest intensity, corresponding to the red areas in the solid view. Here is a shaded (projected light) view of the same waveform. This view emphasizes the shape of the pulses...
Page 100: 100
Persistence time you can control the duration of persistence by setting a time limit, in seconds, after which persistence data will be erased: 0.5 s, 1 s, 2 s, 5 s, 10 s, 20 s, or infinity. Locking of traces the instrument gives you the choice of constraining all input channels to the same mode, sat...
Page 101: Sda Operator’S Manual
Sda operator’s manual 12. Under "3d settings," touch inside the quality field and select an image quality from the pop- up menu: wire frame, solid, or shaded. 13. For each axis, touch inside the data entry field and enter a value from -90° to +90°. 14. To turn off persistence for an individual chann...
Page 102: 102
Zooming waveforms the zoom button appears as a standard button at the bottom of the channel "cx vertical adjust" setup dialog if you want to create a math function zoom trace of your input waveform. On the other hand, you can zoom a memory or math function non-zoom trace directly without having to c...
Page 103: Sda Operator’S Manual
Sda operator’s manual zooming a single channel 1. In the menu bar, touch vertical; then touch a channel number in the drop-down menu. Alternatively, you can just touch the channel trace label for a displayed channel. 2. Touch at the bottom of the "cx vertical adjust dialog." a zoom math trace (one o...
Page 104: 104
5. Turn the front panel wavepilot position knobs to adjust the vertical and horizontal position of the zoom: 6. Turn the front panel zoom knobs to control the boundaries of the zoom. Zooming multiple waveforms quickly press the quickzoom button on the front panel. Math function traces f5 to f8 will ...
Page 105: Sda Operator’S Manual
Sda operator’s manual 5. Touch the multi-zoom on checkbox to enable multi-zoom. Then touch the include checkbox for each zoom trace you want to include in the time-locked multi-zoom: here the user has chosen to include only f2 and f3 in the multi-zoom, even though f4 is also a zoom function and is a...
Page 106: Save and Recall
Xy display setup 1. In the menu bar, touch display; then touch display setup... In the drop-down menu. 2. Choose an xy display by touching one of the xy display mode buttons . You have the choice of showing the two waveforms on just the xy grid, or you can also show the input waveforms on a single o...
Page 107: Sda Operator’S Manual
Sda operator’s manual recalling scope settings 1. In the menu bar, touch file; then touch recall setup... In the drop-down menu. 2. To recall from file, touch inside the recall panels from file data entry field and use the pop-up keyboard to enter the path to the source folder. Or touch browse to na...
Page 108: 108
7. Touch inside the file name field and type in a name for your image, using the pop-up keyboard. 8. Under include on print, touch the grid area only checkbox if you do not want to include the dialog area in the image. 9. Touch the print now button. Saving and recalling waveforms saving waveforms 1....
Page 109: Sda Operator’S Manual
Sda operator’s manual if you are saving to file, touch the data format field and select a format type from the pop-up menu: . If you select ascii or excel, also touch the subformat field and select either time data or time & ampl. Then touch the delimiter field and select a delimiter character from ...
Page 110: 110
Recalling waveforms 1. In the menu bar, touch file; then touch recall waveform... In the drop-down menu. 2. In the "recall waveform" dialog, touch the recall from or button. 3. If you selected memory, touch inside the source field and select a memory location: m1 to m4. 4. If you selected file, touc...
Page 111: Sda Operator’S Manual
Sda operator’s manual deleting all files in a folder 1. Touch file in the menu bar, then disk utilities... In the drop-down menu. 2. Touch the delete button in the "disk utilities" dialog. 3. Touch inside the current folder data entry field and use the pop-up keyboard to enter the path to the folder...
Page 112: 112
Printing you can print in one of three ways: • press the printer button on the front panel: • in the menu bar, touch file, then print in the drop-down menu. • touch the print now button in the "hardcopy" dialog adding printers and drivers note: if you want to add a printer driver, the driver must fi...
Page 113: Sda Operator’S Manual
Sda operator’s manual 100base-t ethernet connection connecting to a network use the ethernet connector (item 8 in the rear panel diagram) to connect the instrument to a network. Communicating over the network in its default configuration the instrument is set up to use the dhcp protocol to retrieve ...
Page 114: 114
114 sda-om-e rev h • after you load third-party software applications, if your scope does not work properly try reloading the instrument software from the cd shipped with the scope. If your instrument is not equipped with a cd drive, you will need a usb cd-rom to do this (not supplied by lecroy). Th...
Page 115: Sda Operator’S Manual
Sda operator’s manual 5. Touch the trend button at the bottom of the dialog; then, from the math selection for trend menu, select a math function location (f1 to fx the number of math traces available depends on the software options loaded on your scope. See specifications.) to store the trend displ...
Page 116: Histograms
5. Touch the track button at the bottom of the dialog; then, from the math selection for track menu, select a math function location (f1 to fx the number of math traces available depends on the software options loaded on your scope. See specifications.) to store the track display. The track will be ...
Page 117: Sda Operator’S Manual
Sda operator’s manual 6. Touch the histogram button at the bottom of the dialog. 7. Touch a math trace in which to place the resulting histogram, then close the pop-up menu. 8. Touch the math trace label for the math trace you just created. 9. In the dialog to the right, touch the histogram tab. 10....
Page 118: 118
Viewing thumbnail histograms histicons are miniature histograms of parameter measurements that appear below the grid. These thumbnail histograms let you see at a glance the statistical distribution of each parameter. 1. In the menu bar, touch measure, then one of the measure mode buttons: std vertic...
Page 119: Sda Operator’S Manual
Sda operator’s manual histogram parameters fwhm full width at half maximum definition: determines the width of the largest area peak, measured between bins on either side of the highest bin in the peak that have a population of half the highest's population. If several peaks have an area equal to th...
Page 120: 120
120 sda-om-e rev h fwxx full width at xx% maximum definition: determines the width of the largest area peak, measured between bins on either side of the highest bin in the peak that have a population of xx% of the highest's population. If several peaks have an area equal to the maximum population, t...
Page 121: Sda Operator’S Manual
Sda operator’s manual sda-om-e rev h 121 hist ampl histogram amplitude definition: the difference in value of the two most populated peaks in a histogram. This parameter is useful for waveforms with two primary parameter values, such as ttl voltages, where hampl would indicate the difference between...
Page 122: 122
Hbase histogram base definition: the value of the leftmost of the two most populated peaks in a histogram. This parameter is primarily useful for waveforms with two primary parameter values such as ttl voltages where hbase would indicate the binary `0' voltage value. Description: the two highest his...
Page 123: Sda Operator’S Manual
Sda operator’s manual hist rms histogram root mean square definition: the rms value of the values in a histogram. Description: the center value of each populated bin is squared and multiplied by the population (height) of the bin. All results are summed and the total is divided by the population of ...
Page 124: 124
Hist top histogram top definition: the value of the rightmost of the two most populated peaks in a histogram. This parameter is useful for waveforms with two primary parameter values, such as ttl voltages, where htop would indicate the binary `1' voltage value. Description: the two highest histogram...
Page 125: Sda Operator’S Manual
Sda operator’s manual maxp maximum population definition: the count (vertical value) of the highest population bin in a histogram. Description: each bin between the parameter cursors is examined for its count. The highest count is returned as maxp. Example: on the following histogram, the maxp is 14...
Page 126: 126
Mode mode definition: the value of the highest population bin in a histogram. Description: each bin between the parameter cursors is examined for its population count. The leftmost bin with the highest count found is selected. Its center value is returned as mode. Example: here, the mode is 150 mv. ...
Page 127: Sda Operator’S Manual
Sda operator’s manual sda-om-e rev h 127 pctl percentile definition: computes the horizontal data value that separates the data in a histogram such that the population on the left is a specified percentage `xx' of the total population. When the threshold is set to 50%, pctl is the same as hmedian. D...
Page 128: 128
Pks peaks definition: the number of peaks in a histogram. Description: the instrument analyzes histogram data to identify peaks from background noise and histogram binning artifacts such as small gaps. Peak identification is a 3-step process: the mean height of the histogram is calculated for all po...
Page 129: Sda Operator’S Manual
Sda operator’s manual range range definition: computes the difference between the value of the rightmost and that of the leftmost populated bin. Description: the rightmost and leftmost populated bins are identified. The difference in value between the two is returned as the range. Example: in this e...
Page 130: 130
Totp total population definition: calculates the total population of a histogram between the parameter cursors. Description: the count for all populated bins between the parameter cursors is summed. Example: the total population of this histogram is 9. 130 sda-om-e rev h.
Page 131: Sda Operator’S Manual
Sda operator’s manual xapk x coordinate of xx th peak definition: returns the value of the xx th peak that is the largest by area in a histogram. Description: first the peaks in a histogram are determined and ranked in order of total area (for a discussion on how peaks are identified see the descrip...
Page 132: 132
Histogram theory of operation an understanding of statistical variations in parameter values is needed for many waveform parameter measurements. Knowledge of the average, minimum, maximum, and standard deviation of the parameter are often enough. However, in many cases you may need a more detailed u...
Page 133: Sda Operator’S Manual
Sda operator’s manual sda-om-e rev h 133 dso process this instrument can be used to generate histograms of the parameter values of input waveforms. The follwing items must be defined before doing so: • the parameter to be histogrammed • the trace on which the histogram is to be displayed • the maxim...
Page 134: 134
134 sda-om-e rev h capture of parameter events the number of events captured per waveform acquisition or display sweep depends on the parameter type. Acquisitions are initiated by the occurrence of a trigger event. Sweeps are equivalent to the waveform captured and displayed on an input channel (1, ...
Page 135: Sda Operator’S Manual
Sda operator’s manual • hist top histogram top or rightmost of two largest peaks • max populate population of most populated bin in histogram • mode data value of most populated bin in histogram • percentile data value in histogram for which specified `x'% of population is smaller • peaks number of ...
Page 136: Waveform Measurements
Nevertheless, using more bins may require that you perform a greater number of waveform parameter measurements, in order to populate the bins sufficiently for the identification of a characteristic histogram distribution. In addition, very fine grained binning will result in gaps between populated b...
Page 137: Sda Operator’S Manual
Sda operator’s manual sda-om-e rev h 137 cursors setup quick display at any time, you can change the display of cursor types (or turn them off) without invoking the "cursors setup" dialog as follows: 1. In the menu bar, touch cursors, then off, abs horizontal, rel horizontal, abs vertical, or rel ve...
Page 138: 138
Quick access to parameter setup dialogs you can quickly gain access to a parameter setup dialog by touching the parameter list box below the grid. For example, touching within p1 below the grid displays the setup dialog for p1: touching the row titles displays the top measure dialog. 138 sda-om-e re...
Page 139: Sda Operator’S Manual
Sda operator’s manual status symbols below each parameter appears a symbol that indicates the status of the parameter, as follows: a warning symbol indicates that there is something wrong with the signal or the setup. Touch the parameter list box and read the explanation in the message line at the b...
Page 140: 140
2. Touch the x-stream browser desktop icon to open the browser. 3. Touch the left scope icon ("connect to a local x-stream dso device") in the x-stream browser toolbar: 4. Select measure parameter in error (p1) out result 5. Read the status information in line statusdescription. 140 sda-om-e rev h.
Page 141: Sda Operator’S Manual
Sda operator’s manual sda-om-e rev h 141 statistics touching the statistics on checkbox in the "measure" dialog displays statistics for standard vertical or horizontal parameters, or for custom parameters. The statistics shown are as follows: value (last) mean min. Max. Sdev num the values displayed...
Page 142: 142
142 sda-om-e rev h standard horizontal parameters these are the default standard horizontal parameters: horizontal freq period width rise fall delay duty npoints my measure you can choose to customize up to eight parameters by touching my measure. Parameter math (xmath or xmap option required) the i...
Page 143: Sda Operator’S Manual
Sda operator’s manual • mtntmt shift (bees) • mtntmt shift sigma (beess) • mtntmt shift sigma – list (beess) parameter script parameter math in addition to the arithmetic operations, the parameter math feature allows you to use vbscript or javascript to write your own script for one or two measureme...
Page 144: 144
The inputs to param script can also be math (f1-fx) or memory (m1-mx) traces. The inputs to p script can be the results of any parameter measurement, not necessarily param script. Parameter math setup 1. Touch measure in the menu bar, then measure setup... In the drop-down menu. 2. Touch the my meas...
Page 145: Sda Operator’S Manual
Sda operator’s manual 4. In the "px" dialog, touch the math on parameters button . The source field will expand to two fields. 5. Touch inside the source1 and source2 fields and select the parameters you want to apply math to (p1 to px). If you are applying math to a single parameter (for example, i...
Page 146: 146
In this example, you can see that the measure gate includes only five rising edges. Therefore, parameter calculations for rise time are performed only on the five pulses bounded by the gate posts. The position of the gate posts is shown in the start and stop fields in the accompanying dialog. Measur...
Page 147: Sda Operator’S Manual
Sda operator’s manual example parameter readout 3. Touch inside the start data entry field and enter a value, using the pop-up numeric keypad. Or, you can simply touch the leftmost grid line and drag the gate post to the right. 4. Touch inside the stop data entry field and enter a value, using the p...
Page 148: 148
Standard horizontal parameter help markers standard vertical parameter help markers 148 sda-om-e rev h.
Page 149: Sda Operator’S Manual
Sda operator’s manual help marker setup 1. In the menu bar, touch measure setup... 2. Select a measure mode: std vertical, std horizontal, or my measure. 3. Touch the show all button to display help markers for every parameter being measured on the displayed waveform (c2 in the examples above). 4. T...
Page 150: 150
3. If you want to change the parameter listed, or a measurement characteristic, touch the parameter button (p1 for example) alongside the check box. A pop-up menu of parameters categorized by type appears. To display parameter icons only, touch the icon button at the bottom of the menu. To display t...
Page 151: Sda Operator’S Manual
Sda operator’s manual the analysis attempts to identify the two clusters containing the largest data density. Then, the most probable state (centroids) associated with these two clusters is computed to determine the top and base reference levels: the top line corresponds to the top and the base line...
Page 152: 152
The time interval separating the points on the rising or falling edges is then estimated to yield the rise or fall time. These results are averaged over the number of transition edges that occur within the observation window. Rising edge duration falling edge duration where mr is the number of leadi...
Page 153: Sda Operator’S Manual
Sda operator’s manual time-parameter estimation depends on the number of cycles included within the observation window. If the number of cycles is not an integer, parameter measurements such as rms or mean are biased. However, only the last value is actually displayed, the mean being available when ...
Page 154: 154
Determining differential time measurements the instrument enables accurate differential time measurements between two traces: for example, propagation, setup and hold delays (see figure 3). Parameters such as delta c2d± require the transition polarity of the clock and data signals to be specified. F...
Page 155: Sda Operator’S Manual
Sda operator’s manual list of parameters the following table describes the instrument parameters. Availability of some parameters depends on the options installed. See the comments in the "notes" column of the table. Parameter description definition notes 100bt fall fall time between 2 levels (upper...
Page 156: 156
Parameter description definition notes area integral of data: computes area of waveform between cursors relative to zero level. Values greater than zero contribute positively to the area; values less than zero negatively. Sum from first to last of data multiplied by horizontal time between points st...
Page 157: Sda Operator’S Manual
Sda operator’s manual parameter description definition notes cyclic std dev cyclic standard deviation: standard deviation of data values from mean value over integral number of periods. Contrary to sdev, calculation is performed over an integral number of cycles, eliminating bias caused by fractiona...
Page 158: 158
Parameter description definition notes dtime@level t at level: computes transition between selected levels or sources. Time between transition levels of two sources, or from trigger to transition level of a single source this measurement gives the time of the source 2 edge minus the time of the sour...
Page 159: Sda Operator’S Manual
Sda operator’s manual sda-om-e rev h 159 parameter description definition notes edge@level number of edges in waveform. Reference levels and edge- transition polarity can be selected. Hysteresis argument used to discriminate levels from noise in data. Available with jta2, usb2, sda, and xmap options...
Page 160: 160
Parameter description definition notes eye falltime fall time of the mean of persistence data standard in sda and waveexpert scopes. Eye height size of the vertical opening of an eye diagram available with sda and sdm options. Standard in sda, sda100g, and waveexpert scopes. Eye mean mean level of a...
Page 161: Sda Operator’S Manual
Sda operator’s manual parameter description definition notes fall time fall time: duration of falling edge from 90-10%. Threshold arguments specify two vertical values on each edge used to compute fall time. Formulas for upper and lower values: lower = lower thresh. X amp/100 + base upper = upper th...
Page 162: 162
Parameter description definition notes frequency frequency: period of cyclic signal measured as time between every other pair of 50% crossings. Starting with first transition after left cursor, the period is measured for each transition pair. Values then averaged and reciprocal used to give frequenc...
Page 163: Sda Operator’S Manual
Sda operator’s manual parameter description definition notes hist maximum value of the highest (right-most) populated bin in a histogram. Available with ddm2, jta2, xmath, xwav, can02, sda, and xmap options. Standard in dda-5005a, sda100g, waveexpert, and sampling scopes. Hist max pop peak with maxi...
Page 164: 164
Parameter description definition notes hist range calculates range (max - min) of a histogram. Available with ddm2, jta2, enet, xmath, xwav, can02, sda, and xmap options. Standard in dda-5005a, sda100g, waveexpert, and sampling scopes. Hist rms root mean square of the values in a histogram. Availabl...
Page 165: Sda Operator’S Manual
Sda operator’s manual parameter description definition notes jitter filter jitter in the specified frequency band. Generates a time sequence of jitter measurements that are filtered by the selected band-pass filter. Available with asda option. Last time from trigger to last (rightmost) cursor. Time ...
Page 166: 166
Parameter description definition notes local number number of local features (peak/trough pairs). Hysteresis argument used to discriminate levels from noise in data. Available with ddm2 option. Standard in dda-5005a. Local pkpk vertical difference between the peak and trough of a local feature (lmax...
Page 167: Sda Operator’S Manual
Sda operator’s manual parameter description definition notes local ttp time between local feature trough and the next local peak. Hysteresis argument used to discriminate levels from noise in data. Available with ddm2 option. Standard in dda-5005a. Local tut time a local feature spends under a user ...
Page 168: 168
168 sda-om-e rev h parameter description definition notes minimum measures the lowest point in a waveform. Unlike base, does not assume waveform has two levels. Lowest value in waveform between cursors gives similar result when applied to time domain waveform or histogram of data of same waveform. B...
Page 169: Sda Operator’S Manual
Sda operator’s manual parameter description definition notes param script visual basic or java script that produces a measurement from one or two input waveforms. Available with xmap, xdev, and asda options. Standard in dda-5005a. Peak mag peak mag away from a baseline. Note: the measure gate must i...
Page 170: 170
Parameter description definition notes period@level period at a specified level and slope for every cycle in waveform. Reference levels and edge- transition polarity can be selected. Hysteresis argument used to discriminate levels from noise in data. Available with jta2, aorm, enet, sda, and xmap op...
Page 171: Sda Operator’S Manual
Sda operator’s manual parameter description definition notes pw50+ average pulse width at the 50% point between the local baseline and the local peak. Hysteresis argument used to discriminate levels from noise in data. Available with ddm2 option. Standard in dda-5005a. Real power mean of the product...
Page 172: 172
Parameter description definition notes rise@level rise at level: duration of pulse waveform's rising edges between transition levels. Slew rate for % or absolute levels of rising or falling edges. Enhanced version sets measurement calculations to use one of the following: base & top (% or absolute) ...
Page 173: Sda Operator’S Manual
Sda operator’s manual parameter description definition notes skew time of clock1 edge minus time of nearest clock2 edge. Reference levels and edge- transition polarity can be selected. Hysteresis argument used to discriminate levels from noise in data. Hysteresis on a measurement (if set to 500 mdiv...
Page 174: 174
Parameter description definition notes taa- average local baseline-to-trough amplitude for all local features. Hysteresis argument used to discriminate levels from noise in data. Available with ddm2 option. Standard in dda-5005a. Taa+ average local baseline-to-peak amplitude for all local features. ...
Page 175: Sda Operator’S Manual
Sda operator’s manual parameter description definition notes total pop total population of a histogram. Available with ddm2, jta2, xmath, xwav, can02, sda, and xmap options. Standard in dda-5005a, sda100g, waveexpert, and sampling scopes tups upsamples a time parameter by nx available with sda and s...
Page 176: 176
Parameter description definition notes width@level width measured at a specific level. Time between two transitions of opposite slope at a specified level. (slope specified for 1st transition.) enhanced version sets measurement calculations to use one of the following: base & top (% or absolute) pea...
Page 177: Sda Operator’S Manual
Sda operator’s manual qualified parameters some lecroy instruments and software packages give you the ability to constrain parameter measurements to a vertically or horizontally limited range, or to occurrences gated by a second waveform. Furthermore, both constraints can operate together. This capa...
Page 178: Waveform Math
Waveform gated parameters waveform qualifier setup 1. From the menu bar, select measure, then measure setup... From the drop-down menu. 2. Touch a px tab to open the setup dialog. 3. Touch inside the source field and select a source from the pop-up menu. 4. Touch inside the measure field and select ...
Page 179: Sda Operator’S Manual
Sda operator’s manual for example: you could set up trace f1 as the difference between channels 1 and 2, trace f2 as the average of f1, and trace f3 as the integral of f2. You could then display the integral of the averaged difference between channels 1 and 2. Any trace and function can be chained t...
Page 180: 180
7. Touch the graph button, then touch inside the graph with field to select a graph mode. The graph modes are as follows: histogram of the values of a parameter track of the values of a parameter trend of the values of a parameter resampling to deskew deskew whenever you need to compensate for diffe...
Page 181: Sda Operator’S Manual
Sda operator’s manual sda-om-e rev h 181 event events f farad g gram h henry hz hertz j joule k degree kelvin cel degree celsius far degree fahrenheit l liter m meter ft foot in inch yard yard mile mile n newton ohm ohm pal pascal pct percent poise poise ppm parts per million rad radian deg degree (...
Page 182: 182
182 sda-om-e rev h you can also enter combinations of the above units following the si rules: • for the quotient of two units, the character / should be used • for the product of two units, the character . Should be used • exponents can be represented by a digit appended to the unit without a space ...
Page 183: Sda Operator’S Manual
Sda operator’s manual sda-om-e rev h 183 summed averaging summed averaging is the repeated addition, with equal weight, of successive source waveform records. If a stable trigger is available, the resulting average has a random noise component lower than that of a single-shot record. Whenever the ma...
Page 184: 184
184 sda-om-e rev h note: the number of sweeps used to compute the average will be displayed in the bottom line of the trace descriptor label: continuous averaging setup 1. In the menu bar, touch math, then math setup... In the drop-down menu. 2. Select a function tab from f1 through fx [the number o...
Page 185: Sda Operator’S Manual
Sda operator’s manual sda-om-e rev h 185 the instrument's constant phase fir (finite impulse response) filters provide fast computation, excellent step response in 0.5 bit steps, and minimum bandwidth reduction for resolution improvements of between 0.5 and 3 bits. Each step corresponds to a bandwid...
Page 186: 186
In low-pass filtering: the spectrum of a square signal before (left top) and after (left bottom) enhanced resolution processing. The result clearly illustrates how the filter rejects high-frequency components from the signal. The higher the bit enhancement, the lower the resulting bandwidth. To incr...
Page 187: Sda Operator’S Manual
Sda operator’s manual enhanced resolution (eres) setup 1. In the menu bar, touch math, then math setup... In the drop-down menu. 2. Touch a function tab f1 through fx [the number of math traces available depends on the software options loaded on your scope. See specifications.]. 3. Touch inside the ...
Page 188: 188
188 sda-om-e rev h waveform sparser setup 1. In the menu bar, touch math, then math setup... In the drop-down menu. Touch the tab 2. For the function (f1 to fx [the number of math trace software options loaded on your scope. See specifications.]) yo s available depends on the u want to assign the sp...
Page 189: Sda Operator’S Manual
Sda operator’s manual the technology that makes this system possible is the ability of two processes in a windows system to share a region of memory. This enables the transfer of data at high-speed between the acquisition software and the custom processing function, which runs in a separate process ...
Page 190: 190
5. In the right-hand mini-dialog, touch the fast wave port tab: 6. Touch inside the "timeout" field and enter a suitable value. Setup - case 1 this scenario assumes you have developed your application on a pc. 1. Compile your application on your pc. 2. Copy the compiled file onto the scope, using a ...
Page 191: Sda Operator’S Manual
Sda operator’s manual sda-om-e rev h 191 operational notes once fastwaveport is selected, the right-hand dialog shows the current settings. The first of these is critical, and indicates the base name of the memory window and the two events, which are global within the windows o/s. This should be lef...
Page 192: 192
192 sda-om-e rev h //------------------------------------------------------------------------------------------ // fastwaveportclient.Cpp : // // prototype c++ client application for "fast wave port' math processor // // compatibility: // microsoft visual c++ 6.0, 7.1 // mingw 'gcc' based compiler (...
Page 193: Sda Operator’S Manual
Sda operator’s manual sda-om-e rev h 193 }; #pragma pack(pop) // restore packing //------------------------------------------------------------------------------------------ // the buffer size is 80mb (40,000,000 samples, stored as short integers) plus 0x1000 bytes for the header. Const unsigned lon...
Page 194: 194
194 sda-om-e rev h while(1) { int i = 0; printf("waiting for new data..."); // wait an infinite amount of time for data to be available dword waitsuccess = waitforsingleobject(m_hdataavailable, infinite); // print the first few bytes of the input waveform cdescheader *descheader = (cdescheader *) ...
Page 195: Sda Operator’S Manual
Sda operator’s manual sda-om-e rev h 195 double verresolution; // vertical resolution of the measurement system (also in vertical units) double horinterval; // scale factor that relates integer sample indices to the horizontal units of the waveform. Double horoffset; // horizontal offset (in horizon...
Page 196: 196
196 sda-om-e rev h an fft operation on an n-point time domain signal can be compared to passing the signal through a comb filter consisting of a bank of n/2 filters. All the filters have the same shape and width and are centered at n/2 discrete frequencies. Each filter collects the signal energy tha...
Page 197: Sda Operator’S Manual
Sda operator’s manual if a signal contains a frequency component above nyquist, the spectrum will be aliased, meaning that the frequencies will be folded back and spurious. Spotting aliased frequencies is often difficult, as the aliases may ride on top of real harmonics. A simple way of checking is ...
Page 198: 198
Window type applications and limitations rectangular these are normally used when the signal is transient (completely contained in the time-domain window) or known to have a fundamental frequency component that is an integer multiple of the fundamental frequency of the window. Signals other than the...
Page 199: Sda Operator’S Manual
Sda operator’s manual fft algorithms a summary of the algorithms used in the oscilloscope's fft computation is given here in a few steps: 1. The data are multiplied by the selected window function. 2. Fft is computed, using a fast implementation of the dft (discrete fourier transform): where: x k is...
Page 200: 200
The waveforms for the other available spectrum types are computed as follows: phase: angle = arctan (i n /r n )_m n > m min _angle = 0_ m n m min where m min is the minimum magnitude, fixed at about 0.001 of the full scale at any gain setting, below which the angle is not well defined. The dbm power...
Page 201: Sda Operator’S Manual
Sda operator’s manual sda-om-e rev h 201 window frequency domain parameters window type highest side lobe (db) scallop loss (db) enbw (bins) coherent gain (db) rectangular -13 3.92 1.0 0.0 hanning (von hann) -32 1.42 1.5 -6.02 hamming -43 1.78 1.37 -5.35 flattop -44 0.01 2.96 -11.05 blackman–harris ...
Page 202: 202
202 sda-om-e rev h width. The table of window frequency-domain parameters lists the enbw values for the implemented windows. • leakage - in the power spectrum of a sine wave with an integral number of periods in the (rectangular) time window (that is, the source frequency equals one of the bin frequ...
Page 203: Sda Operator’S Manual
Sda operator’s manual • window functions - all available window functions belong to the sum of cosines family with one to three non-zero cosine terms: where: m = 3 is the maximum number of terms, a m are the coefficients of the terms, n is the number of points of the decimated source waveform, and k...
Page 204: Analysis
7. Choose whether to truncate 1 or zero-fill 2 the trace display. 8. Touch the suppress dc checkbox if you want to make the dc bin go to zero. Otherwise, leave it unchecked. 9. Touch inside the output type field, and make a selection from the pop-up menu. 10. Touch inside the window field, select a ...
Page 205: Sda Operator’S Manual
Sda operator’s manual in dual parameter compare mode, your x-stream scope gives you the option to compare to each other parameter results measured on two different waveforms. You can set your test to be true if any waveform or all waveforms fit the criterion stipulated by the comparison condition. Y...
Page 206: 206
The boolean conditions to determine if your waveform passes are as follows: all true all false any true any false all q1 to q4 or all q5 to q8 any q1 to q4 and any q5 to q8 setting up pass/fail testing initial setup 1. Touch analysis in the menu bar, then pass/fail setup... In the drop-down menu. 2....
Page 207: Sda Operator’S Manual
Sda operator’s manual 5. Touch inside the compare values field and select all or any from the pop-up menu . By selecting all, the test is true only if every waveform falls within the set limit. By selecting any, the test is be true if just one waveform falls within the limit. 6. Touch inside the con...
Page 208: 208
Comparing dual parameters 1. Touch analysis in the menu bar, then pass/fail setup... In the drop-down menu. 2. Touch a qx tab; a setup dialog for that position will open. 3. Touch inside the condition field in the main dialog and select dualparamcompare . 4. Touch inside the source1 and source2 fiel...
Page 209: Sda Operator’S Manual
Sda operator’s manual 9. If you chose either withindeltapct or withindeltaabs from the condition menu, touch inside the delta field and enter a value. Mask testing 1. Touch analysis in the menu bar, then pass/fail setup... In the drop-down menu. 2. Touch a qx tab; a setup dialog for that position wi...
Page 210: 210
210 sda-om-e rev h utilities status the status read-only dialog displays system information including serial number, firmware version, and installed software and hardware options. Status dialog access 1. In the menu bar, touch utilities. 2. Touch the status tab. Remote communication the remote dialo...
Page 211: Sda Operator’S Manual
Sda operator’s manual sda-om-e rev h 211 6. Touch make new connection and use the windows network connection wizard to make a new connection; or, touch local area connection to reconfigure the scope's connection if it is already connected to the network. Configuring the remote control assistant even...
Page 212: 212
6. Touch inside the file name data entry field and enter a name for the display image, using the pop-up keyboard. 7. Touch the grid area only checkbox if you do not need to print the dialog area and you only want to show the waveforms and grids. 8. Touch the print now button. E-mail the instrument a...
Page 213: Sda Operator’S Manual
Sda operator’s manual setting the time and date from the internet the simple network time protocol (sntp) is used. 1. Ensure that the scope is connected to the internet through the lan connector at the rear of the scope. 2. In the menu bar touch utilities, then utilities setup... In the drop-down me...
Page 214: 214
214 sda-om-e rev h options use this dialog to add or remove software options. For information about software options, contact your local lecroy sales and service office, or visit our web site at www.Lecroy.Com/options . Options that you purchase, such as jta2, add performance to you instrument. This...
Page 215: Sda Operator’S Manual
Sda operator’s manual delay control as you change the timebase, this control allows you to either keep the horizontal offset indicator stationary (when div is selected) or to have it move with the trigger point (when time is selected). The advantage of selecting div is that the trigger point will re...
Page 216: 216
216 sda-om-e rev h e-mail before you can send e-mail from the scope, it must first be configured. 1. In the menu bar touch utilities, then preference setup... In the drop-down menu. 2. Touch the e-mail tab. Choose an e-mail server protocol: mapi (messaging application programming interface) is the m...
Page 217: Sda Operator’S Manual
Sda operator’s manual service this button provides access to service dialogs, which are for the sole use of lecroy service personnel. A security code is required to gain access. Show windows desktop touching the show windows desktop button in the main "utilities" dialog minimizes the instrument appl...
Page 218: Customization
Customization customizing your instrument the instrument provides powerful capability to add your own parameters, functions, display algorithms, or other routines to the scope user interface without having to leave the instrument application environment. You can customize the instrument to your need...
Page 219: Sda Operator’S Manual
Sda operator’s manual the instrument does not just provide connectivity with data downloads to other programs. It provides true customizable interaction with these other programs, and allows you to truly customize the scope to do the exact job you want it to do. The advantages to this are many: • yo...
Page 220: 220
Waveout is the waveform being returned to the instrument (f1 in this case). Wavein is the input waveform (c1 in this case). You can see that the f1 result is displayed on the scope, and can be processed further. Example 2: another simple math functions using vbscript example 3 (as follows) doesn’t u...
Page 221: Sda Operator’S Manual
Sda operator’s manual here is the vbscript that produced the "golden sine" (f2 previous): frequency = 3000000.0 ' frequency of real data sampletime = inresult.Horizontalperstep omega = 2.0 * 3.1416 * frequency * sampletime amplitude = 0.15 ' amplitude of real data for k = 0 to lastpoint newdataarray...
Page 222: 222
Example 5 this next example shows a logarithmic vertical scale, for which the script can be found here. (most scripts would be far simpler than this one.) frequency response curves are frequently drawn on a logarithmic scale. The upper trace is a frequency spectrum of a square wave after enhanced re...
Page 223: Sda Operator’S Manual
Sda operator’s manual example 6 sda-om-e rev h 223.
Page 224: 224
224 sda-om-e rev h summary the examples above illustrate only the capability to use vbscript and matlab. The instrument with the lecroy xmap software option allows you to use excel, mathcad, matlab, and vbscript in this manner. Of course, you will need to load excel, mathcad, or matlab in the scope ...
Page 225: Sda Operator’S Manual
Sda operator’s manual sda-om-e rev h 225.
Page 226: 226
These examples are purely illustrative, but you can easily imagine that with a vbscript you can add value to the scope in a very short time. This gives you an instrument that does exactly what you want, time after time, by using your stored setups and scripts. What can you do with a customized instr...
Page 227: Sda Operator’S Manual
Sda operator’s manual sda-om-e rev h 227 number of samples the various math packages can process samples as follows: excel 65,535 samples mathcad 5 ms the number of samples that matlab can process is determined by memory option, as follows: memory length system dram buffer length std, s, m 256 mb 40...
Page 228: 228
The excel control dialog once you have invoked an excel call, you will see a dialog at the right of the screen, allowing you to control the zoom, excel properties, linking cells, and scale of the output trace from excel: entering a file name if you uncheck the new sheet checkbox, you can enter the f...
Page 229: Sda Operator’S Manual
Sda operator’s manual organizing excel spreadsheets the cells tab allows you to organize your excel chart. When placing the components in the sheet, be careful to avoid over-writing needed information, especially when you are using multiple input waveforms. As depicted here, the instrument panel has...
Page 230: 230
Setting the vertical scale the vertical scale of the output waveform from excel may be set in three ways: automatic for each acquisition, the instrument fits the waveform into the grid. Manual for one acquisition, click find scale; the instrument fits the current waveform into the grid. All subseque...
Page 231: Sda Operator’S Manual
Sda operator’s manual because filling cells in the spreadsheet is a relatively slow process, all unwanted sources (inputs) should be left disabled (unchecked). For example, if you want one waveform and two parameters derived from the data of three waveforms, you can have one function with both sourc...
Page 232: 232
In this figure, the panel has been pasted onto the excel sheet for comparison: 232 sda-om-e rev h.
Page 233: Sda Operator’S Manual
Sda operator’s manual to get the output values in column c, we set c2 = - a2 and copy this formula down the column. This is the only action needed in excel, and can be seen in the next figure: sda-om-e rev h 233.
Page 234: 234
Simple excel example 2 in this example we use excel to invert or negate a waveform: the first figure shows a part of the instrument screen. The upper trace (c1) is the original signal. The lower trace (f1) is the result calculated in excel and displayed on the screen. The input data is in columns a ...
Page 235: Sda Operator’S Manual
Sda operator’s manual 2. Choose a function, and select excelmath as operator1 for the function. Excel will open automatically in the background. 3. Choose file, minimize from the menu bar to minimize the instrument display and open the excel program. Sda-om-e rev h 235.
Page 236: 236
4. Create your formula for each data point in column a (in this case, our formula for cell c2 is – a2, copied for the entire column), as shown here: . 5. Retrigger the scope (if it is not currently triggering) 6. Return to the program note that the only action that was needed in excel was to create ...
Page 237: Sda Operator’S Manual
Sda operator’s manual you can also create a chart of the data in excel automatically and view the data there: simply press the add chart button in the instrument's excel dialog and a chart of the input (top chart) and excel calculated output (bottom chart) will be automatically created in the spread...
Page 238: 238
Excel example 1: exponential decay time constant excel parameter this example calculates the time constant of an exponentially falling pulse, such as the light output of a phosphor. The first figure shows a typical pulse, including pseudo-random noise, generated by a vbscript: the pulse was generate...
Page 239: Sda Operator’S Manual
Sda operator’s manual for the actual measurement, parameter p1 was set up as an excel call. In excel, the selected portion of the trace was converted to logarithms, and the excel function slope was used, as shown here: . Here we see the input data in column b (with a time scale in a) created using t...
Page 240: 240
This figure shows the instrument screen: these traces were made using vbs scripts in functions f1 and f2, based on pseudo-random numbers to provide noise and varying pulse widths. Randomize timer was used in both scripts ensuring successive acquisitions to produce different data. Script f1 generates...
Page 241: Sda Operator’S Manual
Sda operator’s manual the next figure shows a part of the excel workbook: here we see the gated waveform that has been created in excel. The mean parameter during the region of interest (roi) is placed in cell h3. How does this work? The amplitude of the signal is about 0.3 volts, and the screen hei...
Page 242: 242
Excel example 3: correlation excel waveform function this example uses an excel waveform function to examine the cross-correlation between two signals, which are both noisy sinusoidal segments. The correlation trace is, of necessity, shorter than the input traces: the noise was generated using pseud...
Page 243: Sda Operator’S Manual
Sda operator’s manual this example used the correl (array1, array2) function of excel, as depicted below: sda-om-e rev h 243.
Page 244: 244
Excel example 4: multiple traces on one grid this example shows how you can place multiple traces in one picture, with only two operations in an excel sheet. Depicted below is an example from an excel spreadsheet. Here is an original instrument trace: the method is very simple. First, the waveform i...
Page 245: Sda Operator’S Manual
Sda operator’s manual the required excel formula required is shown as follows: in fact, the simple expression b374 + 0.02 comprise several components. The original instrument trace is in column b, and the plot is required to start at cell b134. The traces repeat at intervals of 250 cells. Let us cal...
Page 246: 246
246 sda-om-e rev h.
Page 247: Sda Operator’S Manual
Sda operator’s manual excel example 5: using a surface plot sda-om-e rev h 247.
Page 248: 248
248 sda-om-e rev h writing vbscripts vbscripting is one of the custom features of your instrument. Others include the ability to work with programs such as excel, mathcad and matlab. Types of scripts in vbs the instrument's vbs provides two types of script. 1. The waveform function script allows you...
Page 249: Sda Operator’S Manual
Sda operator’s manual sda-om-e rev h 249 newarray(i) = scalefactor * (unscaleddata(i)) ^ 2 next outresult.Dataarray(false) = newarray ' signed long integer data output example parameter function script: rms of a waveform ' example script to produce a parameter. ' this script calculates the root mean...
Page 250: 250
If you try to set something outside the bounds of an array, or you make some other error, or something overflows, or you ask for something impossible, such as log(-13), the instrument tells you the line number, and the nature of the problem. Other types of error may not be given the correct line num...
Page 251: Sda Operator’S Manual
Sda operator’s manual sda-om-e rev h 251 inresult.Dataarray and outresult.Dataarray are only to be used as shown in the default scripts and in the example scripts: you cannot refer directly to individual elements of these arrays. You have to use your own arrays, in this example, unscaleddata and new...
Page 252: 252
252 sda-om-e rev h newvaluearray(i) = -scaleddata(i)_' change this to do something useful. Next outresult.Valuearray = newvaluearray 'only support raw data your parameter script should include something like this: a. Do calculation to obtain your parameter value from the input data array. B. Newvalu...
Page 253: Sda Operator’S Manual
Sda operator’s manual sda-om-e rev h 253 variable names upper and lower case have no significance in vbs, either in variable names or in keywords (the names reserved by the system), but it is a good idea to be consistent about the spelling of a variable name to avoid confusion. At least 36 character...
Page 254: 254
254 sda-om-e rev h arithmetic operators as with most other languages, the arithmetic operators are used as follows: ^ exponentiation a ^ b = a b = a raised to the power b / division a / b = a divided by b \ integer division a \ b = a divided by b, truncated to next integer below * multiplication a *...
Page 255: Sda Operator’S Manual
Sda operator’s manual sda-om-e rev h 255 order of calculations operations are performed in the following order: 1. Contents of brackets 2. Exponentiation 3. Division and multiplication 4. Addition and subtraction if there is any doubt as to how the calculation will be done, use brackets. These will ...
Page 256: 256
256 sda-om-e rev h if . . . Then . . . End if__ if . . . Then . . . Else . . . End if select case . . . . End select while . . . . Wend choose the construction that best satisfies the requirements of speed and clarity. The construction goto labelledstatement is available in many languages, including...
Page 257: Sda Operator’S Manual
Sda operator’s manual sda-om-e rev h 257 z = 17 else_ z = 31 end if else_ if a > 3 then z = 63 else z = 127 end if end if if a > 0 then if b > 0 then z = y end if end if this is equivalent to: if ( (a > 0) and (b > 0) ) then z = y end if summary of if . . . . Then . . . . Else if boolean then anyvbs...
Page 258: 258
258 sda-om-e rev h if you find that you are building up a rather complicated set of ifs, you might want to consider the select case construction. Select case this is a very powerful construction, which is also easy to understand when written out. It is best for integers and strings, where exact valu...
Page 259: Sda Operator’S Manual
Sda operator’s manual sda-om-e rev h 259 loop while d do while y >=z anyvbscalculation loop these constructions enable you to make the test before or after the calculation. If the test is made before, the calculation might not even be done one time (if the condition for terminating were already true...
Page 260: 260
260 sda-om-e rev h it is possible to make a for loop with steps greater than 1, as in the following example in which k takes the values 3, 7, 11, 15, . . . . 83. For k = 3 to 82 step 4 anyvbscripting next k you may place loops inside one another (nested loops), but they must all use different contro...
Page 261: Sda Operator’S Manual
Sda operator’s manual sda-om-e rev h 261 mod take the modulus of a value in terms of another value. On error take some action if an error occurs. Open open a file. Print send some ascii data to a file. Put send some data to a file. Randomize randomize timer re-seeds the pseudo-random number generato...
Page 262: 262
262 sda-om-e rev h functions these are mainly of the form c = f (a), where a is the argument, or input to the function. Abs abs (a) calculates the absolute value of an integer or a real number, so the result is always positive or zero. A can be any number in the range of the vb system. Atn atn (a) c...
Page 263: Sda Operator’S Manual
Sda operator’s manual sda-om-e rev h 263 hints and tips for vbscripting set the trigger to single or stopped if you need to do a lot of editing: it is faster. Before starting a script, remove any existing scripts that you do not need. This is because errors in an existing script will give you error ...
Page 264: 264
264 sda-om-e rev h you can highlight a section of a trace by making the points alternately too high and too low by a suitable amount. Providing the memory length is not too short, the compaction algorithm will give the effect of a thicker trace. The lengths of the output trace and the input trace ne...
Page 265: Sda Operator’S Manual
Sda operator’s manual in the following example, the red trace has gone outside the allowed range at the beginning, resulting in the message at the bottom of the instrument screen: this array is fixed or temporarily locked: outresult.Dataarray. Sda-om-e rev h 265.
Page 266: 266
266 sda-om-e rev h error handling note that the construction onerror goto label: is not allowed in vbs. In fact no gotos or labels are allowed. Therefore there is no way for you to provide handlers to deal with errors and exceptions. You must be aware of all possibilities at all points in your progr...
Page 267: Sda Operator’S Manual
Sda operator’s manual sda-om-e rev h 267 y = cos (xk) * sin (xk) * sqr (xk) oldxk = xk end if next vbs runs slower than the "internal" calculations, because the scripts are interpreted. This could be serious for calculations where many operations are needed on each sample, such as convolution, corre...
Page 268: 268
268 sda-om-e rev h horizontal control variables inresult.Horizontaloffset double precision time shift of input waveform on grid in units of horizontal scale outresult.Horizontaloffset double precision time shift of output waveform on grid in units of horizontal scale inresult.Horizontalperstep doubl...
Page 269: Sda Operator’S Manual
Sda operator’s manual sda-om-e rev h 269 [out, retval] variant *parray); dataarray([in, defaultvalue(true)] bool arrayvaluesscaled, [in, defaultvalue(lec_all_data)] int numsamples, [in, defaultvalue(0)] int startindex, [in, defaultvalue(1)] int sparsingfactor, [in] variant array); horizontalunits([o...
Page 270: 270
270 sda-om-e rev h excelapp.Activesheet.Cells("excelrow + k, excelcolumna ") = - usd(k) next once the data are in excel, any excel functions can be applied to the data. The results can be returned to the vb script. For k = 0 to lastpoint nda(k) = excelapp.Activesheet.Cells("excelrow + k, excelcolumn...
Page 271: Sda Operator’S Manual
Sda operator’s manual how to select a waveform function call the matlab waveform functions are selected from the select math operator menu. Please note that once you have clicked on "matlab wave" there will be a slight pause before matlab starts. Source 1 and source 2 are the waveforms that matlab w...
Page 272: 272
The matlab waveform control panel once you have invoked a matlab waveform call, you will see the zoom dialog at the right of the screen. Touch the matlab tab to see a panel like this: touch find scale to make your output fit the grid, or use the text boxes to choose a scale. Matlab waveform function...
Page 273: Sda Operator’S Manual
Sda operator’s manual this is the default waveform function, with one important change – the semi-colon (;) has been removed from the end of the line. If the semicolon is present, your function will run much faster, because the output values will not be shown in matlab response. With a long waveform...
Page 274: 274
Matlab example waveform plot if you touch the matlab plot checkbox you will see a matlab plot like this one: how to select a matlab parameter call menu position for matlab parameter call in select measurement menu. 274 sda-om-e rev h.
Page 275: Sda Operator’S Manual
Sda operator’s manual the matlab parameter control panel once you have invoked a matlab parameter call, a mini-dialog to the right of the main dialog will appear: you can touch the matlab plot checkbox if you want to see a plot in matlab as well as getting a result in the instrument. The matlab para...
Page 276: 276
If you are familiar with matlab you might prefer to launch matlab and create a matlab function that performs your task. Your program in the instrument could then be a one-line call of your matlab function. Matlab example parameter panel 276 sda-om-e rev h.
Page 277: Sda Operator’S Manual
Sda operator’s manual the next example calculates the ratio of the number of data points that are above a given level to the number of points below the level, in this case one half of the amplitude. More examples of matlab waveform functions negating the input signal. Sda-om-e rev h 277.
Page 278: 278
Squaring the input signal. Creating pulses from a sinusoid. Creating pulses at the zero crossings of the signal. 278 sda-om-e rev h.
Page 279: Sda Operator’S Manual
Sda operator’s manual convolving two signals. Sda-om-e rev h 279.
Page 280: 280
Creating your own matlab function the procedure is simple. Create a matlab function using any text editor, and save it as a matlab m-file by giving it a name of the form filename.M. Call the function using the matlab math editor or the matlab parameter editor as appropriate. A simple example is show...
Page 281: Sda Operator’S Manual
Sda operator’s manual customdso what is customdso? Customdso, in its basic mode, allows you to create dso setups that can be called by the touch of a single button. The recalled setups can themselves include calls to other setups. A very simple example would be a toggle between two setups. Rings of ...
Page 282: 282
Customdso basic mode the basic customdso mode offers eight action buttons, each of which can call a different setup when touched. The "action definition" dialog is used to enter a customdso setup file name by means of the pop-up keyboard. By clicking the checkbox, the eight customdso buttons will co...
Page 283: Sda Operator’S Manual
Sda operator’s manual 1163 customdso.Actionenable1 = true 1164 customdso.Actionscript1 = “c:\lecroy\xstream\customdso\b.Lss” 1165 customdso.Actionenable1 = false 1166 customdso.Actionscript1 = “c:\lecroy\xstream\customdso\c.Lss” 1167 customdso.Actionenable1 = true 1168 customdso.Actionscript1 = “c:\...
Page 284: 284
' created by customdso ... On error resume next set dso = createobject("lecroy.Xstreamdso.1") ' dso.Display.Gridmode = "dual" ' dso.Acquisition.C1.Verscale = 0.1 ' dso.Acquisition.Horizontal.Horscale = 1e-6 ' dso.Acquisition.Triggermode = "auto" you can add to this fragment any commands you need. Cu...
Page 285: Sda Operator’S Manual
Sda operator’s manual double click on the auto button. In the resulting code window, insert code to make the following subroutine: private sub autobutton_click() dim app as object set app = createobject(“lecroy.Xstreamapplication”) app.Acquistion.Triggermode = “auto” end sub 5. Test the component in...
Page 286: 286
In the next example you can see a command button, a picture box, a list box and a tabbed dialog control. The tabbed control (arrow) is not in the basic tool box. To gain access to it, right click in the tool box at left (but not on an icon.) you will see this menu: 286 sda-om-e rev h.
Page 287: Sda Operator’S Manual
Sda operator’s manual now select the microsoft tabbed control as shown below, and click on apply. The control will be added into the toolbox at the left of the screen, where you can double click on it as usual. The new control is shown below (arrow). Sda-om-e rev h 287.
Page 288: 288
The system is very versatile, and you can place controls on the tabs of the tabbed control. Look in the properties window to see how you can customize your tabs, illustrated as follows. Removing a plugin to remove a plug-in, click on remove in the plugin dialog as follows: close the customdso dialog...
Page 289: Sda Operator’S Manual
Sda operator’s manual sda-om-e rev h 289 plugin example 1: exchanging two traces on the grids the example assumes that the instrument is in dual-grid mode, and that there are at least two visible traces. The routine looks for the visible traces, in the order c1 . . . C4, f1 . . . . Fx the number of ...
Page 290: 290
Text1.Text = textstring end sub this routine exchanges the first two traces that it finds. You can make it exchange all the traces on a dual grid by changing the penultimate line to this - loop until trace = 12 the next figure shows the visual basic screen just after the text box text has been set t...
Page 291: Sda Operator’S Manual
Sda operator’s manual second example plugin: log-log fft plot a frequent requirement is to plot a frequency spectrum on two logarithmic scales. The instrument provides a vertical scale, so customdso has only to change the horizontal one. Here is an example. The first figure has been truncated on the...
Page 292: 292
292 sda-om-e rev h private sub command1_click() ' draw a dso trace on a logarithmic horizontal scale. Dim wm as object set wm = createobject("lecroy.Xstreamapplication") dim samples as long samples = wm.Math.F1.Out.Result.Samples samples = samples - 1 ' make it a round number. ' calculate the horizo...
Page 293: Sda Operator’S Manual
Sda operator’s manual here is an example showing a simple one-pole roll-off compared to a curve. Control variables in customdso the simplest way to select variables for use in customdso is to use lecroy’s x-stream browser. Labnotebook introduction to labnotebook lecroy's labnotebook feature extends ...
Page 294: 294
Check the last box if you want to generate a notebook entry by simply touching the hardcopy (print) front panel button . By checking this box, you override any other configuration for this button; for example, send e-mail or output to printer. Hardcopy setup check the use print colors checkbox to pl...
Page 295: Sda Operator’S Manual
Sda operator’s manual a dialog box is shown for providing a title and comments for the entry. By default, the entry is titled with the current date and time. 2. Touch inside the title field and enter a title, using the pop-up keyboard. Then touch inside the description field and enter a description,...
Page 296: 296
After you touch close, your text will appear on the display as a draggable object. These are the three default colors that you can select for shapes, lines, and text. To use additional colors, touch more. When you touch more, a custom box opens with the default color yellow displayed. Touch the yell...
Page 297: Sda Operator’S Manual
Sda operator’s manual . Then touch the color to enable it, and touch ok. The next object that you create will be in that color. If you want to erase a drawing object, touch it to select it, then touch erase selected. Touch erase all to erase all drawn objects and text. Touch undo to discard the last...
Page 298: 298
Recalling notebook entries after a notebook entry is made, you can recall it at any time. The recall includes waveforms and scope settings. 1. Select the notebook entry from the list box. 2. Touch flashback. 3. To exit flashback, touch the undo flashback button in the top-right corner of the screen,...
Page 299: Sda Operator’S Manual
Sda operator’s manual creating a report once the notebook entry is created, you can easily generate a hardcopy report for e-mailing or printing. Previewing a report before creating a report, you can preview it by simply touching the view button . To exit the preview, touch the close button at the ri...
Page 300: 300
2. Touch inside the format field and select a report format from the pop-up menu . 3. Touch the create report button. 4. A dialog box opens in which to name the report and select a folder to contain the report. Touch inside the file name field and enter a name using the pop-up keyboard. 5. If you wa...
Page 301: Sda Operator’S Manual
Sda operator’s manual managing notebook entry data adding annotations you can add annotations to your notebook entry at any time. 1. Touch the "labnotebook" tab. 2. Touch the notebook entry you want to annotate in the scroll list box. A new tab will appear bearing the name of the selected notebook e...
Page 302: Processing Web Option
Touch compact to reduce the size of a database. This function "defragments" the notebook after a large amount of entries have been deleted. Insert a memory stick into a usb port, then touch backup to send the database to the external media: . Starting a new database touch the start new button. The n...
Page 303: Sda Operator’S Manual
Sda operator’s manual another key feature of the processing web is that you can preview your waveform at any math or parameter node in the web. Math previews are thumbnail images of the waveform. For parameters, the statistic displayed is the value of the last acquisition. Once you have created a pr...
Page 304: 304
The parameter location you choose will display "web edit" under the waveform display grid: . 3. Touch the web editor tab to return to the web setup dialog. The math and parameter locations you selected appear as outputs at the far right: . You may have to scroll up or down to see it. 4. Touch the ad...
Page 305: Sda Operator’S Manual
Sda operator’s manual (m1 to m4) as an input, drag a line to the math function in the same way as for channel inputs. Note: you can use a combination of channel input and memory input to your math function. 6. Touch the output arrow of the math function icon and drag a line to the fx output on the r...
Page 306: Serial Data Analyzer
Viewing the output 1. Touch math in the menu bar, then math setup... In the drop-down menu. 2. Touch the on checkbox for the function you want to view: serial data analyzer serial data analyzer standard and optional capabilities the serial data analyzer is an instrument designed to provide comprehen...
Page 307: Sda Operator’S Manual
Sda operator’s manual sda-om-e rev h 307 sdm capabilities the capabilities of option sdm are standard in the sda, so it is not available for purchase for the sda. This option is only available for the wavemaster, waverunner 6000a series, and wavepro 7000a series of oscilloscopes. Sdm adds eye patter...
Page 308: 308
308 sda-om-e rev h available measurements single-signal measurements sda (std.) sda w/ asda- j sdm option data stream mask testing w/ software pll clock recovery x x x mask violation locator x jitter rj, dj, tj, isi, dcd (ddj), pj x x filtered jitter x isi plot x edge-to-edge jitter x effective and ...
Page 309: Sda Operator’S Manual
Sda operator’s manual sda-om-e rev h 309 standard mode gigabit ethernet 1000base-cx tx normalized/absolute, rx gigabit ethernet (optical long-haul) 1000base- lx tx gigabit ethernet (optical short-haul) 1000base- sx tx 10gbase-lx4 tx normalized dvi transmitter, receiver low, receiver high, cable test...
Page 310: 310
The jitter wizard is accessed from the analysis drop-down menu: 310 sda-om-e rev h.
Page 311: Sda Operator’S Manual
Sda operator’s manual the initial dialog for the wizard gives you an overview of wizard operation. This dialog can be disabled after the first use of the wizard by checking the “don’t show me this message again” checkbox. In this case, the dialog will not be displayed until the instrument is restart...
Page 312: 312
Sda basic setup note: many of the measurements in the sda require both a high sampling rate and long memory to compute accurately. Verify that you are in two channel mode (20 gs/s) and that at least 400k samples are being captured before performing any sda measurements. Lower sampling rates can resu...
Page 313: Sda Operator’S Manual
Sda operator’s manual 3. There are two crossing-level controls in the sda main dialog: one for the data signal under test and another for the reference clock (if the recover clock checkbox is unchecked). The crossing time used by both the jitter and eye pattern measurements is determined as the abso...
Page 314: 314
314 sda-om-e rev h 6. The pattern length (number of bits in the pattern) control sets the repetition length of the data pattern in the signal under test. Serial data signals generally transmit a repeating data pattern of some sort. For example a prbs7 pattern repeats every 127 bits while a k28.5 rep...
Page 315: Sda Operator’S Manual
Sda operator’s manual pll setup the "pll settings" dialog contains the controls to set the type and bandwidth of the digital pll used in the jitter, eye pattern, and bit error rate tests. The pll bandwidth limits the response of the recovered clock to high rate variations in the data rate. For examp...
Page 316: 316
The second order pll allows the selection of the natural frequency and damping factor. The damping factor determines the transient behavior of the phase locked loop and is variable from 2 to 0.5. A damping factor above 0.707 results in an under-damped response in which the pll over-corrects to a sud...
Page 317: Sda Operator’S Manual
Sda operator’s manual sda-om-e rev h 317 the default value of 1667 is the industry standard for a "golden pll" and equals the ratio of the bit rate to the pll cutoff frequency. The pll cutoff frequency control reads the frequency corresponding to the cutoff divisor. Alternatively, the pll cutoff fre...
Page 318: 318
Eye setup the pll must be set up or an appropriate external clock must be supplied in order for the mask test function to operate. 1. Touch the mask test button. The "eye diagram" dialog opens. 2. Touch inside the mode field and select either sequential 6 or traditional 7 from the pop-up menu: 3. To...
Page 319: Sda Operator’S Manual
Sda operator’s manual sda-om-e rev h 319 the measurements made for each parameter set are as follows: amplitude ehght(eye) size of the vertical opening of the eye diagram. This parameter is defined as: (mean ones level - 3) - (mean zero level + 3) one(eye) logic one level of an eye diagram. This is ...
Page 320: 320
320 sda-om-e rev h testing 1. Touch the mask violation locator tab to display the mask testing dialog 2. Touch the on checkbox to begin testing the signal bits against the selected mask. 3. Asda-j option only: failed bits are displayed in a table and as a waveform in the lower grid. The scale of the...
Page 321: Sda Operator’S Manual
Sda operator’s manual 5. Touch the show error map checkbox to enable a display of the error map. The error map displays bit errors in a three-dimensional display, with errors shown in white and correct bits in dark gray. The display is a 2-color surface map with frame number in the y direction and b...
Page 322: 322
Serial trigger setup the serial trigger dialog is accessible from two different menus. • by touching the trigger descriptor label , then the serial trigger button , you can access the trigger phase locked loop and set the data pattern on which to trigger: • it is also accessible from the channel 4 "...
Page 323: Sda Operator’S Manual
Sda operator’s manual pll locking the pll in the serial trigger module must be locked for the trigger to operate. Locking is indicated by the closed padlock icon . The icon becomes an open padlock and flashes when the pll is not locked. Lock the pll by pressing the lock cdr pll button . Once locked,...
Page 324: 324
A group of buttons is provided to quickly set the pattern to all 1s, all 0s, or all xs. And a fourth button is provided to invert the entire data pattern: example bit pattern and resulting waveform 324 sda-om-e rev h.
Page 325: Sda Operator’S Manual
Sda operator’s manual storing and recalling serial data patterns into the trigger it is often convenient to save frequently used trigger patterns in a file so that you do not have to repeatedly reenter them. The serial trigger pattern is also stored in the setup file whenever you save the panel file...
Page 326: 326
The sda measures jitter by determining the timing error between the edge crossings of the data signal under test and a reference clock, which can be derived either from the data or an external clock. The measurement can also be performed directly relative to the edges of the external clock. A flow d...
Page 327: Sda Operator’S Manual
Sda operator’s manual sda-om-e rev h 327.
Page 328: 328
328 sda-om-e rev h.
Page 329: Sda Operator’S Manual
Sda operator’s manual sda dbi controls the sda 18000/13000/11000/9000 oscilloscopes achieve higher bandwidth and sample rate using an innovative lecroy technology called digital bandwidth interleaving (dbi). This technology allows resources to be borrowed from unused channels to multiply not only sa...
Page 330: 330
Vertical noise calibration your sda contains a script (.Irt) to calibrate vertical noise. The script runs in lecroy's x-replay environment, which is launched automatically when you open the script. By means of the script, the sda accounts for vertical noise when calculating jitter. This feature appl...
Page 331: Sda Operator’S Manual
Sda operator’s manual 3. In the x-replay toolbar, touch the start a new session button 4. Enter any pertinent information in the "session info" dialog box if desired, and touch ok. 5. A "required connections" dialog box opens, which prompts you to detach any probes connected to the scope. Touch ok w...
Page 332: 332
4. Touch the compensate checkbox to enable noise compensation, then the find noise level button. The value displayed under "instrument noise" is for the active channel at the current volts/div setting. If you change channels or volts/div, press the find noise level button again: jitter measurements ...
Page 333: Sda Operator’S Manual
Sda operator’s manual sda-om-e rev h 333 dcd duty cycle distortion is the mean difference between the width of positive going pulses (low to high to low) and negative going pulses (high to low to high) measured over all pulses in the acquired waveform. The widths are measured at the same amplitude a...
Page 334: 334
Efferj effective random jitter is one of the two constants used to estimate the function tj(ber) for very low ber. Rje is obtained through the analysis of the growth of the extrapolated histogram of tie as a function of ber, fitting the form: tj(ber) = dje + tj (sigma=1) (ber)*rje effedj effective d...
Page 335: Sda Operator’S Manual
Sda operator’s manual mjsq jitter the other method of determining the random and deterministic components is based on the procedure described in the fibrechannel mjsq (methods for jitter and signal quality) document. This method is similar to the effective jitter described above except that it opera...
Page 336: 336
Bathtub curve the bathtub curve is the integral of the jitter probability density function (pdf – derived by normalizing the extrapolated tie histogram - see the theory section) for all possible sampling points within one unit interval (ui). The right side of the bathtub curve is the integral of the...
Page 337: Sda Operator’S Manual
Sda operator’s manual jitter filter the jitter filter is a band-pass filter that is applied to the tie-vs.-time data measured on the signal under test. The filtered waveform of the trend of tie over time is displayed in the waveform grid when filtered jitter is selected. The filter is implemented as...
Page 338: 338
The tie histogram shows the measured jitter distribution that is the source for the bathtub curve and total jitter parameter. 1. Touch the jitter histogram button. The histogram will be displayed in the center of the bathtub curve. 2. Touch the bathtub button to toggle the histogram display off. Ddj...
Page 339: Sda Operator’S Manual
Sda operator’s manual 3. Note the change in the ddj measured value. 4. Touch the isi edge-edge tab. A. Touch the detect pattern button to find the pattern and length. Normally this is done automatically when the signal is set up in the sda main menu. The patt. Length control in the sda main dialog i...
Page 340: 340
1. Select “isi plot” in the ddj calc. Method control for a random pattern (available only for edge-ref jitter method). This control is only available with the asda-j option. 2. Touch the isi button; the isi plot will be displayed. 3. Note the change in the ddj measured value. 4. Touch the isi tab in...
Page 341: Sda Operator’S Manual
Sda operator’s manual edge-to-edge basic setup the asda-j option adds a second measurement mode defined as edge-to-edge. In this mode, all jitter measurements are made between adjacent edges of the data pattern and no reference clock is used. Only jitter measurements are available in this mode, so t...
Page 342: 342
6. The pattern length control sets the repetition length of the data pattern in the signal under test. Serial data signals generally transmit a repeating data pattern of some sort. For example a prbs7 pattern repeats every 127 bits while a k28.5 repeats every 20 bits. Enter the pattern length in the...
Page 343: Sda Operator’S Manual
Sda operator’s manual the sda measures jitter by determining the timing between the edge crossings of the data signal under test and comparing these measurements with the nominal unit interval (ui). A flow diagram of the edge to edge jitter measurement is shown below. The total jitter is derived fro...
Page 344: 344
Tj total jitter at a specific ber. The value is determined by the width of the curve expressing the confidence limits of the extrapolated tie histogram. The value represents the expected range of values observed for a number of observed measurements equal to 1/ber. The tj parameter is accumulated ov...
Page 345: Sda Operator’S Manual
Sda operator’s manual sda-om-e rev h 345 edge-edge jitter measurement controls adjust rj the tie measurements in the edge-to-edge mode are measured by determining the timing between transitions of the data signal and comparing this to the nominal ui. The measurement is essentially the difference bet...
Page 346: Sda Function Reference
Sda function reference there are several specialized math functions that appear in the sda math menu. These functions make up the building blocks of the sda jitter and eye pattern measurements and are available from the select math operator menu. The following table presents an overview. Altncycle a...
Page 347: Sda Operator’S Manual
Sda operator’s manual altncycle timing of the transitions in the data waveform is measured for each transition and plotted as a function of the number of unit intervals over which the timing is measured. The “n-cycle” dialog is used to control how this measurement is performed, and the diagram and t...
Page 348: 348
348 sda-om-e rev h altncycle control summary control values description synch to pattern on/off synchronizes the measurement to a repeating data pattern (if present) in the signal when this control is checked. The timing is measured between the first transition in the pattern and each subsequent tra...
Page 349: Sda Operator’S Manual
Sda operator’s manual sda-om-e rev h 349 control values description find pattern pressing this button searches the signal for a repeating pattern and loads it into the function when it is found. The length (ui) and tx dens. Controls are then updated. Invert pattern on/off checking this box inverts t...
Page 350: 350
Htie to ber this function takes as an input a histogram and converts it to one of 6 output waveforms. Normally, the histogram contains a set of time interval error (tie) measurements from which a total jitter measurement is desired. The histogram should have a population of at least 100k and a minim...
Page 351: Sda Operator’S Manual
Sda operator’s manual sda-om-e rev h 351 control values description total jitter the total jitter curve which, shows the cumulative probability of an edge being greater (right-hand side) or less (left-hand side) than its nominal location in the center. The total jitter at a particular bit error rate...
Page 352: 352
Jitter filter function the jitter filter function generates a time sequence of jitter measurements that are filtered by the selected band-pass filter. Low-pass and high-pass frequencies are set in the function’s menu. You must enter the bit frequency (data rate) to set the sampling rate for the digi...
Page 353: Sda Operator’S Manual
Sda operator’s manual slice2persist note: this function can only be used in the web edit mode, available with the xweb option. The include virtual edges checkbox must be checked in the tie@lvl parameter dialog to include both transition and non-transition edges in the eye pattern. Sda-om-e rev h 353.
Page 354: 354
The slice2persist function takes as its input a data waveform and a clock signal. The clock must consist of a sequence of time values that increase at the nominal unit interval for each successive sample. For example, a 2.5 gb/s bit stream should have a clock input consisting of the numbers 0, 4e-10...
Page 355: Sda Operator’S Manual
Sda operator’s manual sda-om-e rev h 355 frequency 100 khz to 4.5 ghz the bit rate of the signal under test. This number can also be set to a sub-multiple of the bit rate to show more than one eye. For example, 2.5 ghz will show one eye of a 2.5 gb/s signal while setting the control to 1.25 ghz will...
Page 356: 356
Transition mode display setup and installation multi-eye setup and installation the multi eye measurement tool does not require any additional software installation, as it is fully integrated into the sda software. However, depending on the specific mode of operation selected, each of the three new ...
Page 357: Sda Operator’S Manual
Sda operator’s manual example setups fsb eye mode configuration channel setup • datastrobep: channel 1 (m1) • datastroben: channel 2 (m2) • data1: channel 3 (m3) • data2: channel 4 (m4) serial data analysis setup 1. Select signal type: fsb 533mhz, 667mhz or 800mhz 2. Uncheck recover clock - no clock...
Page 358: 358
358 sda-om-e rev h eye diagram setup and measurements 1. Select mask for each eye diagram - depending on the standard selected, there may be one or several types of serial data masks available. 2. Select a mask margin (as % of the nominal mask size) if desired. 3. Select a measurement type. There ar...
Page 359: Sda Operator’S Manual
Sda operator’s manual mask test (mask violation locator) setup 1. Select the "mask violation locator" tab. 2. Check the testing on checkbox to detect mask violations. 3. Check the show location checkbox to select display of bits where mask violations occur. 4. Check the stop on error checkbox after ...
Page 360: 360
Fsb theory of operation there are three sub-buses in the fsb: data bus, address bus, and common clock bus. All these buses are bidirectional; information can flow in either direction. The direction of the bit flow will be determined by the relative position of the high-to-low transition in the strob...
Page 361: Sda Operator’S Manual
Sda operator’s manual address bus characteristics (refer to figure): • during every period of bclk, 2 bits are sent or there's an idle state (high voltage on both strobes and relevant data). • bit transfers occur in double multiples of bits only (2, 4, 6…). • there's sampling of address bits on both...
Page 362: 362
Common clock bus characteristics (refer to figure) • during every period of bclk, 1 bit is sent or there's an idle state meaning high voltage on the signal. • bclk is a differential signal. Common clock bus timing diagram © intel corporation 362 sda-om-e rev h.
Page 363: Sda Operator’S Manual
Sda operator’s manual transition/non-transition eye diagram a dual display eye diagram is formed with bits that are of non-changing polarity (non-transition) and changing polarity (transition). This display mode is useful for those serial data standards that utilize mask testing for both types of bi...
Page 364: 364
Gated (qualified) eye diagram the gated eye diagram mode utilizes a separate signal (the “gate” or qualifier) to create dual eye diagrams based on the polarity of the gate. Here’s an example of a gated eye diagram. Channel 1 (m1) contains the raw data and channel 2 (m2) contains a gate signal. While...
Page 365: Sda Operator’S Manual
Sda operator’s manual the following is the eye diagram resulting from applying the gate signal. When the gate is high, the bit data goes to one eye diagram. When the gate is low, data goes to the other eye. Gated eye diagram example sda theory the sda operates by processing a long signal acquisition...
Page 366: 366
The first step in creating a clock signal is the creation of a digital phase detector. This is simply a software component that measures the location in time at which the signal crosses a given threshold value. Given the maximum sampling rate available, 20 ghz, interpolation is necessary in most cas...
Page 367: Sda Operator’S Manual
Sda operator’s manual as shown in figure 2, the initial output and the output of the digital phase detector are set to zero. The next time value output is equal to the nominal data rate. This value is fed back to the comparator on the far left which compares this time value to the measured time of t...
Page 368: 368
Eye pattern figure 3. Histogram of zero crossing in eye pattern showing jitter distribution an eye diagram shows all values a digital signal takes on during a bit period. A bit period (or ui) is defined by the data clock, so some sort of data clock is needed to measure the eye pattern. The tradition...
Page 369: Sda Operator’S Manual
Sda operator’s manual the sda measures eye patterns without using a trigger by using aforementioned the software clock recovery to divide the data record into segments along the time values of the clock. For the purpose of dividing the timeline into segments, the time resolution in the waveform reco...
Page 370: 370
Eye pattern measurements there are several important measurements that are made on eye patterns. These are specified as required tests for many standards. Eye measurements mainly deal with amplitude and timing, which are outlined as follows: eye amplitude eye amplitude is a measure of the amplitude ...
Page 371: Sda Operator’S Manual
Sda operator’s manual sda-om-e rev h 371 eye height the eye height is a measure of the signal-to-noise ratio of a signal. The mean of the “0” level is subtracted from the mean of the “1” level as in the eye amplitude measurement. This number is modified by subtracting the standard deviation of both ...
Page 372: 372
Q factor or ber the q factor is a measure of the overall signal-to-noise ratio of the data signal. It is computed by taking the eye amplitude (the difference between the mean values of the "1" and "0" levels) and dividing it by the sum of the noise values (standard deviations of the "1" and "0" leve...
Page 373: Sda Operator’S Manual
Sda operator’s manual jitter measurement jitter is measured by the relative variation in the location in time of the transitions of the signal level across a specific level. For clock signals, the relative time between threshold crossings (rising-to-rising or falling-to-falling) is measured. Data si...
Page 374: 374
Equation 1 is a heuristic that describes total jitter as a function of bit error rate (ber) and is related to a distribution consisting of a gaussian convolved with a pair of impulses as shown in figure 7. The constants rj and dj represent all of the components of random and deterministic jitter. Th...
Page 375: Sda Operator’S Manual
Sda operator’s manual bit error rate and jitter equation 1 shows that the total jitter is a function of bit error rate. This relationship is based on the effect that jitter has on the bit error rate of a system. The bit error rate is influenced by other parameters of the system, such as noise, so it...
Page 376: 376
Figure 9, gives the total probability of an edge being greater than t (or less than -t). The contribution to the system ber by jitter is given by the probability that an edge occurs at a time greater than t as we mentioned earlier. In order to guarantee a ber contribution from jitter below a certain...
Page 377: Sda Operator’S Manual
Sda operator’s manual figure 10. The bathtub curve is constructed by rescaling the total jitter curve in figure 9 to one unit interval, and centering the right side of the total jitter curve at 0 ui and the left side at 1 ui (the left and right sides of the bathtub curve). A common way to view the t...
Page 378: 378
Figure 11: the measured histogram of tie values is extrapolated by fitting curves to the bins below the 10th and above the 90th percentile. The log of the histogram is used to simplify this process to a quadratic fit. Figure 12: logarithm of the measured tie histogram superimposed on the extrapolate...
Page 379: Sda Operator’S Manual
Sda operator’s manual sda-om-e rev h 379 a smaller data set is extrapolated in order to estimate the data for the larger sample size. The extrapolation of the measured histogram of tie values uses the random nature of jitter at the extremes of the histogram to extrapolate the bins below the 10th per...
Page 380: 380
Figure 13. The change in total jitter with ber is represented by the values tjn in the total jitter curve on the left. These values are plotted vs. Bit error rate in the upper line in the chart on the right while the lower line shows the variation vs. Ber for a pure gaussian. Rje and dje are chosen ...
Page 381: Sda Operator’S Manual
Sda operator’s manual when ddj calc. Method is set to isi plot, the sda uses a patent-pending method to measure both forms of data dependent jitter. The method uses the history of a number of bits in the waveform to determine their effect on the transition of a given bit. A user-selectable number of...
Page 382: 382
Comparing models the plot in figure 15 shows the bathtub curves for the measured values, as well as both estimates. Viewed in this way, it is clear why both the effective and direct measurements for rj and dj are used. Both estimates arrive at the same total jitter at the specified ber (10-12 in thi...
Page 383: Sda Operator’S Manual
Sda operator’s manual sda-om-e rev h 383 bit error rate the sda measures bit error rate directly on the captured bit stream by using the recovered clock to sample the waveform, and a user selectable threshold. The data are assumed to be nrz so a high level is interpreted as a “1” and a low level is ...
Page 384: 384
Figure 16. Bit error map for 127-bit pattern containing random errors (white squares) figure 17. Bit error map for 127-bit pattern containing pattern dependent errors 384 sda-om-e rev h.
Page 385: Sda Operator’S Manual
Sda operator’s manual vertical noise compensation introduction jitter is a measure of the timing error of data or clock signal transitions. The error is determined by measuring the time at which the signal crosses a given amplitude level and comparing it to the “expected” transition time. In a perfe...
Page 386: 386
The relative impact of noise on jitter (quadratic addition of noise) the “quadrature addition” used to “add” the noise components is really only precise for gaussian distributions of variations (even though this works well for many combinations of incoherent phenomena). What’s important in this appl...
Page 387: Sda Operator’S Manual
Sda operator’s manual interpretation of tie histogram – the distribution of edge transition times vs. Ideal (expected) transition times for the purposes of this discussion (in connection with jitter measurement 10 ) the entire subject surrounds the matter of interpreting the observed distribution of...
Page 388: 388
For this case (jitter) the observed distribution is the histogram of time interval error (tie) values, obtained through analysis of either clock or nrz data waveforms acquired by a digital recording instrument (like a digital oscilloscope). Integrating the pdfs the cumulative distribution function (...
Page 389: Sda Operator’S Manual
Sda operator’s manual to the point of all of this, in telecommunications or data communications, the relative rate of bit errors is called ber 11 . Extrapolation of the distribution tails (extremes) historical note: before this approach was taken by lecroy, the extrapolation was applied to the histo...
Page 390: 390
The following figure ca shapes of these functions in perspective. In particular, rememb se the complementary error function (erfc) with the inverse error function (erf -1 ). N help to put the general er not to confu the relationship between the inverse error function and total jitter it is noteworth...
Page 391: Sda Operator’S Manual
Sda operator’s manual usually when this equation is presented, a qualifying remark might be "and the function α(be the number of standard deviations for a gaussian with sigma of 1, that corresponds to the specified bit erro r) is r ratio (ber)." now, it turns out that α(ber) is to within a constant ...
Page 392: 392
The reason this is such an interesting (and thus preferred) representation for the cdf and edf is that on this scale the cdf of a gaussian pdf is a straight line. When the cdf or edf is o modified symmetric form, then their graphs appear as the upper lines of a triangle. Below is a plot of an edf (s...
Page 393: Sda Operator’S Manual
Sda operator’s manual automatic renormalization of the q-scale this is the heart of the (patent pending) method for analysis of edf, yielding best estimates of the underlying pdfs defining the measured system’s behavior. The procedure is straightforward: create the symmetric edf for each side of the...
Page 394: 394
394 sda-om-e rev h.
Page 395: Sda Operator’S Manual
Sda operator’s manual sda-om-e rev h 395.
Page 396: 396
Obtaining deterministic and random (gaussian) components from the normalized q-scale diagram while there are detailed differences between this and other approaches for obtaining rj and dj, the most important figure we need to establish is total jitter. Referring roughly back to the heuristic jitter ...
Page 397
Sda operator’s manual if the distribution is governed by only two gaussians of equal weight, this equation degenerates into and if, in addition, the two gaussians have the same sigma (or rj), then this equation is disturbingly different from this is because in the traditional dual-dirac discussion, ...

