- DL manuals
- 8e6 Technologies
- Network Hardware
- TAR "MSA"
- Evaluation Manual
8e6 Technologies TAR "MSA" Evaluation Manual
Summary of TAR "MSA"
Page 1
? threat analysis reporter evaluation guide models: tar hl/sl/msa software version: 1.3.00 document version: 01.05.09.
Page 2
Ii 8 e 6 t echnologies , t hreat a nalysis r eporter e valuation g uide t hreat a nalysis r eporter e valuation g uide © 2009 8e6 technologies all rights reserved. Printed in the united states of america local: 714.282.6111 • domestic u.S.: 1.888.786.7999 • international: +1.714.282.6111 this docume...
Page 3: Ontents
8 e 6 t echnologies , t hreat a nalysis r eporter e valuation g uide iii c ontents t hreat a nalysis r eporter e valuation g uide ..........................................1 overview. .......................................................................................................................
Page 4
C ontents iv 8 e 6 t echnologies , t hreat a nalysis r eporter e valuation g uide c hapter 5: v iew a url t rend r eport ....................................................14 step 1: access trend charts. ...................................................................................... 14 step ...
Page 5: Hreat
T hreat a nalysis r eporter e valuation g uide o verview 8 e 6 t echnologies , t hreat a nalysis r eporter e valuation g uide 1 t hreat a nalysis r eporter e valuation g uide overview the threat analysis reporter helps administrators manage internal web-based threats by monitoring internet usage inf...
Page 6: Hapter
C hapter 1: a ccess the tar w eb c lient s tep 1: l aunch ie 2 8 e 6 t echnologies , t hreat a nalysis r eporter e valuation g uide c hapter 1: a ccess the tar w eb c lient step 1: launch ie from your workstation, launch internet explorer to open an ie browser window. Note: if pop-up blocking softwa...
Page 7
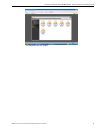
C hapter 1: a ccess the tar w eb c lient s tep 3: l og into the a pplication 8 e 6 t echnologies , t hreat a nalysis r eporter e valuation g uide 3 url dashboard with url gauges.
Page 8: Hapter
C hapter 2: d rill d own into a url g auge s tep 1: h ow to r ead a g auge 4 8 e 6 t echnologies , t hreat a nalysis r eporter e valuation g uide c hapter 2: d rill d own into a url g auge this section will step you through the manual monitoring of users in real-time via the url gauge dashboard. Not...
Page 9: Time Span
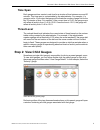
C hapter 2: d rill d own into a url g auge s tep 2: v iew c hild g auges 8 e 6 t echnologies , t hreat a nalysis r eporter e valuation g uide 5 time span each gauge monitors events in real-time for a window of time between one and 60 minutes. This time span is customizable by the administrator. For ...
Page 10
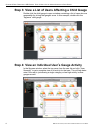
C hapter 2: d rill d own into a url g auge s tep 3: v iew a l ist of u sers a ffecting a c hild g auge 6 8 e 6 t echnologies , t hreat a nalysis r eporter e valuation g uide step 3: view a list of users affecting a child gauge double-click the child gauge to open a window containing a list of users ...
Page 11
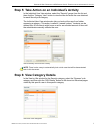
C hapter 2: d rill d own into a url g auge s tep 5: t ake a ction on an i ndividual ’ s a ctivity 8 e 6 t echnologies , t hreat a nalysis r eporter e valuation g uide 7 step 5: take action on an individual’s activity in the individual user view window, select the “security” gauge from the list and t...
Page 12
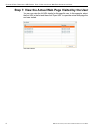
C hapter 2: d rill d own into a url g auge s tep 7: v iew the a ctual w eb p age v isited by the u ser 8 8 e 6 t echnologies , t hreat a nalysis r eporter e valuation g uide step 7: view the actual web page visited by the user you can now view the full url details for this specific user. In this exa...
Page 13: Hapter
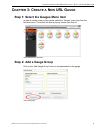
C hapter 3: c reate a n ew url g auge s tep 1: s elect the g auges m enu i tem 8 e 6 t echnologies , t hreat a nalysis r eporter e valuation g uide 9 c hapter 3: c reate a n ew url g auge step 1: select the gauges menu item in order to create a new custom gauge, select the “gauges” menu item from th...
Page 14: Step 3: Define The Gauge
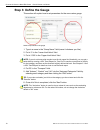
C hapter 3: c reate a n ew url g auge s tep 3: d efine the g auge 10 8 e 6 t echnologies , t hreat a nalysis r eporter e valuation g uide step 3: define the gauge this section will explain how to set parameters for the new custom gauge. Define components for the gauge 1. Type in a name in the “group...
Page 15: Step 4: Advanced Settings
C hapter 3: c reate a n ew url g auge s tep 4: a dvanced s ettings 8 e 6 t echnologies , t hreat a nalysis r eporter e valuation g uide 11 step 4: advanced settings for the purposes of this demonstration, click the “next” button to open a window where you configure advanced settings. Specify thresho...
Page 16: Hapter
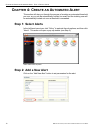
C hapter 4: c reate an a utomated a lert s tep 1: s elect a lerts 12 8 e 6 t echnologies , t hreat a nalysis r eporter e valuation g uide c hapter 4: c reate an a utomated a lert this section will step you through the process of creating an automated threshold per user, so you can be automatically n...
Page 17
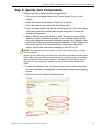
C hapter 4: c reate an a utomated a lert s tep 3: s pecify a lert c omponents 8 e 6 t echnologies , t hreat a nalysis r eporter e valuation g uide 13 step 3: specify alert components create a new alert by performing the following actions: 1. Click on one of the gauge names in the “current gauge” lis...
Page 18: Hapter
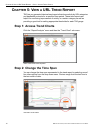
C hapter 5: v iew a url t rend r eport s tep 1: a ccess t rend c harts 14 8 e 6 t echnologies , t hreat a nalysis r eporter e valuation g uide c hapter 5: v iew a url t rend r eport tar lets you generate historical trend reports that show activity by url categories and bandwidth protocols for a spec...
Page 19: Hapter
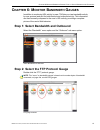
C hapter 6: m onitor b andwidth g auges s tep 1: s elect b andwidth and o utbound 8 e 6 t echnologies , t hreat a nalysis r eporter e valuation g uide 15 c hapter 6: m onitor b andwidth g auges in addition to monitoring url activity by user, tar lets you view bandwidth activity by user, protocol and...
Page 20
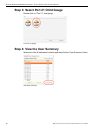
C hapter 6: m onitor b andwidth g auges s tep 3: s elect p ort 21 c hild g auge 16 8 e 6 t echnologies , t hreat a nalysis r eporter e valuation g uide step 3: select port 21 child gauge double-click on “port 21” child gauge. Ftp port 21 gauge step 4: view the user summary select one of the ip addre...
Page 21: Step 5: View Port Traffic
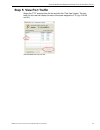
C hapter 6: m onitor b andwidth g auges s tep 5: v iew p ort t raffic 8 e 6 t echnologies , t hreat a nalysis r eporter e valuation g uide 17 step 5: view port traffic select the “ftp” protocol from the list and click the “port view” button. The port traffic for this user will display for each of th...
Page 22
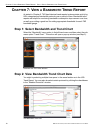
C hapter 7: v iew a b andwidth t rend r eport s tep 1: s elect b andwidth and t rend c hart 18 8 e 6 t echnologies , t hreat a nalysis r eporter e valuation g uide c hapter 7: v iew a b andwidth t rend r eport as stated in chapter 5, tar has historical trend reports to demonstrate activity by url ca...

