- DL manuals
- 8e6 Technologies
- Network Hardware
- TAR
- User Manual
8e6 Technologies TAR User Manual
Summary of TAR
Page 1
® threat analysis reporter user guide model: tar release 1.3.00 • manual version 1.01.
Page 2
Ii 8 e 6 t echnologies , t hreat a nalysis r eporter u ser g uide.
Page 3: Hreat
8 e 6 t echnologies , t hreat a nalysis r eporter u ser g uide iii t hreat a nalysis r eporter u ser g uide © 2009 8e6 technologies all rights reserved. Version 1.01, published january 2009 for software release 1.3.00 printed in the united states of america this document may not, in whole or in part...
Page 4
Iv 8 e 6 t echnologies , t hreat a nalysis r eporter u ser g uide.
Page 5: Ontents
8 e 6 t echnologies , t hreat a nalysis r eporter u ser g uide v c ontents i ntroductory s ection .................................................. 1 threat analysis reporter ........................................................... 1 about this user guide ...........................................
Page 6
C ontents vi 8 e 6 t echnologies , t hreat a nalysis r eporter u ser g uide remove a pattern................................................................ 23 ip ranges tab ........................................................................... 24 specify an ip range ..............................
Page 7
C ontents 8 e 6 t echnologies , t hreat a nalysis r eporter u ser g uide vii assign a threat score weight ........................................................ 52 chapter 2: custom gauge setup, usage ................................ 53 add a gauge ....................................................
Page 8
C ontents viii 8 e 6 t echnologies , t hreat a nalysis r eporter u ser g uide manage the lockout list ................................................................. 92 view a specified time period of lockouts ................................... 93 unlock a workstation ...............................
Page 9
C ontents 8 e 6 t echnologies , t hreat a nalysis r eporter u ser g uide ix chapter 3: view bandwidth trend reports .......................... 121 view all bandwidth gauge activity ............................................... 121 view activity for a specified gauge ..................................
Page 10: / P
C ontents x 8 e 6 t echnologies , t hreat a nalysis r eporter u ser g uide sync all devices ........................................................................... 149 chapter 5: perform backup, restoration .............................. 150 execute a backup on demand ..............................
Page 11
C ontents 8 e 6 t echnologies , t hreat a nalysis r eporter u ser g uide xi add the client to the white list .............................................. 170 adwaresafe pop-up blocker ......................................................... 171 disable pop-up blocking ...............................
Page 12
C ontents xii 8 e 6 t echnologies , t hreat a nalysis r eporter u ser g uide step 4: contact technical support ............................. 199 fan failure ......................................................................... 200 identify a fan failure .............................................
Page 13: Ntroductory
I ntroductory s ection t hreat a nalysis r eporter 8 e 6 t echnologies , t hreat a nalysis r eporter u ser g uide 1 i ntroductory s ection threat analysis reporter as perimeter security becomes more mature, user-gener- ated web threats increase and become critical aspects of maintaining networks. Ne...
Page 14: About This User Guide
I ntroductory s ection a bout this u ser g uide 2 8 e 6 t echnologies , t hreat a nalysis r eporter u ser g uide about this user guide the threat analysis reporter user guide addresses the network administrator designated to configure and manage the tar server on the network (referred to as the “glo...
Page 15: How to Use This User Guide
I ntroductory s ection h ow to u se this u ser g uide 8 e 6 t echnologies , t hreat a nalysis r eporter u ser g uide 3 d features a glossary of technical terminology used in this user guide. • index - this section includes an index of subjects and the first page numbers where they appear in this use...
Page 16: Terminology
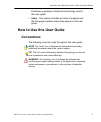
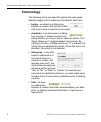
I ntroductory s ection h ow to u se this u ser g uide 4 8 e 6 t echnologies , t hreat a nalysis r eporter u ser g uide terminology the following terms are used throughout this user guide. Sample images (not to scale) are included for each item. • button - an object in a dialog box, window, or screen...
Page 17
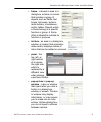
I ntroductory s ection h ow to u se this u ser g uide 8 e 6 t echnologies , t hreat a nalysis r eporter u ser g uide 5 • frame - a boxed-in area in a dialog box, window, or screen that includes a group of objects such as fields, text boxes, list boxes, buttons, radio buttons, checkboxes, and/or tabl...
Page 18
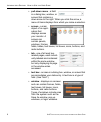
I ntroductory s ection h ow to u se this u ser g uide 6 8 e 6 t echnologies , t hreat a nalysis r eporter u ser g uide • pull-down menu - a field in a dialog box, window, or screen that contains a down arrow to the right. When you click the arrow, a menu of items displays from which you make a selec...
Page 19: Environment Requirements
I ntroductory s ection e nvironment r equirements 8 e 6 t echnologies , t hreat a nalysis r eporter u ser g uide 7 environment requirements workstation requirements minimum system requirements for the administrator include the following: • windows 2000 or later operating system (not compatible with ...
Page 20: Network Requirements
I ntroductory s ection e nvironment r equirements 8 8 e 6 t echnologies , t hreat a nalysis r eporter u ser g uide network requirements • high speed connection from the tar server to client workstations • https connection to 8e6’s software update server • internet connectivity for downloading java v...
Page 21: Getting Started
I ntroductory s ection g etting s tarted 8 e 6 t echnologies , t hreat a nalysis r eporter u ser g uide 9 getting started initial setup to initially set up your tar server, the administrator installing the unit should follow the instructions in the quick start guide, the booklet packaged with your t...
Page 22: Login Window
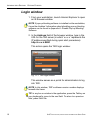
I ntroductory s ection g etting s tarted 10 8 e 6 t echnologies , t hreat a nalysis r eporter u ser g uide login window 1. From your workstation, launch internet explorer to open an ie browser window. Note: if pop-up blocking software is installed on the workstation, it must be disabled. Information...
Page 23: Log In
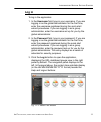
I ntroductory s ection g etting s tarted 8 e 6 t echnologies , t hreat a nalysis r eporter u ser g uide 11 log in to log in the application: 1. In the username field, type in your username. If you are logging in as the global administrator for the first time, enter the usernameregistered during the ...
Page 24: Help
I ntroductory s ection g etting s tarted 12 8 e 6 t echnologies , t hreat a nalysis r eporter u ser g uide navigation panel menu topics the navigation panel at the left of the screen consists of the following menu topics for configuring and using the applica- tion: • url dashboard - click this topic...
Page 25: Log Out
I ntroductory s ection g etting s tarted 8 e 6 t echnologies , t hreat a nalysis r eporter u ser g uide 13 log out to log out of the application, click the logout button in the upper right corner of the screen. When your session has been terminated, the login window re-displays. Exit the interface t...
Page 26
I ntroductory s ection n avigation t ips and c onventions 14 8 e 6 t echnologies , t hreat a nalysis r eporter u ser g uide navigation tips and conventions the following tips and list of conventions will help you navi- gate the administrator console: • move a pop-up window - click the toolbar of a p...
Page 27
I ntroductory s ection n avigation t ips and c onventions 8 e 6 t echnologies , t hreat a nalysis r eporter u ser g uide 15 • browser back button, refresh button - clicking either the back button or the refresh button in your browser will refresh the tar interface and log you out of the applica- tio...
Page 28: Reliminary
P reliminary s etup s ection i ntroduction 16 8 e 6 t echnologies , t hreat a nalysis r eporter u ser g uide p reliminary s etup s ection introduction the preliminary setup section of this manual is comprised of three chapters with information on the first steps to take in order to use the tar appli...
Page 29: Chapter 1: User Groups Setup
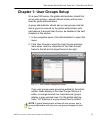
P reliminary s etup s ection c hapter 1: u ser g roups s etup 8 e 6 t echnologies , t hreat a nalysis r eporter u ser g uide 17 chapter 1: user groups setup on a new tar server, the global administrator should first set up user groups—whose internet activity will be moni- tored by group administrato...
Page 30
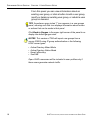
P reliminary s etup s ection c hapter 1: u ser g roups s etup 18 8 e 6 t echnologies , t hreat a nalysis r eporter u ser g uide from this panel you can view information about an existing user group, or click a button to add a user group, modify or delete an existing user group, or rebuild a user gro...
Page 31: View User Group Information
P reliminary s etup s ection c hapter 1: u ser g roups s etup 8 e 6 t echnologies , t hreat a nalysis r eporter u ser g uide 19 view user group information for each group in the user groups frame, the following information displays: status icon, group name, and the date the user group was last rebui...
Page 32
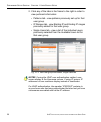
P reliminary s etup s ection c hapter 1: u ser g roups s etup 20 8 e 6 t echnologies , t hreat a nalysis r eporter u ser g uide 2. Click any of the tabs in the frame to the right in order to view pertinent information: • patterns tab - view patterns previously set up for that user group. • ip ranges...
Page 33: Add A User Group
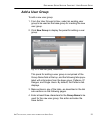
P reliminary s etup s ection c hapter 1: u ser g roups s etup 8 e 6 t echnologies , t hreat a nalysis r eporter u ser g uide 21 add a user group to add a new user group: 1. From the user groups list box, select an existing user group to be used as the base group for creating the new user group. 2. C...
Page 34: Patterns Tab
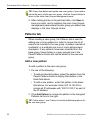
P reliminary s etup s ection c hapter 1: u ser g roups s etup 22 8 e 6 t echnologies , t hreat a nalysis r eporter u ser g uide tip: at any time before saving the new user group, if you need to cancel the entry of the new user group, click the cancel button to return to the main user groups manageme...
Page 35: Remove A Pattern
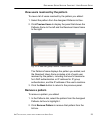
P reliminary s etup s ection c hapter 1: u ser g roups s etup 8 e 6 t echnologies , t hreat a nalysis r eporter u ser g uide 23 view users resolved by the pattern to view a list of users resolved by the pattern you added: 1. Select the pattern from the assigned patterns list box. 2. Click preview us...
Page 36: Ip Ranges Tab
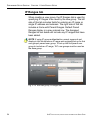
P reliminary s etup s ection c hapter 1: u ser g roups s etup 24 8 e 6 t echnologies , t hreat a nalysis r eporter u ser g uide ip ranges tab when creating a user group, the ip ranges tab is used for specifying ip ranges to be used by the new group. The left side of this tab includes fields for ente...
Page 37: Specify An Ip Range
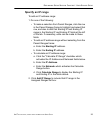
P reliminary s etup s ection c hapter 1: u ser g roups s etup 8 e 6 t echnologies , t hreat a nalysis r eporter u ser g uide 25 specify an ip range to add an ip address range: 1. Do one of the following: • to make a selection from parent ranges, click the row in the parent ranges frame to highlight ...
Page 38: Remove An Ip Address Range
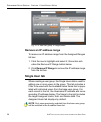
P reliminary s etup s ection c hapter 1: u ser g roups s etup 26 8 e 6 t echnologies , t hreat a nalysis r eporter u ser g uide fig. 2:1-6 add user group, ip range added remove an ip address range to remove an ip address range from the assigned ranges list box: 1. Click the row to highlight and sele...
Page 39
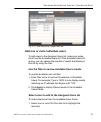
P reliminary s etup s ection c hapter 1: u ser g roups s etup 8 e 6 t echnologies , t hreat a nalysis r eporter u ser g uide 27 fig. 2:1-7 add user group, single users tab add one or more individual users to add users to the assigned users list, make your selec- tions from the available users list. ...
Page 40
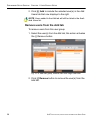
P reliminary s etup s ection c hapter 1: u ser g roups s etup 28 8 e 6 t echnologies , t hreat a nalysis r eporter u ser g uide 2. Click [+] add to include the selected user(s) in the add users tab that now displays to the right. Note: users added to the add tab will still be listed in the avail- ab...
Page 41: Edit A User Group
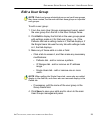
P reliminary s etup s ection c hapter 1: u ser g roups s etup 8 e 6 t echnologies , t hreat a nalysis r eporter u ser g uide 29 edit a user group note: global and group administrators can only edit user groups they have created, and cannot edit their base groups or imported user groups. To edit a us...
Page 42: Rebuild The User Group
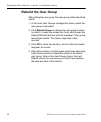
P reliminary s etup s ection c hapter 1: u ser g roups s etup 30 8 e 6 t echnologies , t hreat a nalysis r eporter u ser g uide rebuild the user group after editing the user group, the user group profile should be rebuilt. 1. In the main user groups management panel, select the user group to be rebu...
Page 43: Delete A User Group
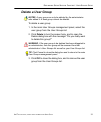
P reliminary s etup s ection c hapter 1: u ser g roups s etup 8 e 6 t echnologies , t hreat a nalysis r eporter u ser g uide 31 delete a user group notes: a user group can only be deleted by the administrator who added it. A base group cannot be deleted. To delete a user group: 1. In the main user g...
Page 44
P reliminary s etup s ection c hapter 2: a dmin g roups s etup 32 8 e 6 t echnologies , t hreat a nalysis r eporter u ser g uide chapter 2: admin groups setup once you have set up user groups, you are ready to create a set of management permissions, so that a group adminis- trator you set up will on...
Page 45: Add A Group
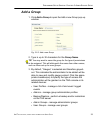
P reliminary s etup s ection c hapter 2: a dmin g roups s etup 8 e 6 t echnologies , t hreat a nalysis r eporter u ser g uide 33 add a group 1. Click add a group to open the add a new group pop-up window: fig. 2:2-2 add a new group 2. Type in up to 32 characters for the group name. Tip: you may want...
Page 46
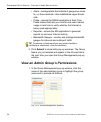
P reliminary s etup s ection c hapter 2: a dmin g roups s etup 34 8 e 6 t echnologies , t hreat a nalysis r eporter u ser g uide • alerts - manage alerts that indicate if gauges are close to—or have reached—their established upper thresh- olds • probe - access the r3000 application’s real time probe...
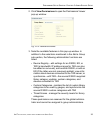
Page 47
P reliminary s etup s ection c hapter 2: a dmin g roups s etup 8 e 6 t echnologies , t hreat a nalysis r eporter u ser g uide 35 2. Click view permissions to open the permissions viewer pop-up window: fig. 2:2-4 permissions viewer 3. Note the available features in this pop-up window. In addition to ...
Page 48: Edit An Administrator Group
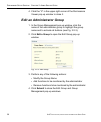
P reliminary s etup s ection c hapter 2: a dmin g roups s etup 36 8 e 6 t echnologies , t hreat a nalysis r eporter u ser g uide 4. Click the “x” in the upper right corner of the permissions viewer pop-up window to close it. Edit an administrator group 1. In the group management pop-up window, click...
Page 49
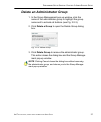
P reliminary s etup s ection c hapter 2: a dmin g roups s etup 8 e 6 t echnologies , t hreat a nalysis r eporter u ser g uide 37 delete an administrator group 1. In the group management pop-up window, click the name of the administrator group to highlight the group name and to activate all buttons (...
Page 50: Chapter 3: Admins Setup
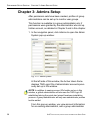
P reliminary s etup s ection c hapter 2: a dmin g roups s etup 38 8 e 6 t echnologies , t hreat a nalysis r eporter u ser g uide chapter 3: admins setup after permission sets have been created, profiles of group administrators can be set up to monitor user groups. This function is available to a gro...
Page 51: View Account Info
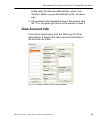
P reliminary s etup s ection c hapter 2: a dmin g roups s etup 8 e 6 t echnologies , t hreat a nalysis r eporter u ser g uide 39 profile using the add new administrator wizard, and modify or delete a group administrator profile, as neces- sary. 2. After performing the intended actions in this window...
Page 52: View Account Info
P reliminary s etup s ection c hapter 2: a dmin g roups s etup 40 8 e 6 t echnologies , t hreat a nalysis r eporter u ser g uide view account info the following entries saved for the administrator’s account display in the account info frame: employee name, work phone, email address, tar login, user ...
Page 53: Add An Administrator Profile
P reliminary s etup s ection c hapter 2: a dmin g roups s etup 8 e 6 t echnologies , t hreat a nalysis r eporter u ser g uide 41 add an administrator profile use the add new administrator wizard to add a group administrator profile. Account info tab 1. Click add new admin to open the add new adminis...
Page 54: Contact Info Tab
P reliminary s etup s ection c hapter 2: a dmin g roups s etup 42 8 e 6 t echnologies , t hreat a nalysis r eporter u ser g uide 6. If an entry was made in the ldap username field, type in the exact characters for the ldap active directory domain name in which the group administrator is regis- tered...
Page 55: Groups Tab
P reliminary s etup s ection c hapter 2: a dmin g roups s etup 8 e 6 t echnologies , t hreat a nalysis r eporter u ser g uide 43 3. Optional: type in the group administrator’s home phone number without entering any special characters. 4. Type in the group administrator’s email address. 5. Optional: ...
Page 56: Edit Account Info
P reliminary s etup s ection c hapter 2: a dmin g roups s etup 44 8 e 6 t echnologies , t hreat a nalysis r eporter u ser g uide 3. After selecting each user group to be assigned to the group administrator, click submit to close the add new administrator pop-up window and to return to the admin syst...
Page 57: Change Password
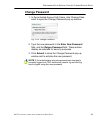
P reliminary s etup s ection c hapter 2: a dmin g roups s etup 8 e 6 t echnologies , t hreat a nalysis r eporter u ser g uide 45 change password 1. In the activated account info frame, click change pass- word to open the change password pop-up window: fig. 2:3-6 change password 2. Type the new passw...
Page 58: Add A Group
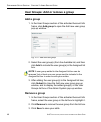
P reliminary s etup s ection c hapter 2: a dmin g roups s etup 46 8 e 6 t echnologies , t hreat a nalysis r eporter u ser g uide user groups: add or remove a group add a group 1. In the user groups section of the activated account info frame, click add group to open the add new user group pop-up win...
Page 59: Delete Admin
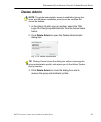
P reliminary s etup s ection c hapter 2: a dmin g roups s etup 8 e 6 t echnologies , t hreat a nalysis r eporter u ser g uide 47 delete admin note: the global administrator account established during the quick start hardware installation process can be modified but cannot be deleted. 1. In the admin...
Page 60: Onfiguration
C onfiguration s ection i ntroduction 48 8 e 6 t echnologies , t hreat a nalysis r eporter u ser g uide c onfiguration s ection introduction the configuration section of this user guide is comprised of five chapters with information on configuring and using tar to immediately alert you to any end us...
Page 61: Anatomy of A Gauge
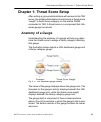
C onfiguration s ection c hapter 1: t hreat s core s etup 8 e 6 t echnologies , t hreat a nalysis r eporter u ser g uide 49 chapter 1: threat score setup after setting up group administrators with access to the tar server, the global administrator should assign a threat score “weight” to each librar...
Page 62: Gauge Score Methodology
C onfiguration s ection c hapter 1: t hreat s core s etup 50 8 e 6 t echnologies , t hreat a nalysis r eporter u ser g uide gauge score methodology the numerical score displayed inside the url dashboard gauge icon is based upon: the library categories included in the gauge, the threat score assigned...
Page 63
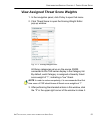
C onfiguration s ection c hapter 1: t hreat s core s etup 8 e 6 t echnologies , t hreat a nalysis r eporter u ser g uide 51 view assigned threat score weights 1. In the navigation panel, click policy to open that menu. 2. Click threat score to open the scoring weight editor pop-up window: fig. 3:1-2...
Page 64: Assign A Threat Score Weight
C onfiguration s ection c hapter 1: t hreat s core s etup 52 8 e 6 t echnologies , t hreat a nalysis r eporter u ser g uide assign a threat score weight 1. Click the category to highlight it. 2. Click in the severity column to make the field editable. 3. One of the following entries can be made: • e...
Page 65
C onfiguration s ection c hapter 2: c ustom g auge s etup , u sage 8 e 6 t echnologies , t hreat a nalysis r eporter u ser g uide 53 chapter 2: custom gauge setup, usage with threat score weights established, a group administrator can begin setting up gauges for monitoring end users’ internet activi...
Page 66: Add A Gauge
C onfiguration s ection c hapter 2: c ustom g auge s etup , u sage 54 8 e 6 t echnologies , t hreat a nalysis r eporter u ser g uide 2. In the current gauge groups list box, click the gauge name to display a list of library categories and threshold criteria set up for that gauge: fig. 3:2-2 gauge ma...
Page 67: Add Gauge Information
C onfiguration s ection c hapter 2: c ustom g auge s etup , u sage 8 e 6 t echnologies , t hreat a nalysis r eporter u ser g uide 55 when adding a gauge group, you need to do the following: • name the gauge, and specify limit and timespan values • synchronize all library categories from the source r...
Page 68: Sync All Categories
C onfiguration s ection c hapter 2: c ustom g auge s etup , u sage 56 8 e 6 t echnologies , t hreat a nalysis r eporter u ser g uide sync all categories to synchronize 8e6 supplied library category updates and custom libraries from the source r3000 to this tar unit, click sync all categories. Select...
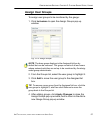
Page 69: Assign User Groups
C onfiguration s ection c hapter 2: c ustom g auge s etup , u sage 8 e 6 t echnologies , t hreat a nalysis r eporter u ser g uide 57 assign user groups to assign user groups to be monitored by the gauge: 1. Click inclusions to open the assign groups pop-up window: fig. 3:2-4 assign groups note: the ...
Page 70
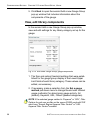
C onfiguration s ection c hapter 2: c ustom g auge s etup , u sage 58 8 e 6 t echnologies , t hreat a nalysis r eporter u ser g uide 5. Click next to open the second add a new gauge group pop-up window that includes information about the components of the gauge. View, edit library components in the ...
Page 71
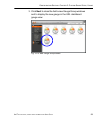
C onfiguration s ection c hapter 2: c ustom g auge s etup , u sage 8 e 6 t echnologies , t hreat a nalysis r eporter u ser g uide 59 3. Click next to close the add a new gauge group windows and to display the new gauge in the url dashboard gauge view: fig. 3:2-6 new gauge group added.
Page 72: Types of Gauges
C onfiguration s ection c hapter 2: c ustom g auge s etup , u sage 60 8 e 6 t echnologies , t hreat a nalysis r eporter u ser g uide gauge components and activity types of gauges there are four types of gauges: url dashboard gauges, library category gauges, protocol bandwidth gauges, and port gauges...
Page 73: Read A Gauge
C onfiguration s ection c hapter 2: c ustom g auge s etup , u sage 8 e 6 t echnologies , t hreat a nalysis r eporter u ser g uide 61 read a gauge gauges become active when end users access urls/ports included in that gauge. Activity is depicted by the position of the dial within the gauge—green (saf...
Page 74
C onfiguration s ection c hapter 2: c ustom g auge s etup , u sage 62 8 e 6 t echnologies , t hreat a nalysis r eporter u ser g uide be that one or more library categories within the gauge currently have a high score, and that one or more end users are responsible for this threat. Inbound/outbound p...
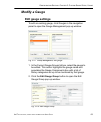
Page 75: Modify A Gauge
C onfiguration s ection c hapter 2: c ustom g auge s etup , u sage 8 e 6 t echnologies , t hreat a nalysis r eporter u ser g uide 63 modify a gauge edit gauge settings to edit an existing gauge, click gauges in the navigation panel to open the gauge management pop-up window: fig. 3:2-7 group managem...
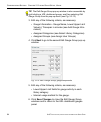
Page 76
C onfiguration s ection c hapter 2: c ustom g auge s etup , u sage 64 8 e 6 t echnologies , t hreat a nalysis r eporter u ser g uide tip: the edit gauge group pop-up window is also accessible by right-clicking a url dashboard gauge, and then selecting edit gauge group from the pop-up menu (see fig. ...
Page 77: Hide, Show A Url Gauge
C onfiguration s ection c hapter 2: c ustom g auge s etup , u sage 8 e 6 t echnologies , t hreat a nalysis r eporter u ser g uide 65 note: when saving your edits, the gauge hits and score are reset to zero (“0”). Hide, show a url gauge if you only want to view certain url gauges and their asso- ciat...
Page 78
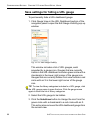
C onfiguration s ection c hapter 2: c ustom g auge s etup , u sage 66 8 e 6 t echnologies , t hreat a nalysis r eporter u ser g uide save settings for hiding a url gauge to permanently hide a url dashboard gauge: 1. Click gauge view in the url dashboard section of the navigation panel to open the ed...
Page 79: Delete A Gauge
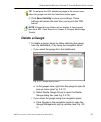
C onfiguration s ection c hapter 2: c ustom g auge s etup , u sage 8 e 6 t echnologies , t hreat a nalysis r eporter u ser g uide 67 tip: to redisplay the url dashboard gauge in the current view, select the gauge and click the hide/show button again. 4. Click save visibility to save your settings. T...
Page 80
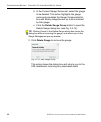
C onfiguration s ection c hapter 2: c ustom g auge s etup , u sage 68 8 e 6 t echnologies , t hreat a nalysis r eporter u ser g uide b. In the current gauge groups list, select the gauge to be deleted. This action highlights the gauge name and populates the gauge components list box with library cat...
Page 81: View End User Gauge Activity
C onfiguration s ection c hapter 2: c ustom g auge s etup , u sage 8 e 6 t echnologies , t hreat a nalysis r eporter u ser g uide 69 view end user gauge activity there are several ways to access information on end user gauge activity: • overall end user gauge activity - for a snapshot of all current...
Page 82: View Overall Ranking
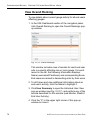
C onfiguration s ection c hapter 2: c ustom g auge s etup , u sage 70 8 e 6 t echnologies , t hreat a nalysis r eporter u ser g uide view overall ranking to view details about current gauge activity for all end users affecting gauges: 1. In the url dashboard section of the navigation panel, click ov...
Page 83
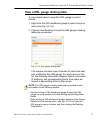
C onfiguration s ection c hapter 2: c ustom g auge s etup , u sage 8 e 6 t echnologies , t hreat a nalysis r eporter u ser g uide 71 view a url gauge ranking table to view details about a specified url gauge’s current activity: 1. Right-click the url dashboard gauge to open its pop-up menu (see fig....
Page 84
C onfiguration s ection c hapter 2: c ustom g auge s etup , u sage 72 8 e 6 t echnologies , t hreat a nalysis r eporter u ser g uide 3. To drill down and view additional information about an end user’s activity, click the name to highlight it. 4. Click user summary to open the individual user view p...
Page 85
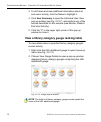
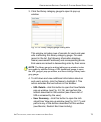
C onfiguration s ection c hapter 2: c ustom g auge s etup , u sage 8 e 6 t echnologies , t hreat a nalysis r eporter u ser g uide 73 3. Click the library category gauge to open its pop-up window: fig. 3:2-16 library category gauge ranking table this window includes rows of records for each end user ...
Page 86
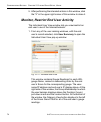
C onfiguration s ection c hapter 2: c ustom g auge s etup , u sage 74 8 e 6 t echnologies , t hreat a nalysis r eporter u ser g uide 5. After performing the intended actions in this window, click the “x” in the upper right corner of this window to close it. Monitor, restrict end user activity the in...
Page 87
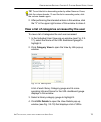
C onfiguration s ection c hapter 2: c ustom g auge s etup , u sage 8 e 6 t echnologies , t hreat a nalysis r eporter u ser g uide 75 tip: to sort the list in descending order by either name or score, click the column header. To sort the list in ascending order, click the column header again. 2. Afte...
Page 88
C onfiguration s ection c hapter 2: c ustom g auge s etup , u sage 76 8 e 6 t echnologies , t hreat a nalysis r eporter u ser g uide accessed by the end user within that category (see view a list of urls accessed by the user). 5. After performing the intended actions in this window, click the “x” in...
Page 89
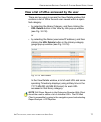
C onfiguration s ection c hapter 2: c ustom g auge s etup , u sage 8 e 6 t echnologies , t hreat a nalysis r eporter u ser g uide 77 view a list of urls accessed by the user there are two ways to access the view details window that contains a list of urls the end user viewed within a speci- fied cat...
Page 90
C onfiguration s ection c hapter 2: c ustom g auge s etup , u sage 78 8 e 6 t echnologies , t hreat a nalysis r eporter u ser g uide 1. If a url in the list is linked to a page or object, select the url in the list, and then click open url to open the page/object in a separate browser window. 2. Aft...
Page 91
C onfiguration s ection c hapter 2: c ustom g auge s etup , u sage 8 e 6 t echnologies , t hreat a nalysis r eporter u ser g uide 79 • low - this selection lets you choose which library cate- gory’s contents the end user will not be able to access • medium - this selection locks out the end user fro...
Page 92
C onfiguration s ection c hapter 2: c ustom g auge s etup , u sage 80 8 e 6 t echnologies , t hreat a nalysis r eporter u ser g uide c. After adding all library categories, click next to open the alert box stating: “the user has been locked out.” d. Click the “x” in the upper right corner of the box...
Page 93: End User Workstation Lockout
C onfiguration s ection c hapter 2: c ustom g auge s etup , u sage 8 e 6 t echnologies , t hreat a nalysis r eporter u ser g uide 81 end user workstation lockout the following scenario occurs for the end user when he/she is locked out: • low severity lockout - in this scenario, after attaining the d...
Page 94
C onfiguration s ection c hapter 2: c ustom g auge s etup , u sage 82 8 e 6 t echnologies , t hreat a nalysis r eporter u ser g uide fig. 3:2-23 medium severity lockout page this page contains the following information: “502 access denied by 8e6 r3000 enterprise filter”. • high severity lockout - in...
Page 95
C onfiguration s ection c hapter 3: a lerts , l ockout m anagement 8 e 6 t echnologies , t hreat a nalysis r eporter u ser g uide 83 chapter 3: alerts, lockout management after setting up gauges for monitoring end user internet activity, notifications for internet abuse should be set up in the form ...
Page 96: Add An Alert
C onfiguration s ection c hapter 3: a lerts , l ockout m anagement 84 8 e 6 t echnologies , t hreat a nalysis r eporter u ser g uide add an alert 1. In the current gauges box, click the gauge for which an alert will be created (see fig. 3:3-1). 2. Click add new alert to open the add a new alert pop-...
Page 97: Email Alert Function
C onfiguration s ection c hapter 3: a lerts , l ockout m anagement 8 e 6 t echnologies , t hreat a nalysis r eporter u ser g uide 85 • email - an email alert notifies a group administrator via email if an end user has reached the threshold limit set up in a gauge alert. • lockout - the lockout funct...
Page 98: Receive Email Alerts
C onfiguration s ection c hapter 3: a lerts , l ockout m anagement 86 8 e 6 t echnologies , t hreat a nalysis r eporter u ser g uide receive email alerts if an alert is triggered, an email message is sent to the mailbox address(es) specified. This message includes the following information: • subjec...
Page 99: System Tray Alert Function
C onfiguration s ection c hapter 3: a lerts , l ockout m anagement 8 e 6 t echnologies , t hreat a nalysis r eporter u ser g uide 87 3. Specify the duration (hours) of the end users’ lockout: unlimited, half hour, 1, 1-1/2 ... 8. Note: if “unlimited” is specified, the end user will remain locked out...
Page 100: View Alert Settings
C onfiguration s ection c hapter 3: a lerts , l ockout m anagement 88 8 e 6 t echnologies , t hreat a nalysis r eporter u ser g uide this action populates the current alerts box with any existing alerts created for that gauge. 2. Select the alert to be viewed or modified by clicking on it to highlig...
Page 101: Modify An Alert
C onfiguration s ection c hapter 3: a lerts , l ockout m anagement 8 e 6 t echnologies , t hreat a nalysis r eporter u ser g uide 89 modify an alert 1. In the alert manager pop-up window, click edit alert to open the edit an alert pop-up window: fig. 3:3-5 edit an alert 2. The following items can be...
Page 102: Delete An Alert
C onfiguration s ection c hapter 3: a lerts , l ockout m anagement 90 8 e 6 t echnologies , t hreat a nalysis r eporter u ser g uide delete an alert 1. In the alert manager pop-up window, click delete alert to open the delete alert dialog box: fig. 3:3-6 delete alert 2. Click delete alert to close t...
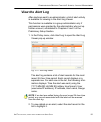
Page 103: View The Alert Log
C onfiguration s ection c hapter 3: a lerts , l ockout m anagement 8 e 6 t echnologies , t hreat a nalysis r eporter u ser g uide 91 view the alert log after alerts are sent to an administrator, a list of alert activity is available for viewing in the alert log viewer. This function is available to ...
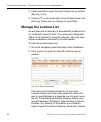
Page 104: Manage The Lockout List
C onfiguration s ection c hapter 3: a lerts , l ockout m anagement 92 8 e 6 t echnologies , t hreat a nalysis r eporter u ser g uide 3. Click view alert to open the alert viewer pop-up window (see fig. 3:3-4). 4. Click the “x” in the upper right corner of alert viewer and alert log viewer pop-up win...
Page 105
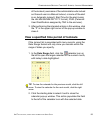
C onfiguration s ection c hapter 3: a lerts , l ockout m anagement 8 e 6 t echnologies , t hreat a nalysis r eporter u ser g uide 93 of the lockout (username of the administrator who locked out the end user in a manual lockout, or name of the alert in an automatic lockout); start time for the alert ...
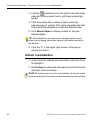
Page 106: Unlock A Workstation
C onfiguration s ection c hapter 3: a lerts , l ockout m anagement 94 8 e 6 t echnologies , t hreat a nalysis r eporter u ser g uide 3. Click the calendar icon on the right to open the larger calendar for the current month, with today’s date high- lighted. 4. Click the ending date to select it and t...
Page 107
C onfiguration s ection c hapter 4: a nalyze w eb u sage t rends 8 e 6 t echnologies , t hreat a nalysis r eporter u ser g uide 95 chapter 4: analyze web usage trends when analyzing end user internet usage trends, url trend reports help you configure gauges and alerts so you can focus on current tra...
Page 108: View Url Trend Reports
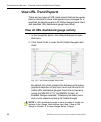
C onfiguration s ection c hapter 4: a nalyze w eb u sage t rends 96 8 e 6 t echnologies , t hreat a nalysis r eporter u ser g uide view url trend reports there are two types of url trend reports that can be gener- ated on demand to show total gauge score averages for a specified, limited time period...
Page 109
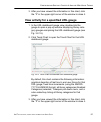
C onfiguration s ection c hapter 4: a nalyze w eb u sage t rends 8 e 6 t echnologies , t hreat a nalysis r eporter u ser g uide 97 3. After you have viewed the information in this chart, click the “x” in the upper right corner of the window to close it. View activity for a specified url gauge 1. In ...
Page 110: Suppress Specified Scores
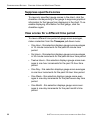
C onfiguration s ection c hapter 4: a nalyze w eb u sage t rends 98 8 e 6 t echnologies , t hreat a nalysis r eporter u ser g uide suppress specified scores to view only specified gauge scores in the chart, click the checkbox corresponding to the gauge to suppress graphical information for that gaug...
Page 111
C onfiguration s ection c hapter 4: a nalyze w eb u sage t rends 8 e 6 t echnologies , t hreat a nalysis r eporter u ser g uide 99 access real time probe, web client r3000 real time probe reports can be generated to obtain more information about end user internet usage trends. If an er server is con...
Page 112: Perform A Custom Search
C onfiguration s ection c hapter 5: v iew u ser c ategory a ctivity 100 8 e 6 t echnologies , t hreat a nalysis r eporter u ser g uide chapter 5: view user category activity if there are certain end users who are generating excessive, unwanted traffic on the network, or if some library catego- ries ...
Page 113
C onfiguration s ection c hapter 5: v iew u ser c ategory a ctivity 8 e 6 t echnologies , t hreat a nalysis r eporter u ser g uide 101 4. Make a selection from the timespan pull-down menu for the time period in which urls within the category were accessed: last 15 minutes, last 30 minutes, last 45 m...
Page 114
C onfiguration s ection c hapter 5: v iew u ser c ategory a ctivity 102 8 e 6 t echnologies , t hreat a nalysis r eporter u ser g uide view urls within the accessed category to find out which urls an end user accessed within the library category: 1. Click the user to highlight his/her record. This a...
Page 115: Print The Results
C onfiguration s ection c hapter 5: v iew u ser c ategory a ctivity 8 e 6 t echnologies , t hreat a nalysis r eporter u ser g uide 103 print the results to print the results displayed in this window: 1. Click any record to highlight it and to activate the print report button. 2. Click print report t...
Page 116: Andwidth
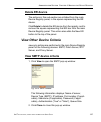
B andwidth m anagement s ection i ntroduction 104 8 e 6 t echnologies , t hreat a nalysis r eporter u ser g uide b andwidth m anagement s ection introduction whereas the url dashboard bandwidth gauge monitors end user internet activity by the number of url hits, gauges in the bandwidth section of th...
Page 117: Bandwidth Gauge Components
B andwidth m anagement s ection c hapter 1: m onitor b andwidth g auges 8 e 6 t echnologies , t hreat a nalysis r eporter u ser g uide 105 chapter 1: monitor bandwidth gauges bandwidth gauges work similarly to url dashboard gauges, except these gauges solely monitor inbound or outbound network traff...
Page 118
B andwidth m anagement s ection c hapter 1: m onitor b andwidth g auges 106 8 e 6 t echnologies , t hreat a nalysis r eporter u ser g uide • 8080 - http alternate (http-alt) tcp port used under the following conditions: when running a second web server on the same machine (the other is using port 80...
Page 119
B andwidth m anagement s ection c hapter 1: m onitor b andwidth g auges 8 e 6 t echnologies , t hreat a nalysis r eporter u ser g uide 107 • 4665 - tcp/udp port for edonkey 2000 • 6346 - tcp/udp port for gnutella file sharing (frost- wire, limewire, bearshare, etc.) • 6347 - tcp/udp port for gnutell...
Page 120: View Bandwidth Gauges
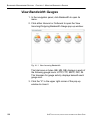
B andwidth m anagement s ection c hapter 1: m onitor b andwidth g auges 108 8 e 6 t echnologies , t hreat a nalysis r eporter u ser g uide view bandwidth gauges 1. In the navigation panel, click bandwidth to open its menu. 2. Click either inbound or outbound to open the view incoming/outgoing bandwi...
Page 121
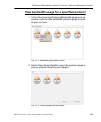
B andwidth m anagement s ection c hapter 1: m onitor b andwidth g auges 8 e 6 t echnologies , t hreat a nalysis r eporter u ser g uide 109 view bandwidth usage for a specified protocol 1. In the view incoming/outgoing bandwidth gauge pop-up window, right-click the bandwidth protocol gauge to open it...
Page 122
B andwidth m anagement s ection c hapter 1: m onitor b andwidth g auges 110 8 e 6 t echnologies , t hreat a nalysis r eporter u ser g uide the total score in bytes (kb, mb, gb) displays in each of the port icons. The total number of bytes for all ports in this window equals the total number of bytes...
Page 123
B andwidth m anagement s ection c hapter 1: m onitor b andwidth g auges 8 e 6 t echnologies , t hreat a nalysis r eporter u ser g uide 111 view overall ranking for bandwidth to view details about current bandwidth gauge activity for all end users affecting bandwidth gauges: 1. In the bandwidth secti...
Page 124
B andwidth m anagement s ection c hapter 1: m onitor b andwidth g auges 112 8 e 6 t echnologies , t hreat a nalysis r eporter u ser g uide actions described for this window (see monitor, restrict bandwidth usage). 4. Click the “x” in the upper right corner of this pop-up window to close it. View a p...
Page 125
B andwidth m anagement s ection c hapter 1: m onitor b andwidth g auges 8 e 6 t echnologies , t hreat a nalysis r eporter u ser g uide 113 note: the protocol gauge’s ranking table pop-up window is also accessible by right-clicking a protocol gauge, selecting view gauge details from the pop-up menu (...
Page 126
B andwidth m anagement s ection c hapter 1: m onitor b andwidth g auges 114 8 e 6 t echnologies , t hreat a nalysis r eporter u ser g uide fig. 4:1-6 port gauge ranking table by default, this window includes rows of records for each end user who is affecting this port gauge. For each record in the l...
Page 127
B andwidth m anagement s ection c hapter 1: m onitor b andwidth g auges 8 e 6 t echnologies , t hreat a nalysis r eporter u ser g uide 115 monitor, restrict bandwidth usage the individual user view window lets you view/restrict an end user’s bandwidth usage. 1. From any of the user ranking windows, ...
Page 128
B andwidth m anagement s ection c hapter 1: m onitor b andwidth g auges 116 8 e 6 t echnologies , t hreat a nalysis r eporter u ser g uide view the end user’s port usage in bytes to monitor an end user’s bandwidth port traffic: 1. In the individual user view pop-up window (see fig. 4:1- 7), select t...
Page 129
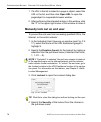
B andwidth m anagement s ection c hapter 1: m onitor b andwidth g auges 8 e 6 t echnologies , t hreat a nalysis r eporter u ser g uide 117 manually lock out an end user to prevent the end user from accessing specified urls that result in too much bandwidth usage: 1. In the individual user view pop-u...
Page 130
B andwidth m anagement s ection c hapter 1: m onitor b andwidth g auges 118 8 e 6 t echnologies , t hreat a nalysis r eporter u ser g uide a. From the available categories list box, select the available library category containing urls the end user should not access. B. Click add to move the library...
Page 131
B andwidth m anagement s ection c hapter 2: m odify b andwidth g auges 8 e 6 t echnologies , t hreat a nalysis r eporter u ser g uide 119 chapter 2: modify bandwidth gauges while bandwidth protocol gauges cannot be added or removed, their timespan and threshold limits can be modi- fied, along with t...
Page 132: Edit Port Settings
B andwidth m anagement s ection c hapter 2: m odify b andwidth g auges 120 8 e 6 t echnologies , t hreat a nalysis r eporter u ser g uide • upper limit - the default upper threshold for http is 65535, and 20000 for all other protocols 3. If you do not need to modify any port settings, click save to ...
Page 133
B andwidth m anagement s ection c hapter 3: v iew b andwidth t rend r eports 8 e 6 t echnologies , t hreat a nalysis r eporter u ser g uide 121 chapter 3: view bandwidth trend reports similarly to url trend reports, bandwidth trend reports help you further configure bandwidth gauges and alerts so yo...
Page 134
B andwidth m anagement s ection c hapter 3: v iew b andwidth t rend r eports 122 8 e 6 t echnologies , t hreat a nalysis r eporter u ser g uide down menu, and a color-coded key listing all visible gauges. 3. After you have viewed the information in this chart, click the “x” in the upper right corner...
Page 135
B andwidth m anagement s ection c hapter 3: v iew b andwidth t rend r eports 8 e 6 t echnologies , t hreat a nalysis r eporter u ser g uide 123 4. After you have viewed the information in this chart, click the “x” in the upper right corner of the window to close it. Suppress criteria of specified po...
Page 136: Dministration
A dministration s ection i ntroduction 124 8 e 6 t echnologies , t hreat a nalysis r eporter u ser g uide a dministration s ection introduction the administration section of this user guide is comprised of six chapters with instructions on maintaining the tar server or its database. Notes: as part o...
Page 137
A dministration s ection i ntroduction 8 e 6 t echnologies , t hreat a nalysis r eporter u ser g uide 125 • chapter 6: install software updates - this chapter explains how the global administrator installs software updates on the tar server. • chapter 7: view hard disk status - this chapter explains...
Page 138
A dministration s ection c hapter 1: c ustom c ategory m aintenance 126 8 e 6 t echnologies , t hreat a nalysis r eporter u ser g uide chapter 1: custom category maintenance the custom categories window is used by the global administrator to manage criteria for custom categories set up on the source...
Page 139: View Custom Categories
A dministration s ection c hapter 1: c ustom c ategory m aintenance 8 e 6 t echnologies , t hreat a nalysis r eporter u ser g uide 127 view custom categories to view details about a custom category: 1. Select the custom category from the custom categories frame, which populates fields, checkbox(es),...
Page 140: Add A Custom Category
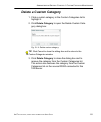
A dministration s ection c hapter 1: c ustom c ategory m aintenance 128 8 e 6 t echnologies , t hreat a nalysis r eporter u ser g uide add a custom category 1. Click new category. 2. Enter up to seven characters for the category name. This entry automatically displays in uppercase charac- ters. 3. E...
Page 141
A dministration s ection c hapter 1: c ustom c ategory m aintenance 8 e 6 t echnologies , t hreat a nalysis r eporter u ser g uide 129 • url keyword - clicking this checkbox displays the url keyword field, and “url keywords” tab below. 5. Make the following entries, based on the checkbox selec- tion...
Page 142
A dministration s ection c hapter 1: c ustom c ategory m aintenance 130 8 e 6 t echnologies , t hreat a nalysis r eporter u ser g uide synchronize tar with the r3000 custom library category synchronization automatically takes place each hour. During this process, the following occurs: • new custom c...
Page 143: Delete A Custom Category
A dministration s ection c hapter 1: c ustom c ategory m aintenance 8 e 6 t echnologies , t hreat a nalysis r eporter u ser g uide 131 delete a custom category 1. Click a custom category in the custom categories list to highlight it. 2. Click delete category to open the delete custom cate- gory dial...
Page 144
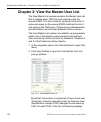
A dministration s ection c hapter 2: v iew the m aster u ser l ist 132 8 e 6 t echnologies , t hreat a nalysis r eporter u ser g uide chapter 2: view the master user list the view master list window contains the master user list that is created when tar first communicates with the source r3000. This...
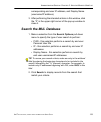
Page 145: Search The Mul Database
A dministration s ection c hapter 2: v iew the m aster u ser l ist 8 e 6 t echnologies , t hreat a nalysis r eporter u ser g uide 133 corresponding end user ip address, and display name (username/ip address). 3. After performing the intended actions in this window, click the “x” in the upper right c...
Page 146: View End User Activity
A dministration s ection c hapter 2: v iew the m aster u ser l ist 134 8 e 6 t echnologies , t hreat a nalysis r eporter u ser g uide view end user activity 1. To drill down and view additional information about an end user’s activity, select the user’s record to highlight it. 2. Click user summary ...
Page 147
A dministration s ection c hapter 3: v iew a dministrator a ctivity 8 e 6 t echnologies , t hreat a nalysis r eporter u ser g uide 135 chapter 3: view administrator activity the log viewer window is used for viewing the most recent administrative activity performed on tar by the global or group admi...
Page 148
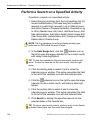
A dministration s ection c hapter 3: v iew a dministrator a ctivity 136 8 e 6 t echnologies , t hreat a nalysis r eporter u ser g uide perform a search on a specified activity to perform a search on a specified activity: 1. Select the type of activity from the log headings list: all, invalid authent...
Page 149: Search Results
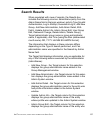
A dministration s ection c hapter 3: v iew a dministrator a ctivity 8 e 6 t echnologies , t hreat a nalysis r eporter u ser g uide 137 search results when populated with rows of records, the results box includes the following columns: adminname (entry from the admin name field in the login window); ...
Page 150
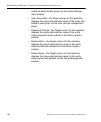
A dministration s ection c hapter 3: v iew a dministrator a ctivity 138 8 e 6 t echnologies , t hreat a nalysis r eporter u ser g uide edited an administrator group via the group manage- ment window • user group edit - the target column for this selection displays the group administrator name of the...
Page 151
A dministration s ection c hapter 4: m aintain the d evice r egistry 8 e 6 t echnologies , t hreat a nalysis r eporter u ser g uide 139 chapter 4: maintain the device registry tar’s device registry is used by the global administrator to view information about devices connected to the tar unit, synch...
Page 152
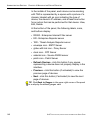
A dministration s ection c hapter 4: m aintain the d evice r egistry 140 8 e 6 t echnologies , t hreat a nalysis r eporter u ser g uide in the middle of the panel, each device communicating with tar is represented by a square with a picture of a chassis, labeled with an icon indicating the type of d...
Page 153: R3000 Device Maintenance
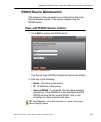
A dministration s ection c hapter 4: m aintain the d evice r egistry 8 e 6 t echnologies , t hreat a nalysis r eporter u ser g uide 141 r3000 device maintenance the actions in this sub-section are initiated from the main device registry panel, in the square representing the r3000 device. View, edit ...
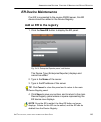
Page 154: Add An R3000 to The Registry
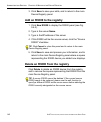
A dministration s ection c hapter 4: m aintain the d evice r egistry 142 8 e 6 t echnologies , t hreat a nalysis r eporter u ser g uide 3. Click save to save your edits, and to return to the main device registry panel. Add an r3000 to the registry 1. Click new r3000 to display the r3000 panel (see f...
Page 155
A dministration s ection c hapter 4: m aintain the d evice r egistry 8 e 6 t echnologies , t hreat a nalysis r eporter u ser g uide 143 threat analysis reporter maintenance the actions in this sub-section are initiated from the main device registry panel, in the square representing the tar device th...
Page 156
A dministration s ection c hapter 4: m aintain the d evice r egistry 144 8 e 6 t echnologies , t hreat a nalysis r eporter u ser g uide 2. For bandwidth criteria: • to add a bandwidth ip address range: a. Type in the bandwidth ip address. B. Type in the bandwidth netmask. C. Click [+] add range to a...
Page 157: Er Device Maintenance
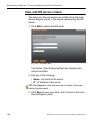
A dministration s ection c hapter 4: m aintain the d evice r egistry 8 e 6 t echnologies , t hreat a nalysis r eporter u ser g uide 145 er device maintenance if an er is connected to the source r3000 server, this er device should be added in the device registry. Add an er to the registry 1. Click th...
Page 158
A dministration s ection c hapter 4: m aintain the d evice r egistry 146 8 e 6 t echnologies , t hreat a nalysis r eporter u ser g uide view, edit er device criteria the actions in this sub-section are initiated from the main device registry panel, in the square representing the er device. 1. Click ...
Page 159: Delete Er Device
A dministration s ection c hapter 4: m aintain the d evice r egistry 8 e 6 t echnologies , t hreat a nalysis r eporter u ser g uide 147 delete er device the actions in this sub-section are initiated from the main device registry panel, in the square representing the er device. Click delete to delete...
Page 160
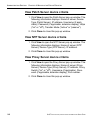
A dministration s ection c hapter 4: m aintain the d evice r egistry 148 8 e 6 t echnologies , t hreat a nalysis r eporter u ser g uide view patch server device criteria 1. Click view to open the patch server pop-up window. The following information displays: name of server, device type (patch serve...
Page 161: Sync All Devices
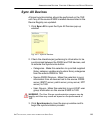
A dministration s ection c hapter 4: m aintain the d evice r egistry 8 e 6 t echnologies , t hreat a nalysis r eporter u ser g uide 149 sync all devices a forced synchronization should be performed on the tar unit if any of the source r3000’s related devices listed in the device registry are updated...
Page 162
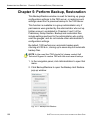
A dministration s ection c hapter 5: p erform b ackup , r estoration 150 8 e 6 t echnologies , t hreat a nalysis r eporter u ser g uide chapter 5: perform backup, restoration this backup/restore window is used for backing up gauge configuration settings to the tar server, or restoring such settings ...
Page 163
A dministration s ection c hapter 5: p erform b ackup , r estoration 8 e 6 t echnologies , t hreat a nalysis r eporter u ser g uide 151 this window is comprised of the backup user configura- tion frame and the restore user configuration frame. In the restore user configuration frame, the restoration...
Page 164: Execute A Backup On Demand
A dministration s ection c hapter 5: p erform b ackup , r estoration 152 8 e 6 t echnologies , t hreat a nalysis r eporter u ser g uide execute a backup on demand on demand backups ensure user settings saved in these files are retained on the server indefinitely. 1. In the backup on demand section o...
Page 165: Restore User Settings
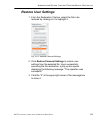
A dministration s ection c hapter 5: p erform b ackup , r estoration 8 e 6 t echnologies , t hreat a nalysis r eporter u ser g uide 153 restore user settings 1. From the restoration file box, select the file to be restored by clicking on it to highlight it: fig. 5:5-3 restore personal settings 2. Cl...
Page 166
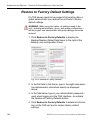
A dministration s ection c hapter 5: p erform b ackup , r estoration 154 8 e 6 t echnologies , t hreat a nalysis r eporter u ser g uide restore to factory default settings if a tar server needs to be purged of all existing data, a global administrator can restore the unit back to factory default set...
Page 167
A dministration s ection c hapter 6: i nstall s oftware u pdates 8 e 6 t echnologies , t hreat a nalysis r eporter u ser g uide 155 chapter 6: install software updates this chapter explains how the global administrator installs software updates on the tar server. By default, the tar server waits to ...
Page 168: Apply A Software Update
A dministration s ection c hapter 6: i nstall s oftware u pdates 156 8 e 6 t echnologies , t hreat a nalysis r eporter u ser g uide this window displays any available software updates in the table at the top of the install new patches tab. Any updates previously applied display in the patch history ...
Page 169
A dministration s ection c hapter 6: i nstall s oftware u pdates 8 e 6 t echnologies , t hreat a nalysis r eporter u ser g uide 157 4. Click apply to open a dialog box confirming that you wish to apply the software release: fig. 5:6-3 apply dialog box 5. Click yes to close the dialog box and to begi...
Page 170
A dministration s ection c hapter 6: i nstall s oftware u pdates 158 8 e 6 t echnologies , t hreat a nalysis r eporter u ser g uide fig. 5:6-4 software update, patch history 2. Click undo. 3. Launch a new browser window. 4. Clear the browser’s cache. 5. Log back in to tar using the login window..
Page 171
A dministration s ection c hapter 6: i nstall s oftware u pdates 8 e 6 t echnologies , t hreat a nalysis r eporter u ser g uide 159 view software installation details to view information about the software installation: 1. Click the view software update log tab to display infor- mation about the sof...
Page 172
A dministration s ection c hapter 7: v iew h ard d isk s tatus 160 8 e 6 t echnologies , t hreat a nalysis r eporter u ser g uide chapter 7: view hard disk status this chapter explains how the global administrator views the hard disk status on a tar-sl, tar-hl, or tar-h server with raid. 1. In the n...
Page 173
A dministration s ection c hapter 7: v iew h ard d isk s tatus 8 e 6 t echnologies , t hreat a nalysis r eporter u ser g uide 161 the rebuild button displays at the bottom of the window in place of the status message: fig. 5:6-7 hardware detector, hard disk failure see appendix c: raid maintenance f...
Page 174: Echnical
T echnical s upport / p roduct w arranties t echnical s upport 162 8 e 6 t echnologies , t hreat a nalysis r eporter u ser g uide t echnical s upport / p roduct w arranties technical support for technical support, visit 8e6 technologies’s technical support web page at http://www.8e6.Com/support.Html...
Page 175: 8E6 Taiwan
T echnical s upport / p roduct w arranties t echnical s upport 8 e 6 t echnologies , t hreat a nalysis r eporter u ser g uide 163 office locations and phone numbers 8e6 corporate headquarters (usa) 828 west taft avenue orange, ca 92865-4232 usa local : 714.282.6111 fax : 714.282.6116 domestic us : 1...
Page 176: Support Procedures
T echnical s upport / p roduct w arranties t echnical s upport 164 8 e 6 t echnologies , t hreat a nalysis r eporter u ser g uide support procedures when you contact our technical support department: • you will be greeted by a technical professional who will request the details of the problem and at...
Page 177: Product Warranties
T echnical s upport / p roduct w arranties p roduct w arranties 8 e 6 t echnologies , t hreat a nalysis r eporter u ser g uide 165 product warranties standard warranty 8e6 technologies warrants the medium on which the 8e6 product is provided to be free from defects in material and workmanship under ...
Page 178
T echnical s upport / p roduct w arranties p roduct w arranties 166 8 e 6 t echnologies , t hreat a nalysis r eporter u ser g uide technical support and service 8e6 technologies will provide initial installation support and technical support for up to 90 days following installation. 8e6 technologies...
Page 179: Extended Warranty (Optional)
T echnical s upport / p roduct w arranties p roduct w arranties 8 e 6 t echnologies , t hreat a nalysis r eporter u ser g uide 167 extended warranty (optional) the extended warranty applies to hardware and software of the product(s) except any misuse or modification of the product(s), or product(s) ...
Page 180: Ppendices
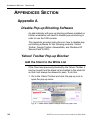
A ppendices s ection a ppendix a 168 8 e 6 t echnologies , t hreat a nalysis r eporter u ser g uide a ppendices s ection appendix a disable pop-up blocking software an administrator with pop-up blocking software installed on his/her workstation will need to disable pop-up blocking in order to use th...
Page 181
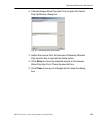
A ppendices s ection a ppendix a 8 e 6 t echnologies , t hreat a nalysis r eporter u ser g uide 169 2. Choose always allow pop-ups from to open the yahoo! Pop-up blocker dialog box: fig. A-2 allow pop-ups from source 3. Select the source from the sources of recently blocked pop-ups list box to activ...
Page 182
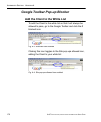
A ppendices s ection a ppendix a 170 8 e 6 t echnologies , t hreat a nalysis r eporter u ser g uide google toolbar pop-up blocker add the client to the white list to add the client to the white list so that it will always be allowed to pass, go to the google toolbar and click the # blocked icon: fig...
Page 183: Adwaresafe Pop-Up Blocker
A ppendices s ection a ppendix a 8 e 6 t echnologies , t hreat a nalysis r eporter u ser g uide 171 adwaresafe pop-up blocker disable pop-up blocking adwaresafe’s searchsafe toolbar lets you toggle between enabling pop-up blocking (# popups blocked) and disabling pop-up blocking (popup protection of...
Page 184: Set Up Pop-Up Blocking
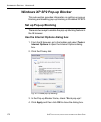
A ppendices s ection a ppendix a 172 8 e 6 t echnologies , t hreat a nalysis r eporter u ser g uide windows xp sp2 pop-up blocker this sub-section provides information on setting up pop-up blocking and disabling pop-up blocking in windows xp sp2. Set up pop-up blocking there are two ways to enable t...
Page 185: Use The Ie Toolbar
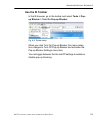
A ppendices s ection a ppendix a 8 e 6 t echnologies , t hreat a nalysis r eporter u ser g uide 173 use the ie toolbar in the ie browser, go to the toolbar and select tools > pop- up blocker > turn on pop-up blocker: fig. A-6 toolbar setup when you click turn on pop-up blocker, this menu selec- tion...
Page 186: Use The Ie Toolbar
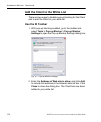
A ppendices s ection a ppendix a 174 8 e 6 t echnologies , t hreat a nalysis r eporter u ser g uide add the client to the white list there are two ways to disable pop-up blocking for the client and to add the client to your white list. Use the ie toolbar 1. With pop-up blocking enabled, go to the to...
Page 187: Use The Information Bar
A ppendices s ection a ppendix a 8 e 6 t echnologies , t hreat a nalysis r eporter u ser g uide 175 use the information bar with pop-up blocking enabled, the information bar can be set up and used for viewing information about blocked pop- ups or allowing pop-ups from a specified site. Set up the in...
Page 188
A ppendices s ection a ppendix a 176 8 e 6 t echnologies , t hreat a nalysis r eporter u ser g uide 3. Click yes to add the client to your white list and to close the dialog box. Note: to view your white list, go to the pop-up blocker settings dialog box (see fig. A-7) and see the entries in the all...
Page 189: Appendix B
A ppendices s ection a ppendix b 8 e 6 t echnologies , t hreat a nalysis r eporter u ser g uide 177 appendix b system tray alerts: setup, usage this appendix explains how to set up and use the feature for system tray alerts. A tar alert is triggered in an adminis- trator’s system tray if an end user...
Page 190
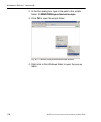
A ppendices s ection a ppendix b 178 8 e 6 t echnologies , t hreat a nalysis r eporter u ser g uide 2. In the run dialog box, type in the path to the scripts folder: c:\windows\sysvol\domain\scripts. 3. Click ok to open the scripts folder: fig. B-2 c:\windows\sysvol\domain\scripts window 4. Right-cl...
Page 191
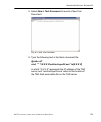
A ppendices s ection a ppendix b 8 e 6 t echnologies , t hreat a nalysis r eporter u ser g uide 179 5. Select new > text document to launch a new text document: fig. B-3 new text document 6. Type the following text in the blank document file: @echo off start “” “\\x.X.X.X\win\tartrayw32.Exe” ta[x.X....
Page 192
A ppendices s ection a ppendix b 180 8 e 6 t echnologies , t hreat a nalysis r eporter u ser g uide 7. Go to: file > save as to open the save as window: fig. B-4 save as dialog box 8. In the file name field, type in the name for the file using the “filename.Bat” format. For example: tartray21.Bat. N...
Page 193
A ppendices s ection a ppendix b 8 e 6 t echnologies , t hreat a nalysis r eporter u ser g uide 181 assign system tray logon script to administrators with the “.Bat” file created, the administrator with permis- sions on the ldap server can now begin to assign the system tray logon script to as many ...
Page 194
A ppendices s ection a ppendix b 182 8 e 6 t echnologies , t hreat a nalysis r eporter u ser g uide fig. B-5 properties dialog box, active directory users folder 3. In the properties dialog box, click the profile tab to display its contents. 4. In the login script field, type in the “.Bat” filename....
Page 195
A ppendices s ection a ppendix b 8 e 6 t echnologies , t hreat a nalysis r eporter u ser g uide 183 administrator usage of system tray once the system tray logon script has been added to the administrator’s profile, when the administrator logs on his/ her workstation, the tar alert icon (pictured to...
Page 196: Status of The Tar Alert Icon
A ppendices s ection a ppendix b 184 8 e 6 t echnologies , t hreat a nalysis r eporter u ser g uide status of the tar alert icon if there are no alerts for any gauges set up by the adminis- trator, the following message displays when mousing over the standard tar alert icon: “connected. No alerts.” ...
Page 197
A ppendices s ection a ppendix b 8 e 6 t echnologies , t hreat a nalysis r eporter u ser g uide 185 view system tray alert messages 1. Double-click the yellow tar alert icon to open the tar alert box: fig. B-6 tar alert this box contains the following message: “user (user- name/ip address) has trigg...
Page 198: Appendix C
A ppendices s ection a ppendix c 186 8 e 6 t echnologies , t hreat a nalysis r eporter u ser g uide appendix c raid maintenance this appendix pertains to tar “h”, “sl”, and “hl” servers and is divided into three parts: hardware components, server interface, and troubleshooting—in the event of a fail...
Page 199: Part 2: Server Interface
A ppendices s ection a ppendix c 8 e 6 t echnologies , t hreat a nalysis r eporter u ser g uide 187 part 2: server interface led indicators in sl and hl units on an “sl” and “hl” unit, the following led indicators for software and hardware status monitoring display on the left side of the front pane...
Page 200
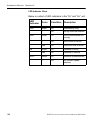
A ppendices s ection a ppendix c 188 8 e 6 t echnologies , t hreat a nalysis r eporter u ser g uide led indicator chart below is a chart of led indicators in the “sl” and “hl” unit: led indicator color condition description log green on downloading a log -- off no log download detected raid green on...
Page 201
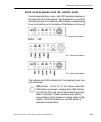
A ppendices s ection a ppendix c 8 e 6 t echnologies , t hreat a nalysis r eporter u ser g uide 189 front control panels on h, sl, and hl units control panel buttons, icons, and led indicators display on the right side of the front panel. The buttons let you perform a function on the unit, while an ...
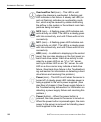
Page 202
A ppendices s ection a ppendix c 190 8 e 6 t echnologies , t hreat a nalysis r eporter u ser g uide overheat/fan fail (icon) – this led is unlit unless the chassis is overheated. A flashing red led indicates a fan failure. A steady red led (on and not flashing) indicates an overheating condi- tion, ...
Page 203
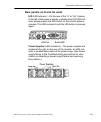
A ppendices s ection a ppendix c 8 e 6 t echnologies , t hreat a nalysis r eporter u ser g uide 191 rear panels on h and hl units uid (led indicator) – on the rear of the “h” or “hl” chassis, to the left of the power supplies, a steady blue uid led indi- cator displays when the uid button on the con...
Page 204: Part 3: Troubleshooting
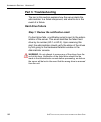
A ppendices s ection a ppendix c 192 8 e 6 t echnologies , t hreat a nalysis r eporter u ser g uide part 3: troubleshooting the text in this section explains how the server alerts the administrator to a failed component, and what to do in the event of a failure. Hard drive failure step 1: review the...
Page 205
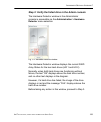
A ppendices s ection a ppendix c 8 e 6 t echnologies , t hreat a nalysis r eporter u ser g uide 193 step 2: verify the failed drive in the admin console the hardware detector window in the administrator console is accessible via the administration > hardware detector menu selection: fig. C-2 hardwar...
Page 206
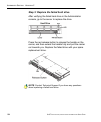
A ppendices s ection a ppendix c 194 8 e 6 t echnologies , t hreat a nalysis r eporter u ser g uide step 3: replace the failed hard drive after verifying the failed hard drive in the administrator console, go to the server to replace the drive. Press the red release button to release the handle on t...
Page 207
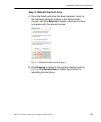
A ppendices s ection a ppendix c 8 e 6 t echnologies , t hreat a nalysis r eporter u ser g uide 195 step 4: rebuild the hard drive a. Once the failed hard drive has been replaced, return to the hardware detector window in the administrator console, and click rebuild to display instructions on how to...
Page 208
A ppendices s ection a ppendix c 196 8 e 6 t echnologies , t hreat a nalysis r eporter u ser g uide fig. C-4 hardware detector window, step 3 c. Return to the chassis. Push the power button in and hold it down for five seconds, and then release it to reboot the unit. D. Log back into the administrat...
Page 209
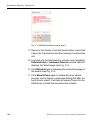
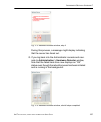
A ppendices s ection a ppendix c 8 e 6 t echnologies , t hreat a nalysis r eporter u ser g uide 197 fig. C-5 hardware detector window, step 4 during this process, a message might display indicating that the server has timed out. G. If you log back into the administrator console and navi- gate to adm...
Page 210: Power Supply Failure
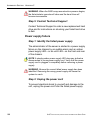
A ppendices s ection a ppendix c 198 8 e 6 t echnologies , t hreat a nalysis r eporter u ser g uide warning: when the raid array reconstruction process begins, the administrator console will close and the hard drive will become inaccessible. Step 5: contact technical support contact technical suppor...
Page 211
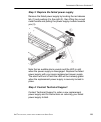
A ppendices s ection a ppendix c 8 e 6 t echnologies , t hreat a nalysis r eporter u ser g uide 199 step 3: replace the failed power supply remove the failed power supply by locating the red release tab (1) and pushing it to the right (2), then lifting the curved metal handle and pulling the power s...
Page 212: Fan Failure
A ppendices s ection a ppendix c 200 8 e 6 t echnologies , t hreat a nalysis r eporter u ser g uide fan failure identify a fan failure a flashing red led indicates a fan failure. If this displays on your unit, contact technical support for an rma (return merchandise authorization) number and for ins...
Page 213: Appendix D
A ppendices s ection a ppendix d 8 e 6 t echnologies , t hreat a nalysis r eporter u ser g uide 201 appendix d glossary this glossary includes definitions for terminology used in this user guide. Base group - a user group consisting of end users whose network activities are monitored by the designat...
Page 214
A ppendices s ection a ppendix d 202 8 e 6 t echnologies , t hreat a nalysis r eporter u ser g uide ldap - one of two authentication method protocols that can be used with tar. Lightweight directory access protocol (ldap) is a directory service protocol based on entries (distinguished names). The ot...
Page 215
A ppendices s ection a ppendix d 8 e 6 t echnologies , t hreat a nalysis r eporter u ser g uide 203 udp - an abbreviation for user data protocol, one of the core protocols of the internet protocol suite. Using udp, programs on networked computers can send short messages (sometimes known as datagrams...
Page 216
A ppendices s ection a ppendix d 204 8 e 6 t echnologies , t hreat a nalysis r eporter u ser g uide.
Page 217: Ndex
8 e 6 t echnologies , t hreat a nalysis r eporter u ser g uide 205 i ndex a alert log 91 alert messages 83 b backup 150 bandwidth 34 gauge 60 gauge monitoring 104 reading gauges 61 traffic monitoring 104 base group 21 , 57 definition 201 button, terminology 4 byte score 62 , 111 , 123 c checkbox, te...
Page 218
I ndex 206 8 e 6 t echnologies , t hreat a nalysis r eporter u ser g uide f field, terminology 4 firefox 7 flash plug-in 7 frame, terminology 5 ftp 106 definition 201 g gauge components 60 restore configuration settings 150 scoring methodology 50 types 60 global administrator 2 definition 201 group ...
Page 219
I ndex 8 e 6 t echnologies , t hreat a nalysis r eporter u ser g uide 207 i im 107 inbound traffic monitoring 104 install software update 155 installation prerequisite 8 instant messaging definition 201 internet explorer 7 , 10 , 171 ip group authentication method 177 ipgroup 20 j java virtual machi...
Page 220
I ndex 208 8 e 6 t echnologies , t hreat a nalysis r eporter u ser g uide m macintosh 7 master user list 132 n network requirements 8 o outbound traffic monitoring 104 p p2p 106 definition 202 panel, terminology 5 peer-to-peer definition 202 pop-up blocking, disable 168 pop-up box/window, terminolog...
Page 221
I ndex 8 e 6 t echnologies , t hreat a nalysis r eporter u ser g uide 209 raid 160 real time probe 202 recovery procedures 150 requirements environment 7 s safari 7 screen, terminology 6 search engine definition 202 search engine keyword in custom category 128 shift key 15 sl server 186 smtp 106 def...
Page 222
I ndex 210 8 e 6 t echnologies , t hreat a nalysis r eporter u ser g uide u udp 105 definition 203 url 9 , 10 category details 77 custom category 128 dashboard gauge method 58 lock out user from bandwidth usage 117 lock out users from access 79 , 86 , 92 trend reports 95 trend reports for bandwidth ...

