- DL manuals
- A&D
- Software
- Doctor Pro TM-2430-13
- Instruction Manual
A&D Doctor Pro TM-2430-13 Instruction Manual
Summary of Doctor Pro TM-2430-13
Page 1
Tm-2430-13 (doctor pro) ambulatory blood pressure monitor data analysis software instruction manual wm:pd4000019c.
Page 2: Contents
1 contents 1. Introduction .........................................................................................................3 1-1 about the data analysis software...................................................................................................3 1-2 symbols ....................
Page 3
2 2-7 recorder menu ............................................................................................................................. 31 2-7-1 retrieving data from the monitor............................................................................................... 32 2-7-2 clearing...
Page 4: 1. Introduction
3 1. Introduction 1-1 about the data analysis software welcome to the ambulatory blood pressure monitor (abpm) data analysis software. This software is intended for use with the following devices. Abpm: for diagnosing high blood pressure 1) a&d tm-2430 series ambulatory blood pressure monitor 2) a&d...
Page 5: 1-2 Symbols
4 1-2 symbols the symbols printed on the device have the following meaning: ce marking sn serial number 1-3 monitoring device review the following section briefly reviews the devices and how they may be used with this software. A&d ambulatory blood pressure monitors are used to record an individual’...
Page 6: 1-5 System Requirements
5 1-4 software package components items included in your complete software package are: ♦ abpm 3.5-inch program disk ♦ ambulatory blood pressure monitor data analysis software instruction manual ♦ for tm-2420/tm-2421 ax-ko600 (9 pin d-sub, socket type), communication cable for tm-2420/tm-2421 ♦ for ...
Page 7: 2. Operating Procedure
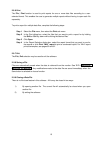
6 2. Operating procedure 2-1 getting started two initial actions may be executed when starting up the software: (1) data may be retrieved from the monitor. (2) stored data files may be opened and viewed for analysis. To retrieve data from the monitor, see: ♦ “2-2 communication between the monitor an...
Page 8
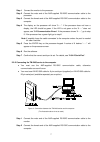
7 step 1 connect the monitor to the processor. Step 2 connect the male end of the a&d-supplied rs-232c communication cable to the processor. Step 3 connect the female end of the a&d-supplied rs-232c communication cable to the computer. Step 4 the display on the processor will show “0-----”. If the p...
Page 9
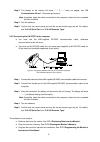
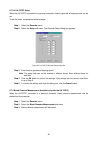
8 step 3 the display on the monitor will show “----”. If “----” does not appear, see “3-2 communication errors”. Otherwise go to step 4. Note: if possible, keep the cable connected to the computer unless the port is needed for other functions. Step 4 run the software. Step 5 confirm that the correct...
Page 10: 2-3 Main Screen Description
9 2-3 main screen description the main screen is comprised of six menus and two toolbar buttons located permanently along the top of the screen. These menus may be used to access the various features of the software. The toolbar buttons may be used to set partial analysis and blood pressure mode par...
Page 11: 2-4 Toolbar
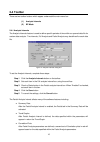
10 2-4 toolbar there are two toolbar buttons which appear underneath the main menu bar: (1) analysis intervals (2) bp mode 2-4-1 analysis intervals the analysis intervals feature is used to define specific periods of time within an opened data file for custom data analysis. Two intervals, full analy...
Page 12
11 ♦ histograms after partial analysis parameters are defined, the data specified within the parameters will appear in red overlaying the full analysis data. 2-4-2 bp mode the bp mode is used to select which blood pressure method will be used as the primary and secondary choices for displaying the b...
Page 13: 2-5 File Menu
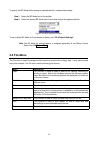
12 to specify the bp mode while viewing an opened data file, complete these steps: step 1 select the bp mode box on the toolbar. Step 2 select the desired bp mode used to view and analyze the opened data file. Figure 5: bp mode selection on toolbar to set a default bp mode for the software at startu...
Page 17: 2-6 View Menu
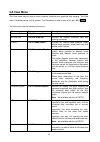
16 2-6 view menu the view menu may be used to view numerical, statistical and graphical data screens. The view menu is disabled unless a file is opened. For information on how to open a file, see “2-5-1 open”. The view menu has the following sub-menus: menu see description summary data “2-6-1 summar...
Page 18
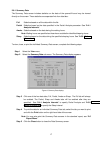
17 2-6-1 summary data the summary data screen includes statistics on the data of the opened file and may be viewed directly on the screen. These statistics are separated into four data tabs: full statistics based on all the data within the file. Partial statistics based on the data specified in the ...
Page 19
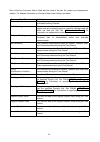
18 each of the four summary data is titled with the name of the tab, file, patient and measurement method. For detailed information on summary data screen listings, see below: summary data tab definition time interval the analysis period, start time/date – end time/date, for the activated summary da...
Page 20
19 2-6-2 bp data list the bp data list function displays individual blood pressure measurement within an open data file in tabular form. With the bp data list, you may input measurement comments, exclude/include a measurement within the graphics and statistics or link a measurement to the beginning ...
Page 21
20 figure 9: blood pressure data list display 2-6-2-1 excluding/including bp measurements it is useful to exclude a measurement from the blood pressure data list in cases where the measurement is clearly incorrect. The software provides a simple way to include or exclude measurements while viewing a...
Page 22
21 2-6-2-3 linking to trends screen a measurement may be linked to the trend graph by highlighting an individual measurement and then closing the blood pressure data list. When opened, the trends screen will be aligned with the time of the highlighted measurement in the blood pressure data list. Thi...
Page 23
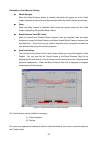
22 delimitation, scroll bar and linking ♦ ♦ ♦ ♦ partial analysis: when the partial analysis feature is enabled, red bands will appear on all the trend graphs highlighting the period and data specified within the partial analysis parameters. ♦ ♦ ♦ ♦ sleep: when the sleep interval is identified, black...
Page 24
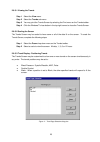
23 2-6-3-1 viewing the trends step 1 select the view menu. Step 2 select the trends sub-menu. Step 3 you may print the trends screen by selecting the print menu on the trends toolbar. Step 4 click the windows™ close button in the top right corner to close the trends screen. 2-6-3-2 scaling the scree...
Page 25
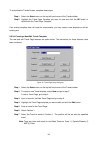
24 to customize the trends screen, complete these steps: step 1 select the select menu on the top left hand corner of the trends toolbar. Step 2 highlight the trend page template you want to view and click the ok button or double click the trend page template. If an existing template does not meet t...
Page 26
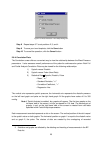
25 figure 13: blood pressure trend setup dialog box step 8 repeat steps 6-7 to set positions 2, 3, and 4. Step 9 to save your trend template, click the save button step 10 to cancel the operation, click the cancel button . 2-6-4 correlation plots the correlation screen offers a convenient way to vie...
Page 27
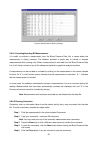
26 measurements. Measurement statistics, mean " m ", standard deviation " s’ " and correlation coefficient “ r ” values are shown on the bottom of the screen. Figure 14: correlation plots display.
Page 28
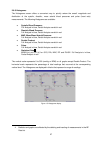
27 2-6-5 histograms the histograms screen offers a convenient way to quickly review the overall magnitude and distribution of the systolic, diastolic, mean arterial blood pressures and pulse (heart rate) measurements. The following histograms are available: ♦ systolic blood pressure: full analysis i...
Page 29
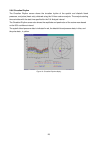
28 2-6-6 circadian rhythm the circadian rhythm screen shows the circadian rhythm of the systolic and diastolic blood pressures, and pulse (heart rate); obtained using the 24-hour cosinor analysis. The analysis starting time coincides with the start time specified for the full analysis interval. The ...
Page 30
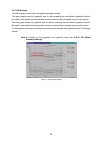
29 2-6-7 hib analysis the hib analysis screen shows two graphs arranged vertically. The upper graph shows the hyperbalic area (in red) exceeding the user-defined hyperbalic limits for the systolic and diastolic blood pressures, and the numerical data converted into a one-day period. The lower graph ...
Page 31
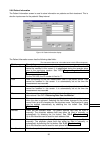
30 2-6-8 patient information the patient information screen is used to store information on patients and their treatment. This is also the input screen for the patient’s sleep interval. Figure 18: patient information display the patient information screen has the following data fields: (the characte...
Page 32: 2-7 Recorder Menu
31 field description insurance field for the patient’s insurance information. Up to 20 characters can be used. Medicare # field for the patient’s medicare or medicaid number or other health care number. Up to 20 characters can be used. Medications field for the patient’s medications. Up to 60 charac...
Page 33
32 2-7-1 retrieving data from the monitor figure 19: recorder-retrieve data dialog box see below for the description of each field on the recorder-retrieved data dialog box. Field description recorder id recorder id is set in the monitor’s memory prior to the monitoring session. Start date date of f...
Page 34
33 step 7 click the ok button. Note: to view a retrieved file, you must open it. 2-7-2 clearing the monitor’s memory the monitor’s memory should be cleared before each monitoring session. With the monitor and the processor connected to the computer, you may clear the measurement data stored in the m...
Page 35
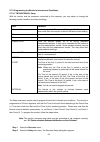
34 2-7-3 programming the monitor’s intervals and conditions 2-7-3-1 tm-2420/tm-2421 setup with the monitor and the processor connected to the computer, you may setup or change the following monitor condition and interval settings: item definition recorder id number monitor (or patient) id number (01...
Page 36
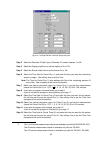
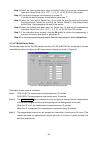
35 figure 21: tm-2420/tm-2421 recorder setup dialog box step 3 select the recorder id field. Input a recorder id number between 1 to 99. Step 4 select the display check box to set the display to on or off. Step 5 select the buzzer check box to set the buzzer on or off. Step 6 select the time field f...
Page 37
36 step 13 select the interval drop-down menu for period three (3) and set the measurement interval for period three (3) to: off, 1, 3, 5, 10, 15, 20 , 30, 60 or 120 minutes. Step 14 if you want to program a fourth period, go to step 15. If you do not want to program a fourth period, go to step 17. ...
Page 38
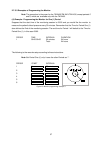
37 2-7-3-3 examples of programming the monitor note: the procedure is the same for the tm-2420/tm-2421/tm-2430, except periods 5 and 6, which are available only with the tm-2430. (a) example: programming the monitor for one (1) period suppose that the start time of the monitoring session is 09:00 an...
Page 39
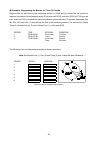
38 (b) example: programming the monitor for three (3) periods suppose that the start time of the monitoring session is 09:00 and you would like the monitor to measure the patient's blood pressure every 30 minutes until 22:00, and from 22:00 to 07:00 once an hour, and from 07:00 you would like the bl...
Page 40
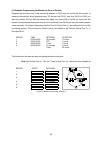
39 (c) example: programming the monitor for four (4) periods suppose that the start time of the monitoring session is 09:00 and you would like the monitor to measure the patient's blood pressure every 30 minutes until 22:00, and from 22:00 to 23:00 you want the monitor off so that the patient may sl...
Page 41
40 2-7-3-4 ua-767pc setup when the ua-767pc connected to a personal computer, times to generate a beeping sound can be set. To set the times, complete the following steps: step 1 select the recorder menu. Step 2 select the setup sub-menu. The recorder setup dialog box appears. Figure 26: ua-767pc re...
Page 42: 2-8 Report Menu
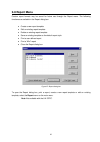
41 2-8 report menu custom report formats may be saved for future use through the report menu. The following functions are available in the report dialog box: ♦ create a new report template ♦ edit an existing report template ♦ delete an existing report template ♦ save an existing template as the defa...
Page 43
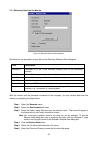
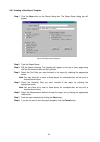
42 2-8-1 creating a new report template step 1 click the new button on the report dialog box. The report setup dialog box will appear. Figure 28: report setup dialog box step 2 type the report name. Step 3 edit the report heading. This heading will appear on the top of every page along with the file...
Page 44
43 2-8-2 editing an existing report template step 1 highlight the report template you want to edit. Step 2 click the edit button. The report setup dialog box will appear. Step 3 edit the report name. Step 4 edit the report heading. The report heading will appear on the top of every page along with t...
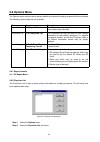
Page 45: 2-9 Options Menu
44 2-9 options menu the options menu may be used to access default and various formatting screens within the software. The following options features are available: menu see description report formats “2-8 report menu” the report formats may be used to create and save custom report formats. Physicia...
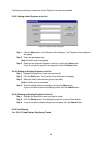
Page 46
45 the following instructions outline the various physician list features available. 2-9-2-1 adding a new physician to the list figure 30: physician entry dialog box step 1 click the new button on the physician list dialog box. The physician entry dialog box will appear. Step 2 enter the appropriate...
Page 47
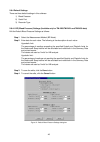
46 2-9-4 default settings there are three default settings in this software: 1) blood pressure 2) serial port 3) recorder type 2-9-4-1 bp (blood pressure) settings (available only for tm-2420/tm-2421 and tm-2430 data) edit the default blood pressure settings as follows: step 1 select the measurement...
Page 48: 2-10 On-Line Help
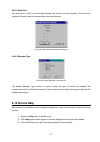
47 2-9-4-2 serial port the serial port is used to communicate between the monitor and the computer. The serial port setting and the port used for communication must be the same. Figure 32: default serial port selection dialog box 2-9-4-3 recorder type figure 33: default recorder type dialog box the ...
Page 49: 3. Troubleshooting
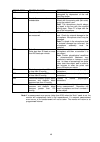
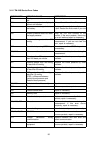
48 3. Troubleshooting 3-1 measurement errors the following tables list the error messages that may occur during a monitoring session and offer information on possible causes and corrections. Measurement errors may be shown on the blood pressure data list display and printed text data. If an error oc...
Page 50
49 error code possible cause correction e07 manual stop the measurement was manually interrupted by depression of the red start/stop button. E08 korotkoff sounds are undetectable. Check that the lower microphone is affixed with the sensing side (skin side) facing the patient’s arm. Note: the microph...
Page 51
50 3-1-2 tm-2430 series error codes error code possible cause correction e00 clock parameters have not been set. Enter clock parameters. E03 an error code is displayed without cuff inflation. Exhaust the air from the cuff completely. E04 measurement is stopped due to a low battery. Replace with new ...
Page 52: 3-2 Communication Errors
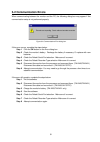
51 3-2 communication errors when communicating between the monitor and the pc, the following dialog box may appear if the communication setup is not performed properly: figure 34: communications error dialog box if this error occurs, complete the steps below: step 1 click the ok button on the error ...
Page 54: 4. Printout Examples
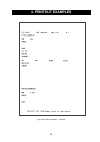
53 4. Printout examples figure 36: patient information – text data.
Page 55
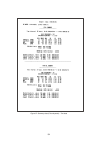
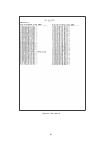
54 figure 37: summary data (full and partial) – text data.
Page 56
55 figure 38: summary data (awake and sleep) – text data.
Page 57
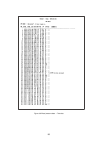
56 figure 39: blood pressure data – text data.
Page 58
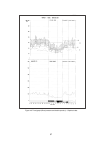
57 figure 40: trend graph (blood pressure and double product) – graphical data.
Page 59
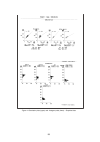
58 figure 41:correlation plots (upper) and histogram plots (lower) – graphical data.
Page 60
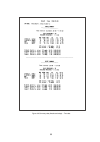
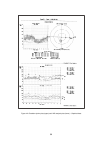
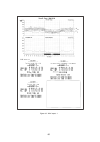
59 figure 42: circadian rhythm plots (upper) and hbi analysis plots (lower) – graphical data.
Page 61
60 figure 43: “mini” report -1.
Page 62
61 figure 44: “mini” report -2.
Page 63: 5. Terms/abbreviations
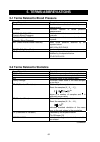
62 5. Terms/abbreviations 5-1 terms related to blood pressure term/abbreviation description oscillometric oscillometric method of blood pressure measurement. Korotkoff korotkoff method of blood pressure measurement. Systolic, sys, sbp (systolic blood pressure) blood pressure that occurs when the hea...
Page 64
63 term/abbreviation description correlation: r (coefficient of correlation) indicates the degree of linear relationship between two variables. It ranges from +1 to -1. A correlation of +1 means that there is a perfect positive linear relationship between variables. Sys – dia in the plotted 24-hour ...
Page 65
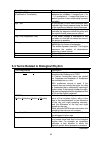
64 term/abbreviation description c.I., confidence interval interval surrounded by the confidence limit of 95%. 95% confidence interval is expressed in numerical data with the cosinor analysis graph. Pr (percent rhythm) rhythm compatibility squared multiple correlation coefficient (r) between the mea...
Page 66
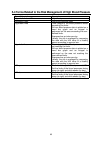
65 5-4 terms related to the risk management of high blood pressure term/abbreviation description hyperbalic index, hbi high blood pressure index hypobalic index low blood pressure index hyperbalic area time integral of the blood pressure values exceeding the limits. 24-hour blood pressure data is pl...
Page 67
66 memo.
Page 68
67 memo.
Page 69
68 memo.


