- DL manuals
- ABB
- Controller
- 800xA
- Operation
ABB 800xA Operation - Link
Section 3 Condition Reporting and Monitoring
Condition Details, Asset Monitor Status, and
3BUA000150-600
37
Condition Details, Asset Monitor Status, and Diagnostics
Link
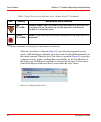
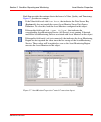
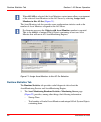
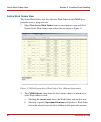
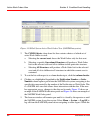
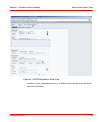
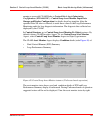
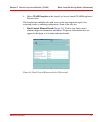
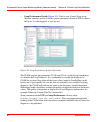
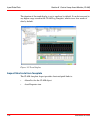
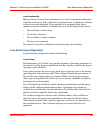
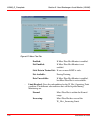
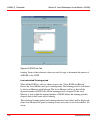
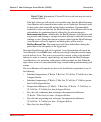
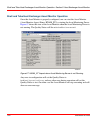
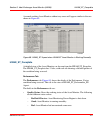
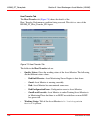
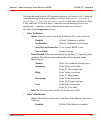
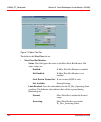
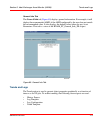
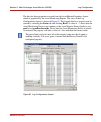
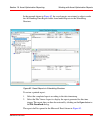
The Condition Details view provides more information about the selected condition
in the Asset Reporter. This view also provides the overall Asset Monitor Status text.
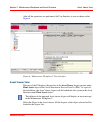
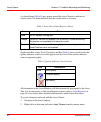
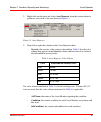
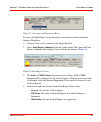
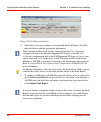
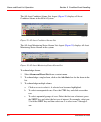
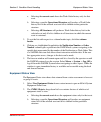
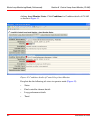
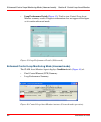
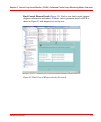
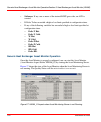
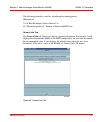
Select Condition Details: to produce the Condition Details view such
as the one shown in
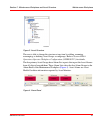
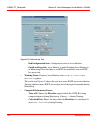
In the new Maintenance Workplace 2, the Condition Details view looks as shown in
.
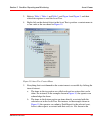
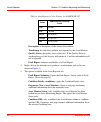
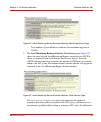
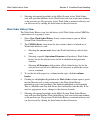
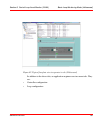
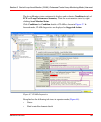
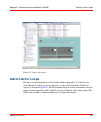
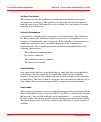
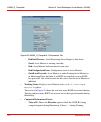
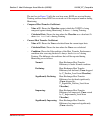
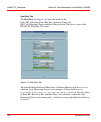
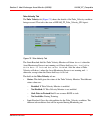
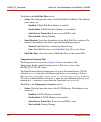
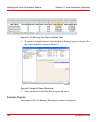
Select Asset Monitor Status to produce the Asset Monitor Status view such as the
one shown in
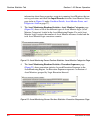
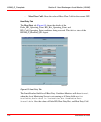
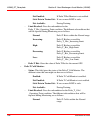
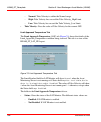
The Input Records tab in the Asset Monitor Status page (
) provides an
overview of all the OPC items used by the selected Asset Monitor. This view is of
particular interest when troubleshooting communication problems with the OPC
server or servers.
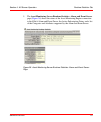
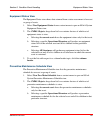
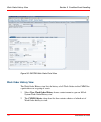
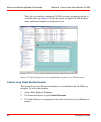
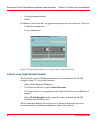
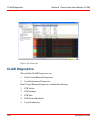
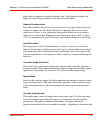
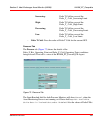
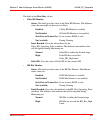
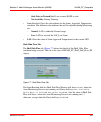
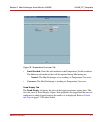
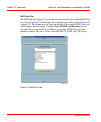
Some Asset Monitors are configured to expose an additional Diagnostics menu
entry in the Asset Reporter and Asset Monitor Conditions view.
This view is generated using the current state of the Asset Monitor in the Asset
Monitoring Engine. The engine must be running for this view to be available.
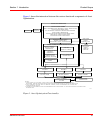
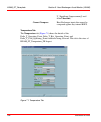
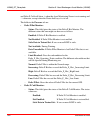
TC04726D
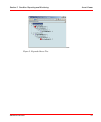
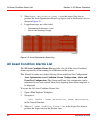
Figure 12. Condition Details
Summary of 800xA
Page 1
Power and productivity for a better world tm system 800xa asset optimization operation system version 6.0
Page 3: Operation
System 800xa asset optimization operation system version 6.0
Page 4
Notice this document contains information about one or more abb products and may include a description of or a reference to one or more standards that may be generally relevant to the abb products. The presence of any such description of a standard or reference to a standard is not a representation ...
Page 5: Table of Contents
3bua000150-600 5 table of contents about this user manual general ..............................................................................................................................9 user manual conventions .....................................................................................
Page 6
Table of contents 6 3bua000150-600 introduction ..................................................................................................................... 27 asset viewer.................................................................................................................... 27...
Page 7
Table of contents 3bua000150-600 7 3bua000150-600 7 preventive maintenance schedule view ..............................................................72 section 6 - web-enabled views operation .............................................................................................................
Page 8
Table of contents 8 3bua000150-600 hxam_g_faceplate ......................................................................................... 121 trends and logs................................................................................................. 138 history source .........................
Page 9: About This User Manual
3bua000150-600 9 about this user manual general this user manual describes operational activities for asset optimization asset monitoring, maximo integration, sap/plant management (sap/pm) integration, calibration integration as an engineered solution, control loop asset monitor (clam), generic (hxa...
Page 10
Warning, caution, information, and tip icons about this user manual 10 3bua000150-600 feature pack functionality feature pack functionality included in an existing table is indicated using a table footnote ( * ) : * feature pack functionality unless noted, all other information in this user manual a...
Page 11: Terminology
About this user manual documentation of third party software 3bua000150-600 11 documentation of third party software this user manual describes third party software to the extent that it applies to asset optimization. Specific information relating to the installation, setup, configuration, and opera...
Page 12
Released user manuals and release notes about this user manual 12 3bua000150-600
Page 13: Section 1 Introduction
3bua000150-600 13 section 1 introduction product overview system 800xa - asset optimization consists of system extensions to the 800xa base system. Asset optimization functionality includes asset condition reporting, asset monitoring, cmms (computerized maintenance management system) integration, an...
Page 14
Product scope section 1 introduction 14 3bua000150-600 – process asset monitors (includes control loop asset monitor (clam), heat exchanger asset monitor - shell and tube (hxam - st), and heat exchanger asset monitor - generic (hxam - g). – system status asset monitor. – hart asset monitoring. – dev...
Page 15
Section 1 introduction product scope 3bua000150-600 15 figure 1 shows the interaction between the various functional components of asset optimization. Figure 1. Asset optimization functionality t 0 5 3 2 1 a 1 a s s e t s d a t a s o u r c e a s s e t o p t im iz a t io n a s s e t m o n it o r in g...
Page 16
Product scope section 1 introduction 16 3bua000150-600
Page 17: Structure
3bua000150-600 17 section 2 maintenance workplace and asset structure introduction asset optimization information can be accessed from any workplace in the 800xa system. The maintenance workplace is a default workplace for maintenance personnel. It is a plant explorer workplace with an alarm band th...
Page 18
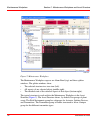
Maintenance workplace section 2 maintenance workplace and asset structure 18 3bua000150-600 the maintenance workplace exposes an alarm band (top) and three splitter windows. The splitter windows show: • the selected structure in a tree view (left). • all aspects of any selected object (middle right)...
Page 19
Section 2 maintenance workplace and asset structure maintenance workplace 3bua000150-600 19 the user is able to change the structure at any time by adding, renaming, rearranging, or deleting asset groups or subgroups. Refer to system 800xa operations operator workplace configuration (3bse030322*) fo...
Page 20: Maintenance Workplace 2
Maintenance workplace 2 section 2 maintenance workplace and asset structure 20 3bua000150-600 maintenance workplace 2 the new workplace provides an easy, enhanced and efficient way for the user to view the asset status and condition details in few clicks. The maintenance workplace 2 is based on the ...
Page 21
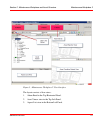
Section 2 maintenance workplace and asset structure maintenance workplace 2 3bua000150-600 21 the layout consists of four views: 1. Alarm band in the top horizontal panel. 2. Asset viewer view in the top left panel. 3. Aspect list view in the bottom left panel. Figure 5. Maintenance workplace 2 user...
Page 22
Navigation flow section 2 maintenance workplace and asset structure 22 3bua000150-600 4. Asset reporter view in the top right panel. 5. Asset condition details view in the bottom right panel. The maintenance workplace 2 uses the asset viewer aspect to navigate to the objects in the asset structure. ...
Page 23
Section 2 maintenance workplace and asset structure asset viewer view 3bua000150-600 23 after all the operations are performed, the user interface is seen as shown in the figure 6 . Asset viewer view this part of the ui displays the preview of the asset viewer aspect present under plant assets objec...
Page 24
Aspect list section 2 maintenance workplace and asset structure 24 3bua000150-600 for more information on the asset viewer, refer to asset viewer on page 27. Aspect list the aspects of the object selected in the asset viewer preview will be loaded into the content similar to the normal ppa aspect li...
Page 25: Maintenance Filter
Section 2 maintenance workplace and asset structure maintenance filter 3bua000150-600 25 maintenance filter the maintenance workplace comes with four default filters that are designed to expose only those aspects that are needed for the typical maintenance workflow. Figure 7 highlights the alarm ban...
Page 26
Maintenance filter section 2 maintenance workplace and asset structure 26 3bua000150-600
Page 27: Introduction
3bua000150-600 27 section 3 condition reporting and monitoring introduction the asset health condition reporting system provides the infrastructure that reports asset status/condition information to notify operators and maintenance personnel when an abnormal condition calls for a maintenance action....
Page 28
Asset viewer section 3 condition reporting and monitoring 28 3bua000150-600 automatically when values change. Web-enabled views require a manual refresh to update the view. The asset viewer aspect, when added to an object, allows the asset tree to be displayed. Asset tree severity indicators propaga...
Page 29
Section 3 condition reporting and monitoring asset viewer 3bua000150-600 29 high: 501 to 750 function check: asset functionality might be temporarily restricted, due to ongoing work on the asset, e.G. As local operation, maintenance, simulation, or a function check. Critical: 751 to 1000 failure: as...
Page 30
Asset viewer section 3 condition reporting and monitoring 30 3bua000150-600 when the asset tree is collapsed ( figure 8 ) it provides the propagated severity, quality, and fault report availability of an object and all of the children beneath it in the current structure. When the asset tree object i...
Page 31
Section 3 condition reporting and monitoring asset viewer 3bua000150-600 31 tc08208a figure 9. Expanded asset tree.
Page 32
Asset viewer section 3 condition reporting and monitoring 32 3bua000150-600 a colored frame ( table 3 ) may appear around the asset viewer to indicate its current status. No frame indicates that the current status is accurate. Quality has three states: good, uncertain, and bad. Table 4 shows and des...
Page 33
Section 3 condition reporting and monitoring asset viewer 3bua000150-600 33 3. Refer to table 1 , table 4 , and table 3 , and figure 8 and figure 9 , and their related descriptions to read the asset tree. 4. Right-click on the desired object in the asset tree to produce a context menu in a view such...
Page 34: Asset Reporter
Asset reporter section 3 condition reporting and monitoring 34 3bua000150-600 figure is the ability to see cmms views such as active work orders for that asset, etc. Asset reporter the asset reporter is accessible within the plant explorer workplace, operator workplace, and maintenance workplace on ...
Page 35
Section 3 condition reporting and monitoring asset reporter 3bua000150-600 35 2. Right-click on that item and select asset reporter from the context menu to produce a view such as the one shown in figure 11 . 3. From left to right, the columns in the asset reporter show: – severity: the severity of ...
Page 36
Asset reporter section 3 condition reporting and monitoring 36 3bua000150-600 – description: a description of the current subcondition. – timestamp: the time the condition was reported by the asset monitor. – quality status: the quality status of the data. If the quality status is anything but good,...
Page 37: Link
Section 3 condition reporting and monitoring condition details, asset monitor status, and 3bua000150-600 37 condition details, asset monitor status, and diagnostics link the condition details view provides more information about the selected condition in the asset reporter. This view also provides t...
Page 38: Fault Report Viewer
Fault report viewer section 3 condition reporting and monitoring 38 3bua000150-600 the diagnostics menu will open a web page containing additional information about the monitored asset. To access this view, right-click on the desired asset monitor ( figure 15 ) and select diagnostics from the contex...
Page 39
Section 3 condition reporting and monitoring fault report viewer 3bua000150-600 39 to access the fault report viewer through a context menu selection within the operator workplace: 1. Navigate to the asset of interest in the object browser. 2. Select fault report submitter from the context menu. Thi...
Page 40: Asset Monitor Properties
Asset monitor properties section 3 condition reporting and monitoring 40 3bua000150-600 – fr state: the state of the fault report at any instance in time. It can either be the current condition, or the most severe unacknowledged (msu) condition of the asset. If the alarm line corresponding to the co...
Page 41
Section 3 condition reporting and monitoring asset monitor properties 3bua000150-600 41 each item provides the runtime data in the form of a value, quality, and timestamp. Figure 17 provides an example. If the value field reads additem error , that indicates the data source key (system tab) does not...
Page 42
Asset monitor properties section 3 condition reporting and monitoring 42 3bua000150-600
Page 43: Introduction
3bua000150-600 43 section 4 ao server operation introduction this section describes operation of the ao server. It includes: • asset optimization event log . • all asset condition alarms list . • all asset monitoring status alarms list . • all asset optimization alarms list . • asset optimization se...
Page 44
All asset condition alarms list section 4 ao server operation 44 3bua000150-600 3. Select asset optimization event log in the aspect list area to produce the asset optimization event log aspect view in the preview area as shown in figure 18 . 4. Logged messages are color coded: – informational messa...
Page 45
Section 4 ao server operation all asset monitoring status alarms list 3bua000150-600 45 all asset monitoring status alarms list the all asset monitoring status alarms list provides a list of all asset monitoring alarms reported by all running asset monitors in the system. While asset condition alarm...
Page 46: Asset Optimization Server
Asset optimization server section 4 ao server operation 46 3bua000150-600 asset optimization server the asset optimization server aspect provides the main management and diagnostic interface for an ao server node. To access the asset optimization server aspect: 1. Open a plant explorer workplace. 2....
Page 47
Section 4 ao server operation asset monitors tab 3bua000150-600 47 to start/stop the assetmonitoring service associated with an ao server, enable/disable the enable check box in the ao server tab and click apply. Asset monitors tab the asset monitors tab ( figure 20 ) provides the following informat...
Page 48
Runtime statistics tab section 4 ao server operation 48 3bua000150-600 the asset monitors tab also provides some configuration statistics such as the number of asset monitors assigned to this ao server. Runtime statistics tab the runtime statistics tab provides useful diagnostic data about the asset...
Page 49
Section 4 ao server operation runtime statistics tab 3bua000150-600 49 – total number of asset monitor conditions (the maximum supported is 30,000). 2. The asset monitoring runtime statistics: data servers page ( figure 23 ) shows the status of each assetmonitoring engine connection to an opc/da ser...
Page 50
Runtime statistics tab section 4 ao server operation 50 3bua000150-600 information about these properties, navigate to running asset monitors that are not in good status and check the input records tab in the asset monitor status page (refer to figure 14 under condition details, asset monitor status...
Page 51
Section 4 ao server operation runtime statistics tab 3bua000150-600 51 5. The asset monitoring server runtime statistics: alarm and event server page ( figure 26 ) shows the status of the asset monitoring engine connection to the 800xa alarm and event server, the active subscription status, and a li...
Page 52
Runtime statistics tab section 4 ao server operation 52 3bua000150-600
Page 53: Introduction
3bua000150-600 53 section 5 condition event handling introduction asset optimization provides asset condition event handling through: • submitting fault reports . • creating and submitting fault reports . • alarm and event list operation . • cmms views for maximo integration . • cmms views for sap/p...
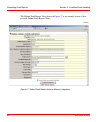
Page 54
Submitting fault reports section 5 condition event handling 54 3bua000150-600 the submit fault report view shown in figure 27 is an example of one of five possible submit fault report views tc05365c figure 27. Submit fault report view for maximo integration.
Page 55
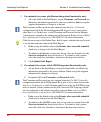
Section 5 condition event handling submitting fault reports 3bua000150-600 55 the specific view depends on which integration packages were installed. The fields and content are generated based on the requirements of the specific cmms. 1. Select submit fault report from a context menu to access a sub...
Page 56
Submitting fault reports section 5 condition event handling 56 3bua000150-600 2. For submittal to systems with maximo integration functionality only: a. All of the fields in the fault report, except username: and password: are filled in by information generated by the asset condition. Either accept ...
Page 57
Section 5 condition event handling creating and submitting fault reports 3bua000150-600 57 e. Click submit fault report. Creating and submitting fault reports the create fault report form makes it possible to create and submit a new fault report for the selected asset without an asset condition bein...
Page 58
Creating and submitting fault reports section 5 condition event handling 58 3bua000150-600 5. Since there is no asset condition associated with this fault report, the fields must be filled in with the appropriate information. 6. To submit to the maximo or sap/pm system only, do not select an action ...
Page 59
Section 5 condition event handling alarm and event list operation 3bua000150-600 59 alarm and event list operation there are two categories of alarms that are used exclusively by asset optimization: asset condition alarm: generated by an asset monitor when an abnormal asset condition is detected. An...
Page 60
Alarm and event list operation section 5 condition event handling 60 3bua000150-600 the all asset condition alarms list aspect ( figure 29 ) displays all asset condition alarms in the 800xa system. The all asset monitoring status alarms list aspect ( figure 30 ) displays all asset monitoring status ...
Page 61
Section 5 condition event handling cmms views for maximo integration 3bua000150-600 61 click and drag to select a sequence of rows. D. Either right-click on a selected row and select acknowledge from the context menu or click the green check mark at the top of the alarm and event list. Cmms views fo...
Page 62
Active work orders view section 5 condition event handling 62 3bua000150-600 active work orders view the active work orders view lists all active work orders in the cmms for a particular asset or group of assets. 1. Select view active work orders from a context menu to open an 800xa system active wo...
Page 63
Section 5 condition event handling active work orders view 3bua000150-600 63 c. Selecting all structures will produce work order list for the selected asset and all of its children in all structures in which the current asset is contained. 3. To sort the list with respect to a column header topic, c...
Page 64
Work order history view section 5 condition event handling 64 3bua000150-600 5. Selecting subsequent hyperlinks in the 800xa system active work orders view will open that maximo active work order web view in the same window as the previous one. The previous active work order is retained in history a...
Page 65
Section 5 condition event handling equipment status view 3bua000150-600 65 equipment status view the equipment status view shows data returned from a status assessment of an asset or group of assets. 1. Select view equipment status from a context menu to open an 800xa system equipment status view. 2...
Page 66
Spare parts/availability of spare parts views section 5 condition event handling 66 3bua000150-600 c. Selecting all structures will produce a preventive maintenance schedule list for the selected asset and all of its children in all structures in which the current asset is contained. 3. To sort the ...
Page 67
Section 5 condition event handling cmms views for sap/pm integration 3bua000150-600 67 5. To sort the list with respect to a column header topic, click that column header. 6. Selecting subsequent hyperlinks in the 800xa system spare parts view will open that spare part web view in the same window as...
Page 68
Active work orders view section 5 condition event handling 68 3bua000150-600 2. The cmms objects: drop-down list box contains choices of which set of active work orders to view. A. Selecting the current asset shows the work orders only for that asset. B. Selecting a specific operational structure wi...
Page 69
Section 5 condition event handling active work orders view 3bua000150-600 69 window is open, immediate history is available and accessible using the back and forward buttons. Tc08219a figure 35. Sap/pm notification portal view.
Page 70
Work order history view section 5 condition event handling 70 3bua000150-600 work order history view the work order history view lists the history of all work orders in the cmms for a particular asset or group of assets. 1. Select view work order history from a context menu to open an 800xa system w...
Page 71
Section 5 condition event handling equipment status view 3bua000150-600 71 a. Selecting the current asset shows the work order history only for that asset. B. Selecting a specific operational structure will produce a work order history list for the selected asset and all its children in that particu...
Page 72
Preventive maintenance schedule view section 5 condition event handling 72 3bua000150-600 c. Selecting all structures will produce an equipment status list for the selected asset and all of its children in all structures in which the current asset is contained. 3. To sort the list with respect to a ...
Page 73: Operation
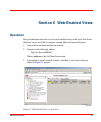
3bua000150-600 73 section 6 web-enabled views operation this procedure describes how to access web-enabled views of the asset tree from a windows-based, non-800xa computer running microsoft internet explorer. 1. Open a microsoft internet explorer window. 2. Navigate to the following address: http://...
Page 74
Operation section 6 web-enabled views 74 3bua000150-600 the functionality of the asset tree is the same as the one described under asset viewer on page 27, and all of the functionality described in this user manual is accessible through the web-enabled views. The difference is that a web-enabled vie...
Page 75: Section 7 Faceplates
3bua000150-600 75 section 7 faceplates introduction some asset monitors may expose information using faceplates. Asset monitoring faceplates include: • runtime faceplate . • generic counter check faceplate . Runtime faceplate the running time check asset monitor monitors the accumulated runtime hour...
Page 76
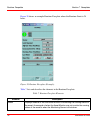
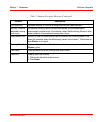
Runtime faceplate section 7 faceplates 76 3bua000150-600 figure 38 shows an example runtime faceplate where the runtime limit is 24 hours. Table 7 lists and describes the elements in the runtime faceplate. Tc05034c figure 38. Runtime faceplate (example) table 7. Runtime faceplate elements element de...
Page 77
Section 7 faceplates runtime faceplate 3bua000150-600 77 limit reached indicates whether or not the running time limit has been reached. Adj run time hrs. (adjusted running time hours) an adjusted running time hours estimate based on the percentage of unaccounted runtime hours (for instance, when th...
Page 78
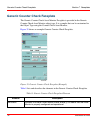
Generic counter check faceplate section 7 faceplates 78 3bua000150-600 generic counter check faceplate the generic counter check asset monitor faceplate is provided in the generic counter check asset monitor object type. It is a sample that can be customized in the object type using the counter chec...
Page 79
Section 7 faceplates generic counter check faceplate 3bua000150-600 79 counter condition indication reports the counter condition label and its current subcondition text. The text is color coded based on the condition severity. Count the current transition count of the monitored asset. Last reset da...
Page 80
Generic counter check faceplate section 7 faceplates 80 3bua000150-600
Page 81: Introduction
3bua000150-600 81 section 8 control loop asset monitor (clam) introduction control loop asset monitors (clam) are set up in the 800xa system to monitor control loops. They display the complex analysis of control loops in a user friendly manner in real time. Each control loop asset monitor is associa...
Page 82
Running the control loop asset monitor section 8 control loop asset monitor (clam) 82 3bua000150-600 before performing operational activities related to control loop asset monitors, consider the following: • the ao servers should have been configured as part of post installation process. If they hav...
Page 83
Section 8 control loop asset monitor (clam) basic loop monitoring mode (unlicensed) 3bua000150-600 83 running a successful clam. Refer to system 800xa asset optimization configuration (3bua000118*) - control loop asset monitor input data storage and display configuration for details about log templa...
Page 84
Basic loop monitoring mode (unlicensed) section 8 control loop asset monitor (clam) 84 3bua000150-600 clicking asset monitor status . Click conditions for condition details of clam as shown in figure 41 . Faceplate has the following tab views in operator mode ( figure 42 ): • status • final controll...
Page 85
Section 8 control loop asset monitor (clam) basic loop monitoring mode (unlicensed) 3bua000150-600 85 in addition to the above tabs, an application engineer sees two more tabs. They are: • controller configuration • loop configuration figure 42. Typical faceplate view in operator’s role (unlicensed).
Page 86
Basic loop monitoring mode (unlicensed) section 8 control loop asset monitor (clam) 86 3bua000150-600 these tabs are useful in configuring clam for various parameters specific to controller and loop. Figure 43 shows the typical configured clam faceplate under application engineer's and operator’s ro...
Page 87
Section 8 control loop asset monitor (clam) basic loop monitoring mode (unlicensed) 3bua000150-600 87 4. Select clam faceplate in the aspect list area to launch clam faceplate in preview area. The faceplate has multiple tabs with access to the most important aspects for reviewing results or entering...
Page 88
Enhanced control loop monitoring mode (licensed mode) section 8 control loop asset monitor 88 3bua000150-600 • loop performance details ( figure 45 ): used to view control loop asset monitor summary results. Diagnosis information does not appear in the figure as it is under unlicensed mode. Enhanced...
Page 89
Section 8 control loop asset monitor (clam) enhanced control loop monitoring mode (licensed 3bua000150-600 89 the asset monitor status continuously displays and evaluates condition details of fce and loop performance summary. View the asset monitor status by right- clicking asset monitor status. Cli...
Page 90
Enhanced control loop monitoring mode (licensed mode) section 8 control loop asset monitor 90 3bua000150-600 • loop performance details • trend in addition to the above tabs, an application engineer sees two more tabs. They are: • controller configuration • loop configuration control loop asset moni...
Page 91
Section 8 control loop asset monitor (clam) enhanced control loop monitoring mode (licensed 3bua000150-600 91 final control element details ( figure 49 ): used to view final control element diagnosis information and indices. It shows various parameter details of fce as shown in figure 49 with diagno...
Page 92
Enhanced control loop monitoring mode (licensed mode) section 8 control loop asset monitor 92 3bua000150-600 • loop performance details ( figure 50 ): used to view control loop asset monitor summary results. It shows various parameters details of fce as shown in figure 50 with diagnosis as tool tip ...
Page 93: Operation
Section 8 control loop asset monitor (clam) operation 3bua000150-600 93 after running long enough for loop auditing to execute, if parameters in the fce and loop performance read current data not analyzable , it indicates that the asset monitor instance may not be receiving pv, sp, and co data. Chec...
Page 94
Final control element summary section 8 control loop asset monitor (clam) 94 3bua000150-600 2. The indices are compared with certain thresholds. If the threshold is exceeded, the resulting signal is set to one and to zero if not. 3. The thresholded signals are combined into pre-conditions/diagnoses....
Page 95
Section 8 control loop asset monitor (clam) loop performance summary 3bua000150-600 95 the weights named w1, w2 and w3 corresponds to the asset parameters weight_h_fce_stiction_backlash, weight_h_fce_leakage and weight_h_loop_non-linearity as shown in figure 52 . The weighted signals are summed that...
Page 96
Performance indices section 8 control loop asset monitor (clam) 96 3bua000150-600 the weighted signals are summed that represents a health value for the loop performance. This value is compared to predefined alarm thresholds to decide if an alarm is necessary. Performance indices the performance ind...
Page 97
Section 8 control loop asset monitor (clam) performance indices 3bua000150-600 97 5. Standard deviation controller output calculates the standard deviation of the controller output. The result is a measure of the control effort to keep the loop under automatic control. Result in the interval [0-100 ...
Page 98
Performance indices section 8 control loop asset monitor (clam) 98 3bua000150-600 10. Outlier index simple algorithm for detecting outliers by using a sliding window, checking if single outliers exceed the standard deviation significantly. [0- 1000 ‰]. Nominal 0 ‰ (no outlier). Data validity 11. Noi...
Page 99
Section 8 control loop asset monitor (clam) performance indices 3bua000150-600 99 16. Auto-correlation (acf) ratio describes how fast the auto-correlation function (acf) of the data decays over time. A comparison is made between a dead time value for the specific loop category and the value where th...
Page 100
Performance indices section 8 control loop asset monitor (clam) 100 3bua000150-600 21. Oscillation index on control error detects and quantifies oscillating signals. The result is in the interval [-1…1] where a positive value means that an oscillation was found and the closer to one the value is the...
Page 101
Section 8 control loop asset monitor (clam) performance indices 3bua000150-600 101 27. Shut-off process value index index detecting valve leakage or zero instrument errors. The index requires the controller output to be zero for a significant amount of time, since it is calculated based on the flow ...
Page 102
Performance indices section 8 control loop asset monitor (clam) 102 3bua000150-600 32. Valve sizing index quantifies the amount of time that the controller output is within normal operating range (10- 90%). [0…100%] nominally the controller should be within normal range > 50 % of time, i.E. Index va...
Page 103: Input Data Plots
Section 8 control loop asset monitor (clam) input data plots 3bua000150-600 103 input data plots input data used for analysis can be viewed through the control loop asset monitor ex clam faceplate tab - trend as shown in figure 54 . The high and low limits for pv, sp, and co can be adjusted as neces...
Page 104
Input data plots section 8 control loop asset monitor (clam) 104 3bua000150-600 the duration of the trend display is set to one hour by default. It can be increased to any higher range stored in the clam log template, which stores four weeks of data by default. Aspect shortcuts from faceplate the cl...
Page 105: Alarm List For Loops
Section 8 control loop asset monitor (clam) alarm list for loops 3bua000150-600 105 alarm list for loops the most recent information of all possible alarms triggered by a control loop asset monitor for the loop it is assigned to, can be viewed from the alarm list aspect as shown in figure 56 . The l...
Page 106: Clam Diagnostics
Clam diagnostics section 8 control loop asset monitor (clam) 106 3bua000150-600 clam diagnostics the available clam diagnostics are: 1. Final control element diagnostics. 2. Loop performance diagnostics. Final control element diagnostics include the following: 1. Fce action. 2. Fce leakage. 3. Fce s...
Page 107
Section 8 control loop asset monitor (clam) final control element diagnostics 3bua000150-600 107 loop performance diagnostics include the following: 1. Loop tuning. 2. Setpoint oscillation. 3. External disturbances. 4. Data reliability. 5. Harris index. 6. Setpoint crossing index. 7. Oscillation ind...
Page 108
Final control element diagnostics section 8 control loop asset monitor (clam) 108 3bua000150-600 corresponding indices dealing with valve movement. An important prerequisite is the handling of noise, which is not related to valve movement. Fce leakage gasket leaks can occur when valves are removed o...
Page 109
Section 8 control loop asset monitor (clam) loop performance diagnostics 3bua000150-600 109 loop nonlinearity many problems in control loop performance are caused by significant nonlinearity within the control loop. If the controller is in manual mode, a significant oscillation is always externally ...
Page 110
Loop performance diagnostics section 8 control loop asset monitor (clam) 110 3bua000150-600 set point oscillation the detection of setpoint oscillations is important for the detection of external excitation in a control loop. The setpoint is usually much less distorted and noisy than the control err...
Page 111
Section 8 control loop asset monitor (clam) loop performance diagnostics 3bua000150-600 111 harris index is therefore a number between 0 and 1: the higher the number, the higher the controller performance to the theoretical maximum. Setpoint crossing index this index identifies the amount of control...
Page 112
Loop performance diagnostics section 8 control loop asset monitor (clam) 112 3bua000150-600 the control error is often far away (more than 3% of loop range) from the target. A low index value means that the deviation between process variable and target is within acceptable limits. Response speed thi...
Page 113: (Hxam)
3bua000150-600 113 section 9 heat exchanger asset monitor (hxam) introduction heat exchanger asset monitors are intended to alert process and maintenance personnel when the operation of a heat exchanger indicates significant decline in performance. The decline in performance may be due to fouling or...
Page 114
Objective section 9 heat exchanger asset monitor (hxam) 114 3bua000150-600 objective the objective is to detect drastic drops in heat exchanger efficiency, rather than minute changes. This is accomplished by taking baseline measurements of the critical readable process variables around the heat exch...
Page 115
Section 9 heat exchanger asset monitor (hxam) terminology 3bua000150-600 115 terminology refer to heat exchanger specific terminology on page 187 for specific heat exchanger terminology used in this document. Generic heat exchanger asset monitor (hxam-g) this section describes the salient features o...
Page 116
Description section 9 heat exchanger asset monitor (hxam) 116 3bua000150-600 – delta p hot: alternatively, p in and p out for the hot side may be used to calculate delta p. – delta p cold: alternatively, p in and p out for cold side may be used to calculate delta p. If the data values are well outsi...
Page 117
Section 9 heat exchanger asset monitor (hxam) methodology 3bua000150-600 117 • mass flow less than 0 kg/hr. • mass flow greater than 1000000 kg/hr. • pressure less than -10,000 (any units). • pressure greater than 10,000 (any units). • volume flow less than 0 m 3 /hr. • volume flow greater than 1,00...
Page 118
Methodology section 9 heat exchanger asset monitor (hxam) 118 3bua000150-600 during monitoring, the asset monitor at every analysis phase checks the cops and compares with the available bops. If the cops data falls within the respective tolerance band values (see, bops info tab) of any particular bo...
Page 119
Section 9 heat exchanger asset monitor (hxam) methodology 3bua000150-600 119 acd will be created. The acd will inform plant operations personnel that the heat exchanger operational efficacy has fallen significantly and should be investigated further. Conversely, if enew has gone up by a percentage (...
Page 120
Generic heat exchanger asset monitor operationsection 9 heat exchanger asset monitor (hxam) 120 3bua000150-600 • staleness: if any one or more of the trained bops goes stale, an acd is created. • if delta tx has exceeded a high or low limit specified at configuration time. • if any of the following ...
Page 121
Section 9 heat exchanger asset monitor (hxam) hxam_g_faceplate 3bua000150-600 121 any error in configuration will set the quality status to badconfigurationerror and any other error during execution will set the quality status to bad . In either case the asset monitor will stop executing and will sh...
Page 122
Hxam_g_faceplate section 9 heat exchanger asset monitor (hxam) 122 3bua000150-600 – badoutofservice: asset monitoring server engine is shut down. – good: asset monitor is running smoothly. – bad: asset monitor had encountered some error. – badconfigurationerror: configuration error in asset monitor....
Page 123
Section 9 heat exchanger asset monitor (hxam) hxam_g_faceplate 3bua000150-600 123 – calculated date: shows the time when the ebaseline was calculated. It shows not available during training. – best baseline e: shows the best ebaseline among the trained bops. It shows -1 if any bops gets stale and th...
Page 124
Hxam_g_faceplate section 9 heat exchanger asset monitor (hxam) 124 3bua000150-600 • hd cold: gives the heat duty for the cold side. Temperature tab the temperature tab ( figure 60 ) shows the details of the delta_tx_operating_point, delta_t_hot_operating_point, and delta_t_cold_operating_point condi...
Page 125
Section 9 heat exchanger asset monitor (hxam) hxam_g_faceplate 3bua000150-600 125 the fields in the temperature tab are: • delta tx monitor: – status: gives the status of the delta tx monitor. The status values are: enabled: if delta tx monitor is enabled. Not enabled: if delta tx monitor is not ena...
Page 126
Hxam_g_faceplate section 9 heat exchanger asset monitor (hxam) 126 3bua000150-600 – limit reached: gives the subcondition for the delta_t_hot_operating_point condition. The different subconditions that will be reported during monitoring are as follows: normal: delta t hot is within the normal range....
Page 127
Section 9 heat exchanger asset monitor (hxam) hxam_g_faceplate 3bua000150-600 127 decreasing: delta t cold has crossed the delta_t_ cold _decreasing limit. Low: delta t cold has crossed the delta_t_ cold _low limit. – delta t cold: gives the value of delta t cold for the current ops. Pressure tab th...
Page 128
Hxam_g_faceplate section 9 heat exchanger asset monitor (hxam) 128 3bua000150-600 the values of delta p hot and delta p cold will show 0 when the asset monitoring server is not running and -1 otherwise, except when the status field says enabled . The fields in the pressure tab are: • delta p hot mon...
Page 129
Section 9 heat exchanger asset monitor (hxam) hxam_g_faceplate 3bua000150-600 129 not available: during training. Data unavailable: if delta p cold monitor is but delta p cold data is not available. – limit reached: gives the subcondition for the delta_ p_cold _operating_point condition. The differe...
Page 130
Hxam_g_faceplate section 9 heat exchanger asset monitor (hxam) 130 3bua000150-600 enabled: if mass flow hot monitor is enabled. Not enabled: if mass flow hot monitor is not enabled. Stale data in trained set: if one or more bops is stale. Not available: during training. Data unavailable: if mass flo...
Page 131
Section 9 heat exchanger asset monitor (hxam) hxam_g_faceplate 3bua000150-600 131 high: mass flow hot has crossed the w_hot _high limit. Decreasing: mass flow hot has crossed the w_hot _decreasing limit. Low: mass flow hot has crossed the w_ hot _low limit. – mass flow hot: gives the value of mass f...
Page 132
Hxam_g_faceplate section 9 heat exchanger asset monitor (hxam) 132 3bua000150-600 – mass flow cold: gives the value of mass flow cold for the current ops. Heat duty tab the heat duty tab ( figure 63 ) shows the details of the delta_hd_operating_point, hd_hot_operating_point, and hd_cold_operating_po...
Page 133
Section 9 heat exchanger asset monitor (hxam) hxam_g_faceplate 3bua000150-600 133 will show 0 when the asset monitoring server is not running and -1 otherwise except when the status field says enabled . The fields in the heat duty tab are: • delta hd monitor: – status: this field gives the status of...
Page 134
Hxam_g_faceplate section 9 heat exchanger asset monitor (hxam) 134 3bua000150-600 – limit reached: gives the subcondition for the hd_hot_operating_point condition. The different subconditions that will be reported during monitoring are: normal: hd hot is within the normal range. High: hd hot has cro...
Page 135
Section 9 heat exchanger asset monitor (hxam) hxam_g_faceplate 3bua000150-600 135 trend display tab the trend display tab shows the plots of the logged properties against time. This tab is the view of trend display aspect. Three properties are logged and the user can configure for which logged prope...
Page 136
Hxam_g_faceplate section 9 heat exchanger asset monitor (hxam) 136 3bua000150-600 training. Some of the tolerance values are used by logic to determine the nearest of all bops to the cops. Last calculated training period when all the bops go stale or when you press the "clear bops and retrain" butto...
Page 137
Section 9 heat exchanger asset monitor (hxam) hxam_g_faceplate 3bua000150-600 137 the following formula is used for calculating the training period: minimum of: 1% of heat exchanger service interval, or 40 * monitoring interval * number of expected bops sets. General info tab the general info tab ( ...
Page 138
Trends and logs section 9 heat exchanger asset monitor (hxam) 138 3bua000150-600 trends and logs the trend portion is used to present object properties graphically as a function of time or as an xy-plot. To enable trending, the following seven aspects are used: • history source. • log template. • lo...
Page 139
Section 9 heat exchanger asset monitor (hxam) trend template 3bua000150-600 139 the data for these properties are read from the assetmonitorproperties aspect, which is populated by the asset monitoring engine. The view of the log configuration aspect is shown in figure 66 . The logged data for a pro...
Page 140
Trend display section 9 heat exchanger asset monitor (hxam) 140 3bua000150-600 trend display the trend display aspect displays the four logged heat exchanger properties graphically as a function of time. Asset monitor properties the asset monitor properties aspect displays the values of parameters d...
Page 141
Section 9 heat exchanger asset monitor (hxam) log file description (.Csv file) 3bua000150-600 141 5. All the process data, calculated data, and acds in the order shown in table 10 (heading is also provided). Table 10. Log file headings and explanations heading explanation time stamp the current time...
Page 142
Log file description (.Csv file) section 9 heat exchanger asset monitor (hxam) 142 3bua000150-600 delta t cold cold side temperature difference delta tx temperature difference across heat exchanger is hot side condensing specifies if hot side is condensing thc hot eff effective delta t hot if hot si...
Page 143
Section 9 heat exchanger asset monitor (hxam) log file description (.Csv file) 3bua000150-600 143 hd hot acd acd for hd hot hd cold acd acd for hd cold delta hd acd acd for delta hd clear bops clear_bops: specifies if the asset monitor has to be retrained table 10. Log file headings and explanations...
Page 144
Shell and tube heat exchanger asset monitor (hxam-st) section 9 heat exchanger asset 144 3bua000150-600 shell and tube heat exchanger asset monitor (hxam-st) the following topics discuss shell and tube heat exchanger asset monitor operation. Description the shell and tube heat exchanger asset monito...
Page 145
Section 9 heat exchanger asset monitor (hxam) description 3bua000150-600 145 – delta p cold: alternatively, p in and p out for cold side may be used to calculate delta p. If the data values are well outside of reasonable range, then the heat exchanger asset monitor will assume that these values are ...
Page 146
Methodology section 9 heat exchanger asset monitor (hxam) 146 3bua000150-600 • mass flow greater than 1,000,000 kg/hr. • pressure less than -10,000 (no units). • pressure greater than 10,000 (no units). • volume flow less than 0 m 3 /hr. • volume flow greater than 1,000,000 m 3 /hr. Calculated value...
Page 147
Section 9 heat exchanger asset monitor (hxam) methodology 3bua000150-600 147 • w cold. • delta p hot. • delta p cold. Stable will be when the bops that is significantly different is recorded, remains within one percent of change for three consecutive executions. If design heat transfer efficiency (d...
Page 148
Methodology section 9 heat exchanger asset monitor (hxam) 148 3bua000150-600 will be replaced with the current cops, if it persists for more than three times the asset monitor sample interval (amsi). Similarly, acds will be created if unew has gone down by a percentage that is configured by the user...
Page 149
Section 9 heat exchanger asset monitor (hxam) methodology 3bua000150-600 149 • if any of the following variables has exceeded a high or low limit specified at configuration time: – delta t hot. – delta t cold. – w hot. – w cold. – delta p hot. – delta p cold. – hd hot. – hd cold. – delta hd. – limit...
Page 150
Shell and tube heat exchanger asset monitor operation section 9 heat exchanger asset monitor 150 3bua000150-600 shell and tube heat exchanger asset monitor operation once the asset monitor is properly configured, one can start the asset monitor (asset monitor aspect name: hxam_st) by starting the as...
Page 151
Section 9 heat exchanger asset monitor (hxam) hxam_st_faceplate 3bua000150-600 151 a normal working asset monitor without any errors will appear similar to the one shown in figure 68 . Hxam_st_faceplate a detailed view of the asset monitor can be seen from the hxam_st_faceplate. The hxam_st_faceplat...
Page 152
Hxam_st_faceplate section 9 heat exchanger asset monitor (hxam) 152 3bua000150-600 – badconfigurationerror: configuration error in asset monitor. – goodlocaloverride: asset monitor is under training/asset monitor is in monitoring phase but there is no bops recorded/one or more bops has gone stale. •...
Page 153
Section 9 heat exchanger asset monitor (hxam) hxam_st_faceplate 3bua000150-600 153 – best baseline e: shows the best ebaseline among the trained bops. It shows -1 if any bops gets stale and the asset monitor goes back to training. • current performance factor: – value of e: shows the enew calculated...
Page 154
Hxam_st_faceplate section 9 heat exchanger asset monitor (hxam) 154 3bua000150-600 heat transfer tab the heat transfer tab ( figure 70 ) shows the details of the heat_transfer_performance condition being assessed. This tab is a view of the hxam_st_heat_transfer_fe aspect. The fields in the heat tran...
Page 155
Section 9 heat exchanger asset monitor (hxam) hxam_st_faceplate 3bua000150-600 155 the text box in figure 70 tells the user how many bops are received during training and how many bops are received out of the expected number during monitoring. • compared heat transfer coefficient: – value of u: show...
Page 156
Hxam_st_faceplate section 9 heat exchanger asset monitor (hxam) 156 3bua000150-600 u_significant_improvement_level from ubaseline). Cannot compare: heat exchanger input data cannot be compared against any trained bops. Temperature tab the temperature tab ( figure 71 ) shows the details of the delta_...
Page 157
Section 9 heat exchanger asset monitor (hxam) hxam_st_faceplate 3bua000150-600 157 the limit reached field for all temperature monitors will show normal , when the asset monitoring server is not running or if status field says not available , stale data in trained set , or not enabled . The values o...
Page 158
Hxam_st_faceplate section 9 heat exchanger asset monitor (hxam) 158 3bua000150-600 not enabled: if delta t hot monitor is not enabled. Stale data in trained set: if one or more bops is stale. Not available: during training. – limit reached: gives the subcondition for the delta_t_hot_operating_point ...
Page 159
Section 9 heat exchanger asset monitor (hxam) hxam_st_faceplate 3bua000150-600 159 increasing: delta t cold has crossed the delta_t_ cold _increasing limit. High: delta t cold has crossed the delta_t_ cold _high limit. Decreasing: delta t cold has crossed the delta_t_ cold _decreasing limit. Low: de...
Page 160
Hxam_st_faceplate section 9 heat exchanger asset monitor (hxam) 160 3bua000150-600 and delta p cold will show 0 when the asset monitoring server is not running and -1 otherwise, except when the status field says enabled . The fields in the pressure tab are: • delta p hot monitor: – status: this fiel...
Page 161
Section 9 heat exchanger asset monitor (hxam) hxam_st_faceplate 3bua000150-600 161 not available: during training. Data unavailable: if delta p cold monitor is but delta p cold data is not available. – limit reached: gives the subcondition for the delta_ p_cold _operating_point condition. The differ...
Page 162
Hxam_st_faceplate section 9 heat exchanger asset monitor (hxam) 162 3bua000150-600 the fields in the mass flow tab are: • mass flow hot monitor: – status: this field gives the status of the mass flow hot monitor. The status values are: enabled: if mass flow hot monitor is enabled. Not enabled: if ma...
Page 163
Section 9 heat exchanger asset monitor (hxam) hxam_st_faceplate 3bua000150-600 163 high: mass flow hot has crossed the w_hot _high limit. Decreasing: mass flow hot has crossed the w_hot _decreasing limit. Low: mass flow hot has crossed the w_ hot _low limit. – mass flow hot: gives the value of mass ...
Page 164
Hxam_st_faceplate section 9 heat exchanger asset monitor (hxam) 164 3bua000150-600 heat duty tab the heat duty tab ( figure 74 ) shows the details of the delta_hd_operating_point, hd_hot_operating_point, and hd_cold_operating_point conditions being assessed. This tab is a view of the hxam_st_heatdut...
Page 165
Section 9 heat exchanger asset monitor (hxam) hxam_st_faceplate 3bua000150-600 165 the fields in the heat duty tab are: • delta hd monitor: – status: this field gives the status of the delta hd monitor. The different status that one might see here are as follows: enabled: f delta hd monitor is enabl...
Page 166
Hxam_st_faceplate section 9 heat exchanger asset monitor (hxam) 166 3bua000150-600 low: hd hot has crossed the hd_hot_low limit. – hd hot: gives the value of hd hot for the current ops. • hd cold monitor: – status: gives the status of the hd cold monitor. The status values are: enabled: if hd cold m...
Page 167
Section 9 heat exchanger asset monitor (hxam) hxam_st_faceplate 3bua000150-600 167 tube velocity tab the tube velocity tab ( figure 75 ) shows the details of the tube_velocity condition being assessed. This tab is the view of hxam_st_tube_velocity_fe aspect. The limit reached field for tube velocity...
Page 168
Hxam_st_faceplate section 9 heat exchanger asset monitor (hxam) 168 3bua000150-600 – normal: tube velocity is within the normal range. – high: tube velocity has crossed the tube velocity_high limit. – low: tube velocity has crossed the tube velocity_low limit. • tube velocity: gives the value of tub...
Page 169
Section 9 heat exchanger asset monitor (hxam) hxam_st_faceplate 3bua000150-600 169 – stale data in trained set: if one or more bops is stale. – not available: during training. • limit reached: gives the subcondition for the limit_approach_temperature condition. The different subconditions that will ...
Page 170
Hxam_st_faceplate section 9 heat exchanger asset monitor (hxam) 170 3bua000150-600 the fields in the shell side flow tab are: • status: this field gives the status of the shell side flow monitor. The different status values are: – enabled: if shell side flow monitor is enabled. – not enabled: if she...
Page 171
Section 9 heat exchanger asset monitor (hxam) hxam_st_faceplate 3bua000150-600 171 • limit reached: gives the subcondition for the temperature_profile condition. The different subconditions that will be reported during monitoring are: – normal: the heat exchanger is not working on temperature crosso...
Page 172
Hxam_st_faceplate section 9 heat exchanger asset monitor (hxam) 172 3bua000150-600 bops info tab the bops info tab ( figure 79 ) gives the user information on the trained bops. The first text box in figure 79 will display the same message as the text box in figure 69 on page 152. The second text box...
Page 173
Section 9 heat exchanger asset monitor (hxam) trends and logs 3bua000150-600 173 general info tab the general info tab ( figure 80 ) displays general information. For example, it will display the recommended amsi, if the amsi configured by the user does not match the recommended value. It also displ...
Page 174
History source section 9 heat exchanger asset monitor (hxam) 174 3bua000150-600 • trend display. • assetmonitorproperties. • hxam_st_available_logs_fe. Refer to system 800xa operations operator workplace configuration (3bse030322*) for more details. History source the history source aspect is used t...
Page 175
Section 9 heat exchanger asset monitor (hxam) log configuration 3bua000150-600 175 the data for these properties are read from the assetmonitorproperties aspect, which is populated by the asset monitoring engine. The view of the log configuration aspect is shown in figure 81 . The logged data for a ...
Page 176
Trend template section 9 heat exchanger asset monitor (hxam) 176 3bua000150-600 trend template a trend template is a template for building trend displays. Modifying an existing trend template will not automatically affect existing trends. Settings that are affected are those that can not be changed ...
Page 177
Section 9 heat exchanger asset monitor (hxam) log file description (.Csv file) 3bua000150-600 177 1. Description of what data the file contains. 2. Date and time when the file was created. 3. Date and time when logging started. 4. All the asset parameters (with heading asset parameter name and param...
Page 178
Log file description (.Csv file) section 9 heat exchanger asset monitor (hxam) 178 3bua000150-600 p hot out hot side outlet pressure delta p hot hot side pressure difference p cold in cold side inlet pressure p cold out cold side outlet pressure delta p cold cold side pressure difference delta t hot...
Page 179
Section 9 heat exchanger asset monitor (hxam) log file description (.Csv file) 3bua000150-600 179 heat transfer performance acd acd for heat transfer efficiency staleness acd acd for staleness delta tx acd acd for delta tx delta t hot acd acd for delta t hot delta t cold acd acd for delta t cold w h...
Page 180
Log file description (.Csv file) section 9 heat exchanger asset monitor (hxam) 180 3bua000150-600
Page 181: Introduction
3bua000150-600 181 section 10 asset optimization reporting introduction the 800xa system provides two asset optimization report templates that summarize important maintenance information to provide maintenance engineers with comprehensive data to make decisions. The asset optimization report templat...
Page 182
Ao asset condition history report section 10 asset optimization reporting 182 3bua000150-600 ao asset condition history report the ao asset condition history report provides, for every asset, a detailed listing of all asset maintenance conditions that have been active in a time interval. This report...
Page 183
Section 10 asset optimization reporting working with asset optimization reports 3bua000150-600 183 in the example shown in figure 82 , the saved reports are retained as objects under the ao running time report folder found under reports in the scheduling structure. To review a printed report: 1. Sel...
Page 184
Working with asset optimization reports section 10 asset optimization reporting 184 3bua000150-600 3. To reprint a completed report, select the report printing aspect to display files that can be printed as shown in figure 84 . 4. Select the file and click print file to reprint the report. Example r...
Page 185
Section 10 asset optimization reporting working with asset optimization reports 3bua000150-600 185 figure 85. Ao running time report (example).
Page 186
Working with asset optimization reports section 10 asset optimization reporting 186 3bua000150-600 an example of the ao asset condition history report is shown in figure 86 . Tc07789a figure 86. Ao asset condition history report (example).
Page 187: Terminology
3bua000150-600 187 appendix a heat exchanger specific terminology heat exchanger specific terminology table 12 is a list of terms associated with heat exchangers. Table 12. Heat exchanger specific terminology term/acronym description amsi asset monitor sample interval. Time interval used by the asse...
Page 188
Heat exchanger specific terminology appendix a heat exchanger specific terminology 188 3bua000150-600 e performance factor hd heat duty hd cold cold-side heat duty hd hot hot-side heat duty heatx heat exchanger heatx_g generic heat exchanger heatx_st shell and tube heat exchanger hxam-g generic heat...
Page 189
Appendix a heat exchanger specific terminology heat exchanger specific terminology 3bua000150-600 189 tp training period. Time interval in which all operating point sets should be gathered. Typical values nsi/100 or 200 hours, whichever is smaller. U heat transfer efficiency w mass flow w cold cold-...
Page 190
Heat exchanger specific terminology appendix a heat exchanger specific terminology 190 3bua000150-600
Page 191: Index
3bua000150-600 191 a about this book 9 active work orders maximo 62 sap 67 ao asset condition history report 182 ao running time report 182 ao server operation asset optimization event log 43 asset optimization server 46 ao server tab 46 asset monitors tab 47 runtime statistics tab 48 ao server tab ...
Page 192
Index 192 3bua000150-600 index 192 3bua000150-600 d dms fault reports 53 document conventions 9 related 11 e equipment status maximo 65 sap 71 f faceplate hxam-g 121 hxam-st 151 fault reports creating 57 dms only 53 submitting 53 functional components 15 h hxam-g asset monitor faceplate 121 log file...
Page 193
Index 3bua000150-600 193 ao asset condition history report 182 ao running time report 182 inputs 182 output 182 runtime statistics tab 48 s sap active work orders 67 equipment status 71 preventive maintenance schedule 72 work order history 70 severity indicator icons 28, 29 spare parts maximo 66 sub...
Page 194
Index 194 3bua000150-600 index 194 3bua000150-600
Page 196
Power and productivity for a better world tm contact us copyright© 2014 abb. All rights reserved. 3bua000150-600 www.Abb.Com/800xa www.Abb.Com/controlsystems.

