- DL manuals
- Chauvin Arnoux
- Measuring Instruments
- C.A 8335
- User Manual
Chauvin Arnoux C.A 8335 User Manual
Summary of C.A 8335
Page 1
E n g l i s h user’s manual three-phase electrical networks analyser c . A 8 3 3 5 quali star +.
Page 2: Precautions For Use
2 thank you for purchasing a c.A 8335 three-phase electrical networks analyser (qualistar+). To obtain the best service from your unit: read these operating instructions carefully, comply with the precautions for use. Definition of measurement categories: measurement category iv corresponds to mea...
Page 3: Contents
3 contents 1. Getting started ........................................................4 1.1. Unpacking .............................................................4 1.2. Charging the battery ..............................................5 1.3. Choice of language .......................................
Page 4: 1. Getting Started
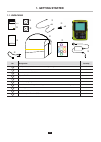
4 1. Getting started 1.1. Unpacking x 5 prÉcautions d’emploi cet appareil est protégé contre des tensions accidentelles n’excédant pas 600 v par rapport à la terre en catégorie de mesure iii ou 300 v par rapport à la terre en catégorie de mesure iv. La protection assurée par l’appareil peut-être com...
Page 5
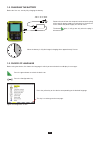
5 1.2. Charging the battery before the first use, start by fully charging the battery. 120 v ± 10 %, 60 hz 230 v ± 10 %, 50 hz remove the cover from the receptacle and connect the plug of the specific power supply unit to the device. Connect the mains cord to the power supply unit and to mains. The ...
Page 6
6 2. Description of the device 2.1. Functions the c.A. 8335 (qualistar+) is a three-phase network analyzer with colour graphic display and built-in rechargeable battery. It plays three roles, and can be used: to measure the rms values, powers, and perturbations of electric distribution networks. ...
Page 7
7 2.1.2. Display functions display of waveforms (voltages and currents). inrush current function: displays parameters useful for study of the starting of a motor. Instantaneous current and voltage at the instant designated by the cursor. Maximum instantaneous absolute value of the current and of...
Page 8
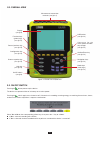
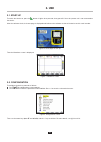
8 figure 1: overall view of qualistar+ 2.3. On/off switch pressing the button powers up the device. The device can operate either on its battery or on mains power. Pressing the switch again turns the device off. If the device is recording, metering energy, or searching for transients, alarms, and/or...
Page 9
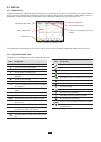
9 2.4. Display 2.4.1. Presentation the backlit 320x240 (1/4 vga) pixel graphic liquid crystal screen displays all measurements with their curves, the parameters of the unit, the curves selected, the instantaneous values of the signals, and the type of measurement selected. When the device is powered...
Page 10
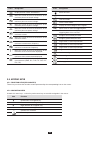
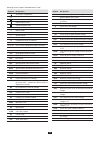
10 icons designation display of mean values and extrema. Move the cursor to the first occurrence of the maximum phase-to-neutral voltage. Move the cursor to the first occurrence of the minimum phase-to-neutral voltage. Move the cursor to the first occurrence of the maximum phase-to-phase voltage. Mo...
Page 11
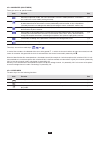
11 2.5.3. Mode keys (violet keys) these give access to specific modes: item function see waveform acquisition mode, with two sub-modes: transients mode (blackouts, interference, etc.) and inrush current mode (starting of motor). § 5 harmonic curves display mode: representation of voltage, current, a...
Page 12
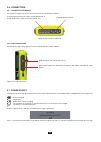
12 2.6. Connectors 2.6.1. Connection terminals located on the top of the device, these connectors are distributed as follows: figure 3: the connection terminals 2.6.2. Side connectors located on the right side of the device, these connectors are used as follows: 4 current input terminals for current...
Page 13
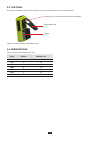
13 retractable stand. Battery. Figure 5: stand and battery compartment cover 2.9. Abbreviations prefixes of international system (si) units prefix symbol multiplies by milli m 10 -3 kilo k 10 3 mega m 10 6 giga g 10 9 tera t 10 12 peta p 10 15 exa e 10 18 metal ring. It is used to secure the device ...
Page 15: 3. Use
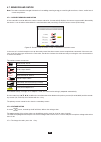
15 3. Use 3.1. Start-up to switch the device on, press the button. It lights when pressed, then goes off if the mains power unit is not connected to the device. After the software check, the home page is displayed and indicates the software version of the device and its serial number. Figure 6: home...
Page 16
16 the following points must be checked or adapted for each measurement: define the parameters of the calculation methods (see §4.5). select the distribution system (single-phase to five-wire three-phase) and the connection method (2 wattmeters, 2 ½ elements, standard) (see §4.6). program the ...
Page 17
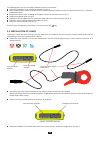
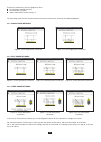
17 to make a measurement, you must program at least: the calculation method (see §4.5), the connection (see §4.6) and the ratios of the sensors (see §4.7). The measuring leads must be connected to the circuit to be measured as shown by the following diagrams. 3.3.1. Single-phase network 3.3.2....
Page 18
18 3.3.4. Connection procedure switch the instrument on. configure the device for the measurement to be made and the type of network concerned (see §4), connect the leads and current sensors to the unit. connect the earth and/or neutral lead to the network earth and/or neutral (when it is di...
Page 19: 4. Configuration
19 4. Configuration the configuration key is used to configure the device. This must be done before each new type of measurement. The con- figuration remains in memory, even after the device is switched off. 4.1. Configuration menu the arrow keys (,, , ) are used to navigate in the configuration...
Page 20
20 4.4. Display 4.4.1. Contrast/brightness the menu is used to define the contrast and brightness of the display unit. The display is as follows: figure 18: the contrast/brightness menu use the arrow keys (,, , ) to change the contrast and brightness. To return to the configuration menu, press ....
Page 21
21 the automatic mode is used to save the battery. The display screen is switched off automatically after five minutes without action on the keys if the device is powered only by its battery and if recording is in progress. The on/off button blinks to indicate that the device is still in operation. ...
Page 22
22 figure 22: the choice of coefficients of calculation of the k factor menu use the arrow keys (,, , ) to fix the value of coefficients q and e: q: exponential constant that depends on the type of winding and the frequency. The value of q can range from 1.5 to 1.7. The value of 1.7 is suitabl...
Page 23
23 figure 23: the choice of reference for the level of harmonics menu use the arrow keys (,) to fix the reference for the level of harmonics: %f: the reference is the value of the fundamental. %r: the reference is the total value. Then validate with the key. The device returns to the configu...
Page 24
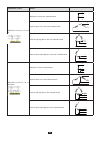
24 figure 16: the connection menu several electrical diagrams can be selected: use the arrow keys (,, , ) to choose a connection. One or more types of network correspond to each distribution system. Distribution system source single-phase 2-wire (l1 and n) single-phase 2-wire non-earthed neutral...
Page 25
25 distribution system source split-phase 3-wire (l1, l2 and n) split-phase 3-wire non-earthed neutral l1 n l2 3-phase open star 3-wire non-earthed neutral l1 l2 n 3-phase high leg delta 3-wire non-earthed neutral l1 l2 n 3-phase open high leg delta 3-wire non-earthed neutral l1 l2 n split-phase 4-w...
Page 26
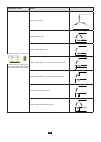
26 distribution system source 3-phase 3-wire (l1, l2 and l3) indicate which 2 current sen- sors will be connected: a1 and a2, or a2 and a3, or a3 and a1. 3-phase star 3-wire l1 l2 l3 3-phase delta 3-wire l1 l2 l3 3-phase open delta 3-wire l1 l2 l3 3-phase open delta 3-wire earthed junction of phases...
Page 27
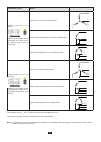
27 distribution system source 3-phase 4-wire (l1, l2, l3 and n) indicate which voltages will be connected: all 3 (3v) or only 2 (v1 and v2, or v2 and v3, or v3 and v1). 3-phase star 4-wire non-earthed neutral l1 l2 l3 n 3-phase open high leg delta 4-wire non-earthed neutral l1 l2 l3 n 3-phase high l...
Page 28
28 4.7. Sensors and ratios note: the ratios cannot be changed if the device is recording, metering energy, or searching for transients, alarms, and/or inrush current acquisitions. 4.7.1. Current sensors and ratios a first screen a is used to define the current sensors and ratios. It automatically di...
Page 29
29 figure 26: the voltage ratios screen in the sensors and ratios menu in the case of a set-up without neutral figure 27: the voltage ratios screen in the sensors and ratios menu in the case of a set-up with neutral use the arrow keys (,) to choose the configuration of the ratios. 3u 1/1 or 4v 1...
Page 30
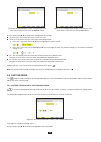
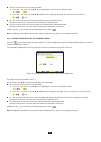
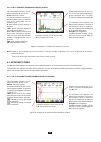
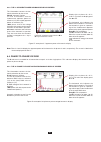
30 4v or 3u: all channels have the same threshold. Press the key, then use the , keys to highlight the value of the threshold in yellow. Press the key, then use the ,, and keys to change the threshold. The unit can be the v or the kv. 3v + vn: all channels have the same ratio and the ...
Page 31
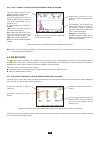
31 4.8.3. Current thresholds of the inrush current mode a third screen, displayed by pressing the icon, is used to define the inrush current thresholds. This involves programming the triggering threshold and the inrush current capture stopping threshold (the stopping threshold being the triggering t...
Page 32
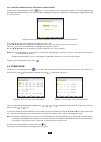
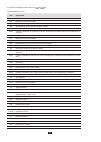
32 to change configuration pages, press the or key. The recordable values are: unit designation urms rms phase-to-phase voltage. Udc rms phase-to-neutral voltage. Upk+ maximum peak value of phase-to-phase voltage. Upk- minimum peak value of phase-to-phase voltage. Ucf crest (peak) factor of phase-to...
Page 33
33 the four last lines involve the recording of the harmonics of u, v, a and va. You can select a range of orders of the harmonics to be recorded (between 0 and 50) for each of these quantities, and within this range, if desired, only odd harmonics. Note: the level of harmonics of order 01 will be d...
Page 35
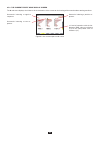
35 4.12. About the about screen displays information concerning the device. Figure 36: the about menu to return to the configuration menu, press ..
Page 36: 5. Waveform Capture
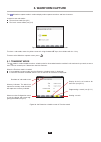
36 5. Waveform capture the waveform capture mode is used to display and to capture transients and inrush currents. It contains two sub-modes: the transient mode (see §5.1) the inrush current mode (see §5.2) figure 37: the screen of the waveform capture mode to select a sub-mode, move the yellow ...
Page 37
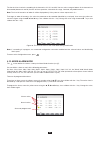
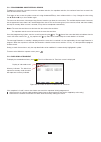
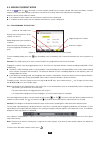
37 5.1.1. Programming and starting a search to program a search for a transient, enter the start date and time, the stop date and time, the number of transients to search for, then the name of the search. To change an item, move the yellow cursor to it using the and keys, then validate with the ...
Page 38
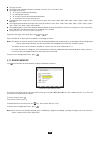
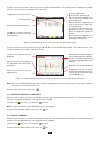
38 location in the record of the zone displayed. Selection of curves to be displayed. Instantaneous value of the signals according to the position of the cur- sor on the scale. To move the cursor use the or key. Move the cursor to one period of the signal before the transient trig- gering time. ...
Page 39
39 5.2. Inrush current mode still in the mode, the sub-mode is used to capture (record) inrush currents (voltage and current waveforms, network frequency, half-cycle rms voltages and currents except for the neutral) and to view and delete the recordings. When the inrush current mode is invoked: if...
Page 40
40 display in peak mode (see §5.2.4). Display in rms mode (see §5.2.3). Figure 43: the capture parameters screen if a capture duration is displayed in red, it means that it has been cut short: because of a power supply problem (battery low), or because the memory is full. or because of a measu...
Page 41
41 figure 45: the 3a rms display screen for a three-phase connection without neutral 5.2.3.3. The l1 rms display screen for a three-phase connection with neutral 5.2.3.2. The 3a rms display screen for a three-phase connection without neutral figure 46: the l1 rms display screen for a three-phase con...
Page 42
42 5.2.4. Instantaneous inrush current the peak mode is used to display the envelopes and waveforms of the inrush current capture. The peak display of an inrush current capture provides two possible representations: envelope waveform. The change from one of these representations to the other is ...
Page 44: 6. Harmonic
44 6. Harmonic the harmonic mode displays a representation of the harmonic levels of the voltage, current, and apparent power, order by order. It can be used to determine the harmonic currents produced by nonlinear loads and analyze problems caused by harmon- ics according to their order (overheatin...
Page 45
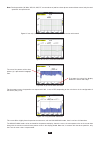
45 6.1.2. The l1 phase voltage harmonics display screen this information concerns the har- monic pointed to by the cursor. V-h03: harmonic number. %: level of harmonics with the fun- damental rms value as reference (%f) or the (total) rms value as reference (%r). V: rms voltage of the harmonic in qu...
Page 46
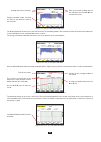
46 6.2.2. The l1 current harmonics display screen this information concerns the har- monic pointed to by the cursor. A-h05: harmonic number. %: level of harmonics with the fun- damental rms value as reference (%f) or the (total) rms value as reference (%r). A: rms current of the harmonic in question...
Page 47
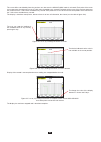
47 6.3.2. The l1 apparent power harmonics display screen this information concerns the har- monic pointed to by the cursor. Va-h03: harmonic number. %: level of harmonics with the fundamental apparent power as reference (%f) or the (total) apparent power as reference (%r). +000: phase shift of the v...
Page 48
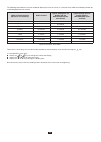
48 6.4.2. The l1 phase-to-phase voltage harmonics display screen this information concerns the har- monic pointed to by the cursor. Uh 03: harmonic number. %: level of harmonics with the fun- damental rms value as reference (%f) or the (total) rms value as reference (%r). V: rms voltage of the harmo...
Page 49
49 harmonics inducing a negative sequence. Harmonics inducing a zero se- quence. Harmonics inducing a positive se- quence. %: level of harmonics with the fun- damental rms value as reference (%f) or the (total) rms value as reference (%r). 6.5.2. The current expert mode display screen the a sub-menu...
Page 50: 7. Waveform
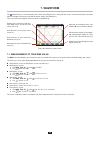
50 7. Waveform the waveform key is used to display the current and voltage curves, along with the values measured and those calculated from the voltages and currents (except for power, energy, and harmonics). This is the screen that appears when the device is powered up. Figure 62: waveform mode scr...
Page 51
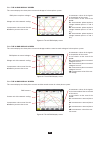
51 figure 63: the 3u rms display screen 7.1.2. The 4v rms display screen this screen displays the three phase-to-neutral voltages and the neutral-to-earth voltage of a three-phase system. Rms phase-to-phase voltages. Voltage axis with automatic scaling. Instantaneous value cursor. Use the or key...
Page 52
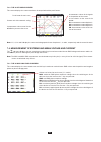
52 7.1.4. The rms display screen for the neutral this screen displays the neutral voltage with respect to earth and the neutral current. Current and voltage axis with auto- matic scaling. Rms voltage and current. Instantaneous values of the signals at the position of the cursor. T: time relative to ...
Page 53
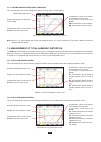
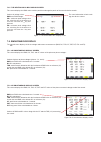
53 7.2.3. The 4a thd display screen this screen displays the phase current waveforms for one period and the total harmonic distortion values. Current axis with automatic scaling. Harmonic distortion for each curve. Instantaneous value cursor. Use the or key to move the cursor. Instantaneous valu...
Page 54
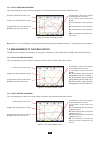
54 7.3.3. The 4a cf display screen this screen displays the current waveforms of one period and the peak factors. Figure 72: the 4a cf display screen note: l1, l2, l3 and n display the current and voltage peak factors for phases 1, 2 and 3, respectively and the neutral channel. 7.4. Measurement of e...
Page 55
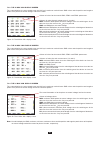
55 7.4.2. The 4v max.-min. Display screen this screen displays the one-second mean and half-cycle maximum and minimum rms values and the positive and negative peaks of the phase-to-neutral voltages and of the neutral. Columns of values for each voltage curve (1, 2 and 3). Max: maximum rms phase-to-n...
Page 56
56 column of voltage values. Rms: true rms voltage. Pk+: maximum peak voltage since the switching on of the device or since the last time the key was pressed. Pk-: minimum peak voltage since the switching on of the device or since the last time the key was pressed. The same information as for th...
Page 57
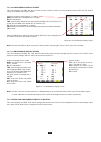
57 7.5.3. 4a simultaneous display screen this screen displays the rms, dc (only if at least one of the current sensors can measure direct current), thd, cf, fhl and fk values of the phase and neutral currents. Columns of current values (phases 1, 2 and 3). Rms: true rms value calculated over 1 secon...
Page 58
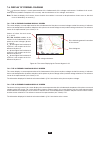
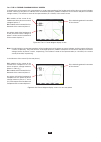
58 7.6. Display of fresnel diagram the sub-menu displays a vector representation of the fundamentals of the voltages and currents. It indicates their associ- ated quantities (modulus and phase of the vectors) and the unbalances of the voltages and currents. Note: to allow the display of all vectors,...
Page 61
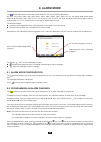
61 the campaign on standby message is displayed until the start time is reached. It is then replaced by the message campaign running . When the stop time is reached, the programming a campaign screen returns with the key. You can then program another campaign. During an alarm campaign, only the stop...
Page 62
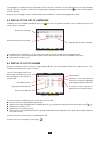
62 8.5. Deleting an alarm campaign when the list of campaigns performed is displayed (see figure 86), select the campaign to be erased. This is done by moving the cursor to it using the and keys. The selected campaign is bolded. Then press the key. Press to validate or to cancel. Note: it is n...
Page 63: 9. Trend Mode
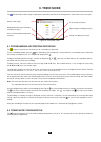
63 9. Trend mode the trend mode records changes to parameters previously specified in the configuration / trend mode screen (see §4.9). Figure 88: trend mode screen 9.1. Programming and starting recording the submenu specifies the characteristics of a recording (see figure 88). To start a recording ...
Page 64
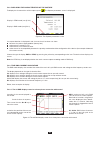
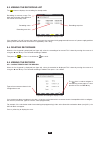
64 9.3. Viewing the recording list the submenu displays the recording list already made. Recording list memory usage. The black part of the bar corresponds to the fraction of memory used. Recording name. Recording start time. Recording stop time. Figure 89: recording list display screen if the stop ...
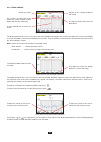
Page 65
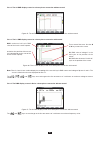
65 date of the cursor. Figure 91: vrms (4l) without min-avg-max the display period of this curve is one minute. Since the period of the record is one second, each point of this curve corresponds to a value recorded in a one-second window once a minute. There is therefore a substantial loss of inform...
Page 66
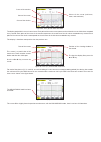
66 figure 94: vrms (n) with min-avg-max the display period of this curve is one minute. Each point of the mean curve represents the arithmetic mean of 60 values recorded every second. Each point of the curve of the maxima represents the maximum of the 60 values recorded every second. Each point of t...
Page 67
67 figure 97: tan Φ (l1) without min-avg-max for a three-phase connection with neutral figure 98: tan Φ (l1) with min-avg-max figure 99: w ( Σ) without min-avg-max for the energy curves, the quantities are expressed in wh, j, toe, or btu, depending on the unit chosen in the configuration of the devi...
Page 68
68 figure 101: wh ( Σ) without min-avg-max the display period of this bar chart is one minute. Since the recording period is one second, each bar of this bar chart represents a value recorded in a one-second window once a minute. The energy calculation mode determines the sum of the powers on the se...
Page 69
69 figure 105: cos Φ (l1) loading/calculation of values. The user can stop the loading of the recorded values at any time by pressing this key. The dashes indicate that the value is not available at the cursor position. Figure 106: cos Φ (l1) loading/calculation of values aborted. Display of the rec...
Page 70
70 the following table indicates the time needed to display the curve on screen as a function of the width of the display window for a recording period of one second: width of display window (60 points or increments) grid increment typical waiting time for display with the min-avg-max mode deactivat...
Page 71
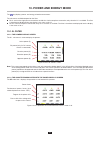
71 10. Power and energy mode the key displays power- and energy-related measurements. The sub-menus available depend on the filter. for 2- and 3-wire single-phase connections and for the 2-wire two-phase connection, only selection l1 is available. The filter is therefore not displayed, but the dis...
Page 72
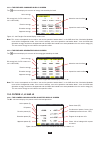
72 figure 111: the energies consumed display screen in 3l note: this screen corresponds to the choice “non-active quantities broken down” in the var tab of the calculation methods menu of the configuration mode. If the choice had been “non-active quantities not broken down”, then the vadh label (dis...
Page 73
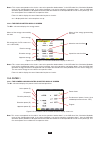
73 notes: this screen corresponds to the choice “non-active quantities broken down” in the var tab of the calculation methods menu of the configuration mode. If the choice had been “non-active quantities not broken down”, then the vad label (distortion power) would have disappeared and the var label...
Page 74
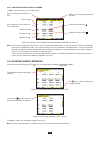
74 the start date and time of the energy metering. The icon is used to suspend the energy metering. Figure 117: the energy metering start-up screen in wh the blinking symbol indicates that energy metering is in progress. Figure 116: the sums of the energies consumed and generated display screen in Σ...
Page 75
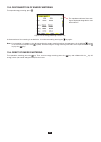
75 10.5. Disconnection of energy metering to suspend energy metering, press . The stop date and time of the meter- ing are displayed alongside the start date and time. Figure 119: the energy metering screen in toe a disconnection of the metering is not definitive. It can be resumed by pressing the k...
Page 76: 11. Screen Snapshot Mode
76 11. Screen snapshot mode the key can be used to take up to 50 screen snapshots and display the recorded snapshots. Saved screens may then be transferred to a pc using the pat application (power analyser transfer). 11.1. Screen snapshots press the key for approx. 3 seconds to shoot any screen . Wh...
Page 77: 12. Help Key
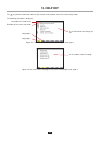
77 12. Help key the key provides information about the key functions and symbols used in the current display mode. The following information is displayed: figure 121: the help screen for the powers and energies mode, page 1 reminder of the mode used. Reminder of the current sub-mode. Help page 1. He...
Page 78: 13. Data Export Software
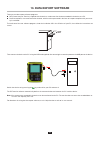
78 13. Data export software there are two data export software programs: pat (power analyser transfer), supplied with the device, used to transfer the data recorded in the device to a pc. dataview, optional, also used to transfer the data, which are then presented in the form of a report complia...
Page 79: 14. General Specifications
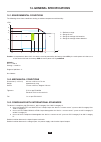
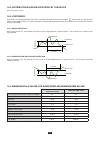
79 14. General specifications 14.1. Environmental conditions the following chart shows conditions relating to ambient temperature and humidity: 85 75 45 10 -20 0 20 26 35 42,5 50 70 °c 95 3 4 2 1 %rh 1 = reference range. 2 = range for use. 3 = range for storage with batteries. 4 = range for storage ...
Page 80
80 14.4. Electromagnetic compatibility emissions and immunity in an industrial setting compliant with iec 61326-1. 14.5. Power supply 14.5.1. Mains power supply this is a specific 600 v rms , category iv – 1000 v rms , category iii external mains power supply unit. Range of use: 230 v ± 10 % @ 50 hz...
Page 81
81 15. Functional characteristics 15.1. Reference conditions this table indicates the reference conditions of the quantities to be used by default in the characteristics indicated in § 15.3.4. Parameter reference conditions ambient temperature 23 ± 3 °c humidity (relative humidity) [45 %; 75 %] atmo...
Page 82
82 15.3.2. Current input characteristics operating range: [0 v ; 1 v] input impedance: 1 m w. Admissible overload: 1.7 v rms constant. Flex type current sensors (ampflex™ and miniflex) switch the current input to an integrator assembly (‘rogowski’ channel) capable of interpreting the signals from ro...
Page 83
83 quantities concerning currents and voltages measurement measurement range without ratio (with unity ratio) display resolution (with unity ratio) maximum intrinsic error minimum maximum frequency 40 hz 70 hz 0.01 hz ±(0.01 hz) rms voltage (5) simple 5 v 1,200 v (1) 0.1 v v ±(0.5 % + 0.2 v) 1 v v ≥...
Page 84
84 measurement measurement range without ratio (with unity ratio) display resolution (with unity ratio) maximum intrinsic error minimum maximum rms ½ voltage simple 5 v 1,200 v (1) 0.1 v v ±(0.8 % + 1 v) 1 v v ≥ 1,000 v compound 5 v 2,400 v (2) 0.1 v u ±(0.8 % + 1 v) 1 v u ≥ 1,000 v peak voltage sim...
Page 85
85 quantities concerning powers and energies measurement measurement range without ratio (with unity ratio) display resolution (with unity ratio) maximum intrinsic error minimum maximum active power (1) excluding flex 5 mw (3) 7,800 kw (4) 4 digits at most (5) ±(1 %) cos Φ ≥ 0.8 ±(1.5 % + 10 ct) 0.2...
Page 86
86 quantities associated with power measurement measurement range display resolution maximum intrinsic error minimum maximum phase differences of funda- mentals -179° 180° 1° ±(2°) cos Φ (dpf) -1 1 0.001 ±(1°) for Φ ±(5 ct) for dpf tan Φ -32.77 (1) 32.77 (1) 0.001 tan Φ ±(1°) for Φ 0.01 tan Φ ≥ 10 u...
Page 87
87 quantities concerning the spectral composition of the signals measurement measurement range display resolution maximum intrinsic error minimum maximum voltage harmonic ratio ( τ n ) 0 % 1500 %f 100 %r 0.1 % τ n ±(2.5 % + 5 ct) 1 % τ n ≥ 1000 % current harmonic ratio ( τ n ) (non-flex) 0 % 1500 %f...
Page 88
88 measurement measurement range (with unity ratio) display resolution (with unity ratio) maximum intrinsic error minimum maximum rms harmonic voltage (order n ≥ 2) simple 5 v 1200 v (1) 0.1 v v ±(2.5 % + 1 v) 1 v v ≥ 1000 v compound 5 v 2400 v (2) 0.1 v u ±(2.5 % + 1 v) 1 v u ≥ 1000 v rms harmonic ...
Page 89
89 severity of short-term flicker maximum intrinsic error of the short-term flicker severity measurement (pst) 120 v lamp 60 hz network 230 v lamp 50 hz network rectangular variations per minute (50% duty cycle) 1 pst ∈ [0.5 ; 4] ± 5% pst ∈ [0.5 ; 4] ± 5% 2 pst ∈ [0.5 ; 5] ± 5% pst ∈ [0.5 ; 5] ± 5% ...
Page 90
90 15.3.5. Current sensor characteristics (after linearization) sensor errors are offset by a typical correction inside the device. This typical correction, applied to the phase and amplitude, depends on the type of sensor connected (detected automatically) and the gain in the current acquisition ch...
Page 91: 16. Appendices
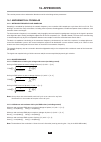
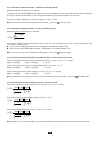
91 16. Appendices this section presents the mathematical formulae used in calculating various parameters. 16.1. Mathematical formulae 16.1.1. Network frequency and sampling sampling is controlled by (locked to) the network frequency so as to deliver 256 samples per cycle from 40 hz to 70 hz. This lo...
Page 92
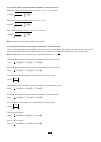
92 16.1.2.3. Severity of short-term flicker – 10 minutes (excluding neutral) method based on the iec61000-4-15 standard. The input values are half-period rms voltages (phase-to-neutral for distribution systems with neutral, phase-to-phase for distribu- tion systems without neutral). Blocks 3 and 4 a...
Page 93
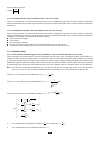
93 16.1.2.7. Rms values (neutral included except urms – over one second) rms phase-to-neutral voltage of phase (i+1) with i ∈ [0; 3] (i = 3 ⇔ neutral). [ ] [ ][ ] ∑ − = ⋅ = 1 0 2 1 vrms nechsec n n i v nechsec i rms phase-to-phase voltage of phase (i+1) with i ∈ [0 ; 2]. [ ] [ ][ ] ∑ − = ⋅ = 1 0 2 1...
Page 94
94 current unbalance (vector) + − arms arms = aunb 16.1.2.9. Fundamental rms values (excluding neutral – over one second) these are calculated from the filtered vector (instantaneous) values. A digital filter made up of 6 low-pass order 2 infinite pulse response butterworth filters and one high-pass...
Page 95
95 c o is the dc component. K is the index of the spectral spike (the order of the harmonic component is 4 k m = ). Note: the power harmonic factors are calculated by multiplying the phase-to-neutral voltage harmonic factors by the current harmonic factors. The power harmonic angles (vaharm[i][j] an...
Page 96
96 three-phase systems with neutral [ ][ ] [ ][ ] ∑ ∑ = = − + = 2 0 7 0 1 2 3 3 1 vharm i j i vharm j i vharm three-phase systems without neutral [ ][ ] [ ][ ] ∑ ∑ = = − + = 2 0 7 0 1 2 3 3 1 uharm i j i uharm j i uharm zero-sequence harmonics [ ][ ] [ ][ ] ∑ ∑ = = + = 2 0 7 0 0 1 3 3 3 1 aharm i j ...
Page 97
97 dc power of phase (i+1) with i ∈ [0 ; 2]. [ ] [ ] [ ] i adc i vdc i ⋅ = wdc apparent power of phase (i+1) with i ∈ [0; 2]. Reactive power of phase (i+1) with i ∈ [0; 2] (non-active quantities broken down). [ ] [ ] [ ][ ] ∑ − = ⋅ − ⋅ = = 1 0 ] 4 ][ [ 1 varf var nechsec n n i af nechper n i vf nech...
Page 98
98 reactive power, wattmeter 2 [ ] [ ][ ] ∑ − = ⋅ − − ⋅ = 1 0 1 ] 4 ][ 0 [ 1 1 varf nechsec n n af nechper n u f nechsec dc power, wattmeter 1 [ ] [ ] [ ] 2 2 0 wdc adc udc ⋅ = dc power, wattmeter 2 [ ] [ ] [ ] 1 0 1 wdc adc udc ⋅ − = b) reference in l2 active power, wattmeter 1 [ ] [ ][ ] [ ][ ] ∑ ...
Page 99
99 dc power, wattmeter 1 [ ] [ ] [ ] 0 2 0 wdc adc udc ⋅ − = dc power, wattmeter 2 [ ] [ ] [ ] 1 1 1 wdc adc udc ⋅ = d) calculation of the total quantities total active power [ ] [ ] [ ] 1 w 0 w 3 w + = total dc power [ ] [ ] [ ] 1 wdc 0 wdc 3 wdc + = total apparent power [ ] ] 2 [ ] 1 [ ] 0 [ ] 2 [...
Page 100
100 16.1.5. Power ratios (excluding neutral – over one second) a) distribution system with neutral power factor of phase (i+1) with i ∈ [0; 2]. Fundamental power factor of phase (i+1) or cosine of the angle of the phase-to-neutral voltage fundamental of phase (i+1) with respect to the current fundam...
Page 101
101 with : if reference on l1 [ ] [ ][ ] [ ][ ] [ ][ ] [ ][ ] ∑ ∑ − = − = ⋅ − ⋅ + ⋅ ⋅ = 1 0 1 0 1 0 1 2 2 1 3 w f nechsec n nechsec n n a n u nechsec n a n u nechsec if reference on l2 [ ] [ ][ ] [ ][ ] [ ][ ] [ ][ ] ∑ ∑ − = − = ⋅ − ⋅ + ⋅ ⋅ = 1 0 1 0 2 1 1 0 0 1 3 w f nechsec n nechsec n n a n u nec...
Page 102
102 16.1.6. Energies energies excluding neutral – over tint with refresh every second 16.1.6.1. Distribution system with neutral note: tint is the power integration time in energy calculations; the beginning and end of this period are user-controlled. Consumed dc energy of phase (i+1) with i ∈ [0; 2...
Page 103
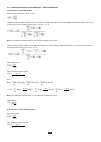
103 total consumed capacitive reactive energy (non-active quantities broken down – configuration >calculation methods >var) varhc[0][3] = varhc[0][0] + varhc[0][1] + varhc[0][2] total consumed distortion energy (non-active quantities broken down – configuration >calculation methods >var) vadh[0][3] ...
Page 104
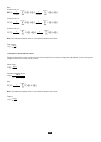
104 total generated inductive reactive energy (non-active quantities broken down – configuration >calculation methods >var) varhl[1][3] = varhl[1][0] + varhl[1][1] + varhl[1][2] total generated capacitive reactive energy (non-active quantities broken down – configuration >calculation methods >var) v...
Page 105
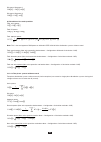
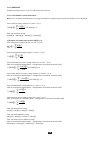
105 total consumed non-active energy (non-active quantities not broken down – configuration >calculation methods >var) [ ][ ] [ ][ ] ∑ = int 3600 0 varh t n n i var i b) total generated dc energy [ ][ ] [ ][ ] ∑ − = int 3600 1 wdch t n n i wdc i with wdc[i][n] c) total energies generated other than ...
Page 106
106 hyster esis maximum duration threshold return level hyster esis minimum duration return level threshold 16.4. Minimum scale values for waveforms and minimum rms values minimum scale value (waveform mode) minimum rms values phase-to-neutral and phase-to-phase voltages 8 v (1) 5 v (1) ampflex™ 90 ...
Page 107
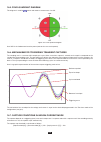
107 figure 123: four-quadrant diagram here var is the fundamental reactive power (and not the non-active power). 16.6. Mechanism for triggering transient captures the sampling rate is a constant 256 samples per cycle. When a transient capture is started, each sample is compared to the sample from th...
Page 108
108 here are the conditions for triggering and stopping captures: triggering filter triggering and stop conditions a1 triggering condition ⇔ [a1 half-cycle rms value] > [triggering threshold] stop condition ⇔ [a1 half-cycle rms value] a2 triggering condition ⇔ [a2 half-cycle rms value] > [triggering...
Page 109
109 fk k factor. Used to quantify the effect of a load on a transformer. Fhl harmonic loss factor. Flicker a visual effect of voltage variations. Frequency number of full voltage or current cycles in one second. Fundamental component: component at the fundamental frequency. G giga (10 9 ) harmonics ...
Page 110
110 vadh distortion energy. Vah apparent energy. Var reactive or non-active power. Varh reactive or non-active energy. Vcf peak factor of the voltage. Vd phase-to-neutral rms distortion voltage. Vdc phase-to-neutral dc voltage. Vpk+ maximum peak value of the phase-to-neutral voltage. Vpk- minimum pe...
Page 111: 17. Maintenance
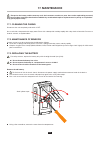
111 17. Maintenance except for the battery and the memory card, the instrument contains no parts that can be replaced by personnel who have not been specially trained and accredited. Any unauthorized repair or replacement of a part by an “equivalent” may gravely impair safety. 17.1. Cleaning the cas...
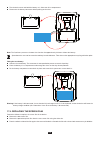
Page 112
112 turn the device over and hold the battery as it slides out of its compartment. disconnect the battery connector without pulling on the wires. Note: the qualistar+ preserves the date-time function for approximately 24 hours without the battery. Spent batteries must not be treated as ordinary ...
Page 113
113 17.5. Memory card before withdrawing or inserting the memory card, make sure that the device is disconnected and off. 17.6. Metrological check like all measuring or testing devices, the instrument must be checked regularly. This instrument should be checked at least once a year. For checking and...
Page 114: 18. Warranty
114 18. Warranty except as otherwise stated, our warranty is valid for three years starting from the date on which the equipment was sold. Extract from our general conditions of sale provided on request. The warranty does not apply in the following cases: inappropriate use of the equipment or use ...
Page 115: 19. To Order
115 19. To order 19.1. C.A 8335 three-phase electrical networks analyser c.A 8335 without clamp .......................................................................................................................................... P01160577 c.A 8335 mn ..............................................
Page 116
11 - 2012 code 692272d02 - ed. 1 http://www.Chauvin-arnoux.Com 190, rue championnet - 75876 paris cedex 18 - france tél. : +33 1 44 85 44 85 - fax : +33 1 46 27 73 89 - info@chauvin-arnoux.Fr export : tél. : +33 1 44 85 44 38 - fax : +33 1 46 27 95 59 - export@chauvin-arnoux.Fr deutschland - chauvin...

