D-Link DV-600P - D-View Professional Edition User Manual - Setting The Devices to Poll
Setting the Devices to Poll
To monitor the status of the devices, add the devices to the poll list. You can
also delete the devices if you no longer want to monitor the device status.
When the devices are added to the Poll list, the device icon color changes from
grey to green.
To configure the Poll List:
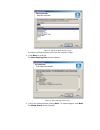
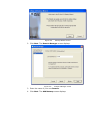
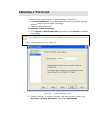
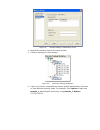
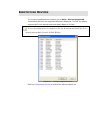
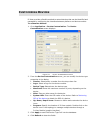
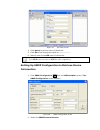
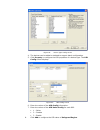
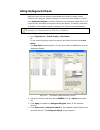
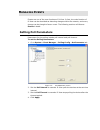
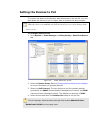
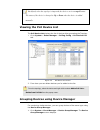
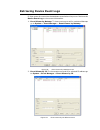
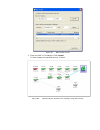
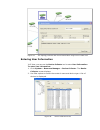
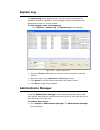
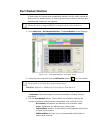
1. Go to System > Event Manager > Polling Config > Select Poll Device
tab.
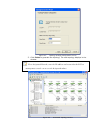
Figure 74:
Select Poll Device screen
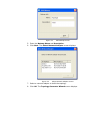
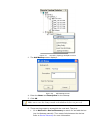
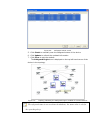
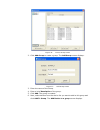
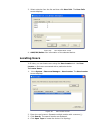
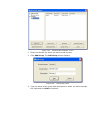
2. Select the Device Group. Refer to
Grouping Devices using Device Manager
for more information on grouping devices.
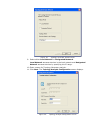
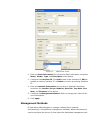
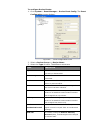
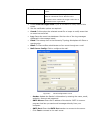
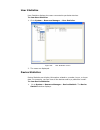
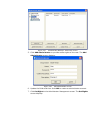
3. Select the Poll Protocol. The two options to poll the network devices
periodically are SNMP (Simple Network Management Protocol) and ICMP
(Internet Control Message Protocol). The default poll protocol is ICMP.
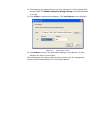
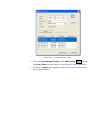
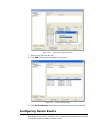
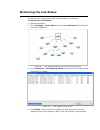
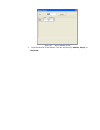
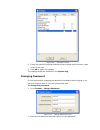
4. Select devices and then click Add to Poll to add to the poll list.
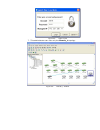
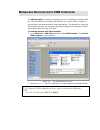
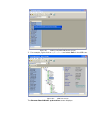
From the topology, select the device and right-click to select Add to Poll List or
Delete from Poll List from the popup menu.
Summary of DV-600P - D-View Professional Edition
Page 1
Network management system ver.1.00 standard / professional user manual.
Page 2
D-link corporation d-view 6.0 user manual published: january 2008 proprietary notice this document supports d-link network management system software. D-view 6.0 is confidential and proprietary information of d-link corporation. D-link may have patents, patent applications, trademarks, copyrights, o...
Page 3: Table of Contents
Table of contents 1. Introducing d-view 7 overview.............................................................................. 8 what’s included .................................................................................. 8 product line ..........................................................
Page 4
Creating administrator-specific topologies................................51 using topo export/import......................................................54 topology generator principle ..................................................55 using topology generator ......................................
Page 5
Net toolbox .....................................................................................115 port packet monitor...........................................................................116 performance monitor .........................................................................118 9. I...
Page 6: Scope
A bout this g uide scope use this document to learn, use, and configure the different features of d-view. Audience this document is written for network managers, system administrators, and/or it personnel who would need to work with d-view. Prerequisites before using this guide, read the d-view 6.0 ...
Page 7: Style Conventions
Style conventions the following style conventions are used in this guide. E lement m eaning bold font use for describing user interface elements and characters that you type into the interface. For example, hierarchy topology workplace and type http://192.168.1.1. Italic font variables for which you...
Page 8: Introducing D-View
Introducing d-view 7.
Page 9: What’S Included
O verview -link strives to provide easy-to-use devices and software for users. Networking is a core technology for data communication. Based on abundant experience and profound understanding on end-user network management requirements, d-link introduces d-view 6.0. D network administrators can now e...
Page 10
P roduct l ine there are two editions of d-view: • d-view 6.0 standard edition: d-view standard edition targets novice-intermediate users that have a small/mid-scale network of less than 1000 devices with basic requirements. Dbms: access 2000 operating system: windows xp, windows 2000 server or adva...
Page 11
The differences between the two editions are described in the following table: s tandard e dition p rofessional e dition standalone client-server single user login multiple user login supports nodes supports nodes >= 1000 supports microsoft access database supports sql database both editions use com...
Page 12: Upgrade
Upgrade to upgrade from d-view 5.1 or earlier versions to 6.0, uninstall all the programs related to the old version and then re-install the new version. Download the latest version of the user manual from dview.Dlink.Com.Tw for the added new features. Technical specifications mib utilities • device...
Page 13
• topology import / export • hierarchy topology manager • device type extension • web configuration • telnet configuration • tftp file transport • trace route • mac locator • ping • port packet monitor fault management tools • trap filter • trap log • ping poll filter • ping poll log • snmp poll fil...
Page 14: Installing D-View
Installing d-view 13.
Page 15
I nstallation s teps to install d-view 6.0 for both standard and professional edition, follow these procedures: for professional edition: prior to installation, ensure the environment on your designated server is compliant with the software requirements given below: • ensure the authentication mode ...
Page 16
Figure 3: license agreement screen 2. Click yes to proceed. The choose destination location screen displays. Figure 4: choose destination location screen 3. By default d-view is installed in c:\program files\d-link\d-view. Alternately, you can choose to install d-view in your preferred designated fo...
Page 17
Figure 5: select program folder screen the setup will add program icons into the program folder. 4. Click next to continue. The start copying files screen displays. Figure 6: start copying files screen 5. Verify the settings before clicking next. To make changes, click back. The setup status screen ...
Page 18
Figure 7: setup status screen 6. This screen indicates that d-view installation is in progress. To stop the installation, click cancel. Figure 8: setup status screen once d-view installation is successfully completed the welcome to the microsoft xml parser and sdk setup wizard window displays..
Page 19
Figure 9: welcome to the microsoft xml parser and sdk setup wizard 7. Click next to continue installing microsoft xml parser and sdk on your server. The end-user license agreement screen displays. Figure 10: end-user license agreement screen 8. Select i accept the terms in the license agreement and ...
Page 20
Figure 11: customer information screen 9. Enter the user name and the name of your organization. Click next to continue. The choose setup type screen displays. Figure 12: choose setup type screen 10. Use the customize option to select the program location. Click install now to continue with the inst...
Page 21
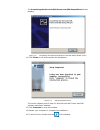
The completing the microsoft xml parser and sdk setup wizard screen displays. Figure 13: completing the microsoft xml parser and sdk setup wizard screen 11. Click finish to exit and complete the installation. Figure 14: setup complete screen the screen indicates that d-view 6.0 and microsoft xml par...
Page 22
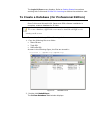
The login d-view screen displays. Refer to getting started to continue working with d-view and d-view 6.0 licensing to receive the activation code. To create a database (for professional edition) once d-view and microsoft xml parser and sdk software installation is complete, create a database for d-...
Page 23
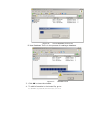
Figure 16: d-view database tool screen d-view database tool is in the process of creating a database. Figure 17: makedb screen 3. Click ok to close the window. 4. To edit information in the hosts file, go to: c:\winnt\system32\drivers\etc\hosts.
Page 24
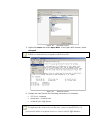
Figure 18: etc folder screen 5. Right-click hosts and select open with.In the open with window, select notepad. D-link recommends using notepad to edit the hosts file. Figure 19: hosts file screen 6. Update the host file with the following information, for example: • 127.0.0.1: localhost • dview-tes...
Page 25
D-view utilizes sql-server alias name to query the sql database, so therefore make sure the name entered is the same as the alias name. Ensure to add the ip address of your server in the hosts file. Check with the system administrator for the correct ip address of your server. 8. Restart your comput...
Page 26: D-V
D-v iew 6.0 l icensing trial version when you install d-view, the trial version is automatically installed and allows you to evaluate the product for a period of 30 days. During this 30-day period, d-link recommends you request a permanent license for d-view. For every single license key obtained, y...
Page 27
The input activation key screen displays. Figure 21: input activation key screen 3. Click register to open the registration website and update the information on-line. Option c start d-view, go to help>d-view activation wizard. Follow the steps accordingly to register for d-view..
Page 28: Understanding The
Understanding the architecture 27.
Page 29
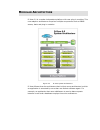
M odular a rchitecture d-view 6.0 is a vendor-independent platform with user plug-in modules. This new adaptive architecture comprises multiple components such as dbms access, basic and plug-in modules. Figure 22: d-view system architecture d-view follows three-tier architecture that is client-serve...
Page 30
F eatures with the addition of new features to d-view, administrators can now: • automatically create topology maps of device relationships. • graphically represent the real-time status of devices. • centrally manage multiple d-link devices. Administrators can view and manage multiple devices within...
Page 31
F unctions the following section briefly describes the various functions of d-view: • new device identifier: d-view constantly monitors the network for new devices. Once a device is plugged in, administrators can add the device into the topology. • database access component: provides interface to ac...
Page 32: Understanding The
Understanding the interface 31.
Page 33
I ntroduction d-view’s user interface provides access to all the views and tools from a single location. Figure 23: d-view user interface the key interface elements are: • domain: a subnetwork comprised of netmaps. Dividing the network into domains improves performance and security. • netmap: a netm...
Page 34: Context-Sensitive Menus
• system toolbar: use the system toolbar for quick access of the functional modules. • application toolbar: use the application toolbar for quick access of the functional modules. • topo manager toolbar: use the topo manager toolbar for quick access of the functional modules. • status area: provides...
Page 35
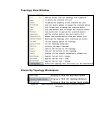
Topology view window figure 25: context-sensitive menu accessed from the topology view window hierarchy topology workspace figure 26: context-sensitive menu accessed from the hierarchy topology workspace.
Page 36: File
M ain m enu d-view’s main menu is the entry point for accessing most of the features. It runs along the top of the screen. This section briefly describes the available menu options. File the following table lists the file menu items and their descriptions. M enu i tem d escription save save the curr...
Page 37: View
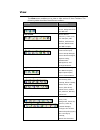
View the view menu enables you to view or hide various d-view toolbars. The following table describes the different toolbars. T oolbar d escription advanced toolbar access link capacity check, safeguard check and arp info. Net toolbar access device discovery, trace route, file transport, net toolbox...
Page 38: Application
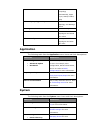
The network and create a topology automatically, upper layer, startup wizard, help hierarchy topology workspace access main menu, topology, and message board message board access message board cascade cascades the different topologies one behind the others tile vertically arranges the different topo...
Page 39: Nettools
Netmap • event viewer by ip • device group manager • polling config • device event config • trap editor information. Resource manager • mac locator • device locator • user locator • device collector • user statistic • device statistic locate devices using ip or mac address. System config configure t...
Page 40: Advanced
Port packet monitor monitor the port packet performance. Refer to port packet monitor for more information. Performance monitor monitor the rmon performance of a device. Refer to performance monitor for more information. Mib tools • mib compiler • mib browser manage and configure non d-link devices....
Page 41: Using D-View
Using d-view.
Page 42: Login D-View
G etting s tarted before proceeding with this section, d-link recommends you to get familiar with the user interface. Refer to introduction section. Login d-view after successfully installing d-view, type the default account and password for d-view. The default account is admin and the default passw...
Page 43: Domain Manager
Local authentication • the account and password information is stored in the d-view database. Radius authentication • the information is stored in the radius server database. • if the account and password information entered is valid, the server accepts the authentication and allows the administrato...
Page 44
Figure 29: startup wizard screen 2. Click next. The domain manager screen displays. Figure 30: domain manager screen 3. Enter the name of your new domain. 4. Click next. The add netmap screen displays..
Page 45
Figure 31: add netmap screen 5. Enter the netmap name and description. 6. Click next. The select network adapter screen displays. Figure 32: select network adapter screen 7. Select a network adapter to build the topology. 8. Click ok. The topology generator wizard screen displays..
Page 46
Figure 33: topology generator wizard screen 9. Select either local network or designated network. Local network accesses devices in the local network and designated network accesses devices by specifying the ip range. 10. Enter a name for topology generator analysis. 11. Click next. The topology ana...
Page 47
12. The topology generator analyzes the local network for the ip address and subnet mask. The snmp community string setting is by default defined in d-view. 13. Click finish to generate the topology. The topo export screen displays. Figure 35: topo export screen 14. Click export to export the genera...
Page 48: Working With
Working with topologies 47.
Page 49
C reating a t opology in d-view there are two ways to create a topology. They are: • using startup wizard: the wizard guides the users to create a topology. Refer to startup wizard create a topology. • create a topology manually to manually create a topology: 1. Go to system > domain manager and cre...
Page 50
Figure 37: hierarchy topology workplace screen 3. The add netmap screen displays. Figure 38: add netmap screen 4. Enter the name and description for the netmap. 5. Click ok. The database before you proceed. Make sure to save the changes made to 6. • een the devices. Refer to device discovery for mor...
Page 51
Figure 39: device discovery screen • from the topo manager toolbar, click add devices [ ]. Or use the copy/paste function. Refer to copy/paste for more information. • continue to export your topology. Refer to using topo export/import for more information..
Page 52
C reating a dministrator - specific t opologies d-view manages the entire topology in domain mode; administrators can create different topology maps to be managed by different administrators. Only the administrators in the super domain can manage the entire network. To create multiple topologies wit...
Page 53
Figure 41: domain manager: workstation screen 4. Repeat the previous step for the other domain. 5. Create a topology for each domain. Figure 42: hierarchy topology workplace 6. Login to d-view by using different domain-specific administrator accounts to view different topology maps. For example: cli...
Page 54
Figure 43: login screen 7. This administrator can view only the domain_1 topology. Figure 44: domain_1 window.
Page 55
U sing t opo e xport /i mport d-view allows you to export to or import from an xml file. Use this feature to make regular backups. To export or import topology information: 1. Go to application > topo export/import. The topo export/import screen displays. Figure 45: topo export/import screen 2. Sele...
Page 56
T opology g enerator p rinciple using arp (address resolution protocol) and forwarding table information in devices, d-view creates a topology for a specific network. The following steps describe the principle behind the topology generator: 1. Discovers the devices by getting the arp information in ...
Page 57
U sing t opology g enerator use the topology generator to create the topology map. To use the topology generator: 1. Go to nettools > topology generator. The topology generator wizard screen displays. Figure 46: topology generator wizard screen 4. K. The snmp community string setting is by default d...
Page 58
Figure 47: topology analysis configuration screen 5. Click finish to generate the topology. The new topology displays in the window. For a designated network, enter the ip address and ensure that the d-view management console can access the designated subnet. Figure 48: generated topology window.
Page 59
6. Go to topology > topo export or select and right click on the netmap of the generated topology to select topo export. Figure 49: topo export screen 7. Click export to export the generated topology..
Page 60: Using Rearrange Totally
R earranging the t opology manually rearranging multiple devices and links in a topology is a laborious and difficult process. But with d-view, you can: • rearrange totally • rearrange by step using rearrange totally open and select a device in the topology. Go to topology > rearrange totally. The s...
Page 61: Rolling Back A Topology
Rolling back a topology after rearranging the topology, you can restore the saved topology that was created initially from the database. To rollback a topology: go to topology > topology rollback. The topology reverts to the previous settings. The following screenshots displays the sequence of steps...
Page 62
Figure 51: sequence of steps displaying the topology rollback function.
Page 63: Managing and
Managing and monitoring devices 62.
Page 64
I dentifying d evices to view the installed device modules, go to help > devices supported. Information about all the supported devices is displayed. D-view, by default, supports all d-link devices that have been added to d-view. If you cannot find the device modules in the list, download and instal...
Page 65
M ulti - vendor s upport only the following modules can be used by third-party devices: • gensnmpdevicemodule: d-view recognizes snmp enabled devices irrespective of device type, vendor and model number. Refer to retrieving oid of the device for more information. • mib browser/compiler: the mib comp...
Page 66
C ustomizing d evices d-view provides a flexible method to extend devices that can be identified and managed by configuring the interface between platform and device module. To customize devices: 1. Go to application > device customization. The device customization screen displays. Figure 53: device...
Page 67: Mib
M anaging d evices with mib c ompiler the mib compiler is used for configuring non-d-link devices, through a mib file. The mib compiler translates the mib from its normal asn.1 format to a format that is comprehensible by other applications. The benefits of using the mib compiler are that you can qu...
Page 68
Figure 55: loading compiled mib module screen 3. For example, right-click on syslocation and select info in the mib tree. Figure 56: mib tree screen the browse result node: syslocation screen displays..
Page 69
Figure 57: set value screen 4. Click query to get the value of the device. 5. Click set to set change the value for syslocation. 6. Make a note of the oid value of the device. Use mib browser to browse mib files after compilation. Setting up snmp configuration to retrieve device information 1. Click...
Page 70
3. Enter the community string to access devices through snmp. If you select snmpv3, update the snmpv3-specific fields and access devices respectively. 4. Click ok and manage the selected device using mib compiler..
Page 71: Oid
R etrieving oid of the device to identify non d-link devices, the administrators must first retrieve the oid of the device and then customize them to add to d-view. Ensure the device is online to retrieve the oid of the device. To retrieve the oid of the device: 1. Go to nettools > mib tools > mib c...
Page 72
Figure 60: system infogensnmpdevicemodule screen 4. From the system infogensnmpdevicemodule screen, modify the device type properties in the dialog. • name: enter the name of the device. • contactor: enter the name of the user responsible for managing the device. • location: enter the location of th...
Page 73
B atch c onfiguration the batch configuration tool allows you to execute a sequence of operations in d-view. For example, save configuration, retrieve port status, and so on. With batch configuration you can configure multiple devices simultaneously. Since all the configurations are similar, only on...
Page 74
Figure 62: device type config screen 4. The devices can be added or deleted to support batch configuration. 5. Click property to configure the oid properties of a device type. The oid config screen displays. Figure 63: oid config screen 6. Enter the values of the oid config information. 7. Enter the...
Page 75
Backup and update the devices’ configuration use the batch tool to backup and update the devices’ configuration. 1. Go to application > batch config > run batch or right-click and select run batch from the popup menu after selecting the devices in the opened topology. The run batch screen displays. ...
Page 76
• operation: select the mode of operation- backup or update. • timeout: snmp timeout value. • run local tftp: select to use the tftp server tool provided by d-view. The d-link tftp server screen displays. 4. Click apply and monitor the running status of the tftp server. Figure 65: d-link tftp server...
Page 77: Using Device Type Check
Using device type check use device type check to check the network for new and updated devices. 1. Open the topology and select the device that needs to be monitored. Figure 66: generated topology window 2. Go to advanced > device type check. D-view scans the devices in the open topology. Figure 67:...
Page 78: Using Safeguard Check
Using safeguard check malicious hosts on the network could attack the switch through various methods (for example, packet flooding). To overcome this situation, d-view uses safeguard engine to protect switches from malicious traffic flood. This minimizes the workload of the switch during the attack....
Page 79
Figure 69: safeguard check screen 5. Click check to manually scan the safeguard status of the device. 6. Click update to refresh the updated information. 7. Click close to exit the window. The safeguard engine icon is displayed on the top left-hand corner of the device in the topology. Figure 70: to...
Page 80: Labeling Devices
Labeling devices there are two types of labels in d-view: • device label – used to label the device. Administrators can set what details should be displayed. • link label – used to label the connectors connecting two or more devices. By default, d-view displays the ip addresses under the device icon...
Page 81: Editing Device Information
Link label to change the link label, go to topology > link label and select a type. The following table lists the different types of link labels. D evice l abel d escription e xample link port displays the port number used to connected the two devices. Link speed displays the maximum connection spee...
Page 82
Figure 71: edit device screen 2. Enter the basic information for the device. Basic information comprises name, vendor, type, and description of the device. 3. Configure the interface ip. Click add to add a new interface ip, edit to update an existing interface ip, or delete to remove an existing int...
Page 83
Figure 72: device management method screen d-view includes the following methods for managing a device: • snmp v1/v2c: d-view will use device modules that support snmp v1/v2c to manage the device. • snmp v3: d-view will use device modules that support snmp v3 to manage the device. • telnet: d-view w...
Page 84: Setting Poll Parameters
M anaging e vents events are one of the core functions of d-view. In fact, the main function of d-view can be described as detecting changes within the network, and every change can be thought of as an event. The following sections will discuss events in detail. Setting poll parameters parameters fo...
Page 85: Setting The Devices to Poll
Setting the devices to poll to monitor the status of the devices, add the devices to the poll list. You can also delete the devices if you no longer want to monitor the device status. When the devices are added to the poll list, the device icon color changes from grey to green. To configure the poll...
Page 86: Viewing The Poll Device List
By default, when the topology is imported, the devices are in an unpoll status. The status of the device is changed to up or down when the device is added ma a nu lly. Viewing the poll device list the poll device list displays the list of devices after generating the topology. 1. Go to system > even...
Page 87
Figure 76: device group screen 2. Click add group to create a group. The add group screen displays. Figure 77: add group screen 3. Enter the name of the group. 4. Enter a brief description of the group. 5. Click add. The group is created. 6. Next, select devices from the device list you want to add ...
Page 88: Configuring Device Events
Figure 78: add device to group screen 7. Select the group from the list. 8. Click add. The devices are added to the group. Figure 79: device group screen 9. Click set community to change the read/write community of devices. Configuring device events after defining the poll list, configure the event ...
Page 89
To configure device events: 1. Go to system > event manager > device event config. The event configuration screen displays. Figure 80: event configuration screen 2. Select a device group or a device name. 3. Select the type of event. The different events are: trap indication up -> down the link betw...
Page 90
Self-defined trap device sends the private trap defined by the users. Threshold event device sends the trap message, when d-view detects a threshold event. Whenever the exceeded count reaches the trigger value then a threshold event is generated. 4. Enable filter this type event if you do not want t...
Page 91: Retrieving Device Event Logs
Retrieving device event logs d-view saves all events into the database as and when they occur. Retrieve the device event log to view event information. 1. Event viewer by netmap: to view events occurred for a selected netmap go to system > event manager > event viewer by netmap. Figure 82: event vie...
Page 92
3. From here, you can further filter the events. Select from the following to filter the events: o filter setting: administrators can set filters such as event type and level of severity. O device: select device information such as the ip address, vendor name and device type from the drop-down list....
Page 93: Defining Trap Information
Figure 85: event statistics: pie chart screen o pie chart: illustrates the event statistics by event type, manufacturer, severity and device type. Defining trap information d-view monitors device events by polling devices by sending icmp or snmp packets positively and using trap editor to retrieve t...
Page 94: Locating The Switch Port
Figure 86: trap editor screen 2. Check by device type to select the vendor name and device type from the drop-down list. 3. Enter the enterprise oid. Contact d-link support to obtain the trap oid. 4. Enter the specific num. The specific num associates with the specific trap action. The enterprise oi...
Page 95
Figure 87: mac locator screen 2. Enter the mac or ip address. Click locate. D-view locates the specified device, if found. Figure 88: specified device located in the topology using mac locator.
Page 96: Monitoring The Link Status
Monitoring the link status d-view lets you monitor and modify the link status in a topology. To monitor the link status: 1. Open the topology. 2. Go to topology > link label and then select link speed. The status of the links is displayed. Figure 89: the topology displays the link status of the devi...
Page 97
Figure 91: the topology displays the link status after the link capacity check by default, the link capacity is 100m when a link is created between devices. To modify the capacity value: 1. Go to topology > link manager > edit link. The edit link screen displays. Or in a topology, right-click on a l...
Page 98: Locating Devices
Locating devices in d-view, you can locate devices using the device locator tool. Use device locator to find devices in multiple topologies by entering the device name or ip address. 1. Go to system > resource manager > device locator. The device locator screen displays. Figure 93: device locator sc...
Page 99
Figure 94: the topology indicates the device located after using device locator tool entering user information in d-view, you can use the device collector tool to enter user information. To enter user information: 1. Go to system > resource manager > device collector. The device collector screen dis...
Page 100: Locating Users
3. Select a device from the list and then click user info. The user info screen displays. Figure 96: user information screen 4. Add/edit/delete user information of the selected device. Locating users in d-view, you can locate users using the user locator tool. Use user locator to find users connecte...
Page 101
User statistics user statistics displays the users connected to particular devices. To view user statistics: 1. Go to system > resource manager > user statistics. Figure 98: user statistics screen 2. The users are displayed. Device statistics device statistics can display information related to a ve...
Page 102
Figure 99: device statistic screen 2. View the devices in the domain. You can sort them by vendor, buyer,or buy date..
Page 103: Basic Operations
Basic operations 102.
Page 104: View Options
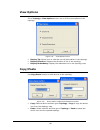
View options go to topology> view options to turn on or off the view options of the topology. Figure 100: view options screen • display tip: mouse over to view the net cell information in the topology. • display direction: displays the direction of link in the topology. • display redundancy: display...
Page 105: Zoom In / Out / Fit
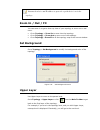
Rename the device and ip address to paste the copied device icon in the topology. Zoom in / out / fit you can zoom in to get a close-up view of your topology or zoom out to see > zoom in to zoom into the topology. • go to topology > zoom out to zoom out of the topology. . Set backgro more. • go to t...
Page 107
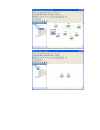
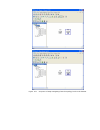
Figure 103: sequence of steps navigating from the topology level to the domain..
Page 108: System Log
System log the system log stores logged events. The log records events such as additions, deletions, updates or error messages. Helps users identify and diagnose the source of current system. To view logged events of the topology: go to system > system log. The system log screen displays. Figure 104...
Page 109
Figure 105: administrator manager screen 2. Select the domain for which you want to add a group. 3. Click add group. The add group screen displays. Figure 106: add group screen 4. Type the name of the group with description to which you want to assign this right and click add to continue..
Page 110
Figure 107: administrator manager: add group screen 5. Click add administrator to provide access rights to the user. The add administrator screen displays. Figure 108: add administrator screen 6. Update the fields and then click add to create an administrator account. 7. Click set rights in the admi...
Page 111
Figure 109: set rights screen 8. Check the specific functional modules boxes to assign rights (execute, read, write) to the user. 9. Click ok to apply the changes. The changes made are reflected in the system log. Changing password d-link recommends changing the password immediately after logging on...
Page 112
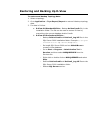
Restoring and backing up d-view to restore and backup topology data: 1. Select a topology. 2. Go to application > topo export/import to restore & backup topology data. 3. For data in d-view: a. D-view 6.0 standard edition - backup dvision3.Mdb file, in the installation folder. The file can be used t...
Page 113: Nettools
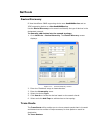
Nettools device discovery d-view identifies a snmp supporting device as a gensnmpdevice and an icmp supporting device as a nongensnmpdevice. Use the device discovery tool to search and identify the type of devices in the designated network. To manually add devices into the opened topology: 1. Go to ...
Page 114
Go to nettools > trace route to open the trace route function. Figure 112: trace route tool screen 1. Enter the host address and click run to trace the routers. 2. Select option to configure the icmp parameters. Figure 113: option screen 3. Modify and customize the ping buffer size, ping timeout and...
Page 115: Tftp
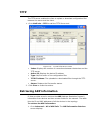
Tftp the tftp server enables the client to upload or download configuration files between the server and the client. 1. Go to nettools > tftp to call the tftp server tool. Figure 114: d-link tftp server screen • index: displays the number of connections between the devices and the tftp server • acti...
Page 116: Net Toolbox
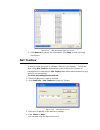
Figure 115: arp information retrieve screen 2. Click refresh to refresh the information. Click stop to stop retrieving information. Net toolbox d-view provides two ways to manage a device in the topology – telnet and web. Using net toolbox, administrators can configure the method of management for e...
Page 117: Port Packet Monitor
Port packet monitor d-view helps you monitor and troubleshoot switch ports for traffic, utilization and errors of a specific device. D-view pinpoints the port flow in real time and identifies their impact on the network. Ensure the devices support rfc1213 to monitor the port flow in devices. To moni...
Page 118
O indiscard: number of packets which are chosen to be discarded to prevent from entering the higher-layer protocol. O inerrors: number of error packets. O inunknown packets: number of unclassified/unknown packets discarded. O outucastpkts: number of out-going packets transmitted from higher-level pr...
Page 119: Performance Monitor
Grid data the grid data shows the packet flow in a table format. Click packet info to view the packet type options. Figure 119: port packet monitor: grid data screen performance monitor the performance monitor tool is a comprehensive bandwidth performance nitor management application that allows you...
Page 120
Figure 120: performance monitor screen 2. Select the ports and then click the errors ratio button from the toolbar. The graph displays a list of different types of error packets. 3. Set the port packet options. These values are calculated tracking the number of packets received over a period of time...
Page 121
Line chart the statistical graph (x-y) shows the usage of packets of a specified device in real time. • port index: displays the number of ports of a specific device. • port speed: displays the link speed between devices. • max/min value: displays the maximum/minimum number of packet flow in real ti...
Page 122
Figure 122: performance monitor: grid data screen data distribution chart the data distribution chart monitors packet types of different sizes received by their designated ports. 1. Click the data distribution button from the toolbar. The data distribution chart screen displays. Figure 123: performa...
Page 123
• 512~1023octets: total number of packets received, between 512 and 1023 octets in length. • 1024~1518octets: total number of packets received, between 1024 and 1518 octets in length. Port flow chart the port flow chart retrieves the statistical performance data to monitor the designated ports’ perf...
Page 124: Index
Index.
Page 125
I ndex activating, 41 administrator manager, 107 advanced option, 72 arp information retrieve, 114 batch configuration, 72 capacity value, 96 cold start, 88 config file manager, 74 device collector, 98 device customization, 65 device discovery, 112 device event config, 88 device event log, 90 device...
Page 126: Technical Support
Technical support.
Page 127: Technical Support
Technical support you can find software updates and user documentation on the d-link website. Tech support for customers in australia: tel: 1300-766-868 monday to friday 8:00am to 8:00pm est saturday 9:00am to 1:00pm est http://www.Dlink.Com.Au e-mail: support@dlink.Com.Au india: tel: 1800-222-002 m...
Page 128: Technical Support
Technical support you can find software updates and user documentation on the d-link website. Tech support for customers in egypt: tel: +202-2919035 or +202-2919047 sunday to thursday 9:00am to 5:00pm http://support.Dlink-me.Com e-mail: amostafa@dlink-me.Com iran: tel: +98-21-88822613 sunday to thur...
Page 129
Техническая поддержка Обновления программного обеспечения и документация доступны на Интернет-сайте d-link. D-link предоставляет бесплатную поддержку для клиентов в течение гарантийного срока. Клиенты могут обратиться в группу технической поддержки d-link по телефону или через Интернет. Техническая ...
Page 130: Asistencia Técnica
Asistencia técnica d-link latin américa pone a disposición de sus clientes, especificaciones, documentación y software mas reciente a través de nuestro sitio web www.Dlinkla.Com el servicio de soporte técnico tiene presencia en numerosos países de la región latino américa, y presta asistencia gratui...
Page 131: Suporte Técnico
Suporte técnico você pode encontrar atualizações de software e documentação de usuário no site da d-link brasil www.Dlinkbrasil.Com.Br. A d-link fornece suporte técnico gratuito para clientes no brasil durante o período de vigência da garantia deste produto. Suporte técnico para clientes no brasil: ...
Page 132
D-link 友訊科技 台灣分公司 技術支援資訊 如果您還有任何本使用手冊無法協助您解決的產品相關問題,台灣 地區用戶可以透過我們的網站、電子郵件或電話等方式與d-link台灣 地區技術支援工程師聯絡。 d-link 免付費技術諮詢專線 0800-002-615 服務時間:週一至週五,早上8:30 到 晚上9:00 (不含周六、日及國定假日) 網 站:http://www.Dlink.Com.Tw 電子郵件:dssqa_service@dlink.Com.Tw 如果您是台灣地區以外的用戶,請參考d-link網站 全球各地 分公司的聯絡資訊以取得相關支援服務。 產品保固期限、台灣區維修據點查詢,...
Page 133: Dukungan Teknis
Dukungan teknis update perangkat lunak dan dokumentasi pengguna dapat diperoleh pada situs web d-link. Dukungan teknis untuk pelanggan: dukungan teknis d-link melalui telepon: tel: +62-21-5731610 dukungan teknis d-link melalui internet: email : support@dlink.Co.Id website : http://support.Dlink.Co.I...
Page 134: Technical Support
Technical support you can find software updates and user documentation on the d-link websites. If you require product support, we encourage you to browse our faq section on the web site before contacting the support line. We have many faq’s which we hope will provide you a speedy resolution for your...
Page 135: Technische Unterstützung
Technische unterstützung aktualisierte versionen von software und benutzerhandbuch finden sie auf der website von d-link. D-link bietet kostenfreie technische unterstützung für kunden innerhalb deutschlands, Österreichs, der schweiz und osteuropas. Unsere kunden können technische unterstützung über ...
Page 136: Assistance Technique
Assistance technique vous trouverez la documentation et les logiciels les plus récents sur le site web d-link. Vous pouvez contacter le service technique de d-link par notre site internet ou par téléphone. Support technique destiné aux clients établis en france: assistance technique d-link par télép...
Page 137: Asistencia Técnica
Asistencia técnica puede encontrar las últimas versiones de software así como documentación técnica en el sitio web de d-link. D-link ofrece asistencia técnica gratuita para clientes residentes en españa durante el periodo de garantía del producto. Asistencia técnica de d-link por teléfono: +34 902 ...
Page 138: Technical Support
Technical support you can find software updates and user documentation on the d-link website. D-link provides free technical support for customers within benelux for the duration of the warranty period on this product. Benelux customers can contact d-link technical support through our website, or by...
Page 139: Pomoc Techniczna
Pomoc techniczna najnowsze wersje oprogramowania i dokumentacji użytkownika można znaleźć w serwisie internetowym firmy d-link. D-link zapewnia bezpłatną pomoc techniczną klientom w polsce w okresie gwarancyjnym produktu. Klienci z polski mogą się kontaktować z działem pomocy technicznej firmy d-lin...
Page 140: Technikai Támogatás
Technikai támogatás meghajtó programokat és frissítéseket a d-link magyarország weblapjáról tölthet le. Telefonon technikai segítséget munkanapokon hétfőtől-csütörtökig 9.00 – 16.00 óráig és pénteken 9.00 – 14.00 óráig kérhet a (1) 461-3001 telefonszámon vagy a support@dlink.Hu emailcímen. Magyarors...
Page 141: Teknisk Support
Teknisk support du finder software opdateringer og bruger- dokumentation på d-link’s hjemmeside. D-link tilbyder gratis teknisk support til kunder i danmark i hele produktets garantiperiode. Danske kunder kan kontakte d-link’s tekniske support via vores hjemmeside eller telefonisk. D-link teknisk su...
Page 142: Teknisk Support
Teknisk support på vår hemsida kan du hitta mer information om mjukvaru uppdateringar och annan användarinformation. D-link tillhandahåller teknisk support till kunder i sverige under hela garantitiden för denna produkt. Teknisk support för kunder i sverige: d-link teknisk support via telefon: 0770-...
Page 143
Τεχνική Υποστήριξη Μπορείτε να βρείτε software updates και πληροφορίες για τη χρήση των προϊόντων στις ιστοσελίδες της d-link Η d-link προσφέρει στους πελάτες της δωρεάν υποστήριξη στον Ελλαδικό χώρο Μπορείτε να επικοινωνείτε με το τμήμα τεχνικής υποστήριξης μέσω της ιστοσελίδας ή μέσω τηλεφώνου Για...


