- DL manuals
- H3C
- Network Router
- R6600
- Configuration Manual
H3C R6600 Configuration Manual
Summary of R6600
Page 1
H3c sr6600/sr6600-x routers network management and monitoring configuration guide(v7) hangzhou h3c technologies co., ltd. Http://www.H3c.Com software version: sr6602x-cmw710-r7103 sr6600x-cmw710-r7103-rse3 sr6600-cmw710-r7103-rpe3 document version: 20150715-6pw100
Page 2
Copyright © 2007-2015, hangzhou h3c technologies co., ltd. And its licensors all rights reserved no part of this manual may be reproduced or transmitted in any form or by any means without prior written consent of hangzhou h3c technologies co., ltd. Trademarks h3c, , h3cs, h3cie, h3cne, aolynk, , h ...
Page 3
Preface the h3c sr6600/sr6600-x documentation set includes 14 configuration guides, which describe the software features for the h3c sr6600/sr6600-x routers and guide you through the software configuration procedures. These configuration guides also provide configuration examples to help you apply s...
Page 4
Bars, from which you select one choice, multiple choices, or none. & the argument or keyword and argument combination before the ampersand (&) sign can be entered 1 to n times. # a line that starts with a pound (#) sign is comments. Gui conventions convention description boldface window names, butto...
Page 5
Represents a security card, such as a firewall, load balancing, netstream, ssl vpn, ips, or acg card. Port numbering in examples the port numbers in this document are for illustration only and might be unavailable on your device. About the h3c sr6600/sr6600-x documentation set the h3c sr6600/sr6600-...
Page 6
[technical support & documents > software download] – provides the documentation released with the software version. Technical support service@h3c.Com http://www.H3c.Com documentation feedback you can e-mail your comments about product documentation to info@h3c.Com. We appreciate your comments..
Page 7
I contents using ping, tracert, and system debugging ··············································································································· 1 ping ································································································································...
Page 8
Ii nqa configuration examples ······································································································································ 38 icmp echo operation configuration example ··························································································...
Page 9
Iii ntp multicast mode configuration example ················································································································ 94 ipv6 ntp multicast mode configuration example ·····························································································...
Page 10
Iv ptp configuration example (ieee 802.1as) ·············································································································· 138 configuring network synchronization ·········································································································...
Page 11
V configuring snmp notifications ································································································································· 164 enabling snmp notifications ·········································································································...
Page 12
Vi displaying and maintaining kernel threads ······································································································ 198 configuring samplers ·······························································································································...
Page 13
Vii ipv6 netstream configuration task list ······················································································································· 228 enabling ipv6 netstream ·············································································································...
Page 14
Viii configuration prerequisites ········································································································································· 261 configuring the flow log version ····························································································...
Page 15
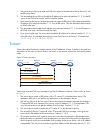
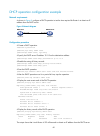
1 using ping, tracert, and system debugging this chapter covers ping, tracert, and information about debugging the system. Ping use the ping utility to determine if an address is reachable. Ping sends icmp echo requests (echo-request) to the destination device. Upon receiving the requests, the desti...
Page 16
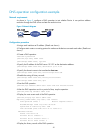
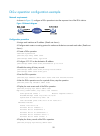
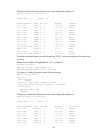
2 figure 1 network diagram configuration procedure # use the ping command on device a to test connectivity to device c. Ping 1.1.2.2 (1.1.2.2): 56 data bytes, press ctrl_c to break 56 bytes from 1.1.2.2: icmp_seq=0 ttl=254 time=2.137 ms 56 bytes from 1.1.2.2: icmp_seq=1 ttl=254 time=2.051 ms 56 byte...
Page 17
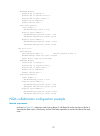
3 1. The source device (device a) sends an icmp echo request to the destination device (device c) with the rr option blank. 2. The intermediate device (device b) adds the ip address of its outbound interface (1.1.2.1) to the rr option of the icmp echo request, and forwards the packet. 3. Upon receiv...
Page 18
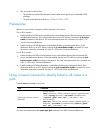
4 6. The source device thinks that: { the packet has reached the destination device after receiving the port-unreachable icmp message. { the path to the destination device is 1.1.1.2 to 1.1.2.2 to 1.1.3.2. Prerequisites before you use a tracert command, perform the tasks in this section. For an ipv4...
Page 19
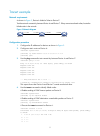
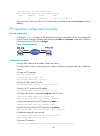
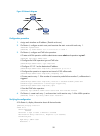
5 tracert example network requirements as shown in figure 3 , device a failed to telnet to device c. Test the network connectivity between device a and device c. If they cannot reach each other, locate the failed nodes in the network. Figure 3 network diagram configuration procedure 1. Configure the...
Page 20
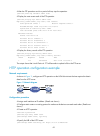
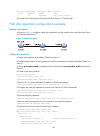
6 5 the output shows that device a can reach device b but cannot reach device c. An error has occurred on the connection between device b and device c. 5. Use the debugging ip icmp command on device a and device c to verify that they can send and receive the specific icmp packets. Or use the display...
Page 21
7 debugging a feature module output of debugging commands is memory intensive. To guarantee system performance, enable debugging only for modules that are in an exceptional condition. When debugging is complete, use the undo debugging all command to disable all the debugging functions. To debug a fe...
Page 22
8 configuring nqa overview network quality analyzer (nqa) allows you to measure network performance, verify the service levels for ip services and applications, and troubleshoot network problems. It provides the following types of operations: • icmp echo. • dhcp. • dns. • ftp. • http. • udp jitter. ...
Page 23
9 • a udp jitter or a voice operation sends a number of probe packets. The number of probe packets is set by using the probe packet-number command. • an ftp operation uploads or downloads a file. • an http operation gets a web page. • a dhcp operation gets an ip address through dhcp. • a dns operati...
Page 24
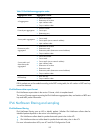
10 threshold monitoring threshold monitoring enables the nqa client to take a predefined action when the nqa operation performance metrics violate the specified thresholds. Table 1 describes the relationships between performance metrics and nqa operation types. Table 1 performance metrics and nqa op...
Page 25
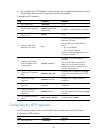
11 to configure the nqa server: step command remarks 1. Enter system view. System-view n/a 2. Enable the nqa server. Nqa server enable by default, the nqa server is disabled. 3. Configure a tcp or udp listening service. • tcp listening service: nqa server tcp-connect ip-address port-number [ vpn-ins...
Page 26
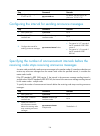
12 tasks at a glance (optional.) configuring threshold monitoring (optional.) configuring the nqa statistics collection function (optional.) configuring the saving of nqa history records (required.) scheduling the nqa operation on the nqa client configuring the icmp echo operation the icmp echo oper...
Page 27
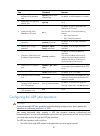
13 step command remarks 8. (optional.) specify the source ip address of icmp echo requests. • specify the ip address of the specified interface as the source ip address: source interface interface-type interface-number • specify the source ip address: source ip ip-address by default, no source ip ad...
Page 28
14 step command remarks 6. (optional.) specify the source ip address of dhcp request packets. Source ip ip-address by default, no source ip address is specified for the request packets. The requests take the ip address of the output interface as their source ip address. The specified source ip addre...
Page 29
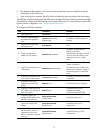
15 • use a small file for the ftp operation. A big file might result in transfer failure because of timeout, or might affect other services for occupying much network bandwidth. To configure the ftp operation: step command remarks 1. Enter system view. System-view n/a 2. Create an nqa operation and ...
Page 30
16 step command remarks 2. Create an nqa operation and enter nqa operation view. Nqa entry admin-name operation-tag by default, no nqa operation is created. 3. Specify the http type and enter its view. Type http n/a 4. Specify the url of the destination http server. Url url by default, no url is spe...
Page 31
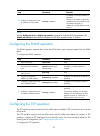
17 2. The destination device takes a time stamp to each packet that it receives, and then sends the packet back to the nqa client. 3. Upon receiving the responses, the nqa client calculates the jitter according to the time stamps. The udp jitter operation requires both the nqa server and the nqa cli...
Page 32
18 step command remarks 12. (optional.) specify the source ip address for udp packets. Source ip ip-address by default, no source ip address is specified. The source ip address must be the ip address of a local interface, and the interface must be up. Otherwise, no udp packets can be sent out. Note:...
Page 33
19 step command remarks 1. Enter system view. System-view n/a 2. Create an nqa operation and enter nqa operation view. Nqa entry admin-name operation-tag by default, no nqa operation is created. 3. Specify the tcp type and enter its view. Type tcp n/a 4. Specify the destination address of tcp packet...
Page 34
20 step command remarks 5. Specify the destination port of udp packets. Destination port port-number by default, no destination port number is specified. The destination port number must be the same as the port number of the listening service on the nqa server. 6. (optional.) specify the payload siz...
Page 35
21 step command remarks 4. Specify the destination address of udp packets. Destination ip ip-address by default, no destination ip address is configured. 5. (optional.) specify the destination port of udp packets. Destination port port-number by default, the destination port number is 33434. This po...
Page 36
22 configuring the voice operation caution: to ensure successful voice operations and avoid affecting existing services, do not perform the operations on well-known ports from 1 to 1023. The voice operation measures voip network performance. The voice operation works as follows: 1. The nqa client se...
Page 37
23 step command remarks 4. Specify the destination address of voice packets. Destination ip ip-address by default, no destination ip address is configured. The destination ip address must be the same as the ip address of the listening service on the nqa server. 5. Specify the destination port of voi...
Page 38
24 configuring the dlsw operation the dlsw operation measures the response time of a dlsw device. To configure the dlsw operation: step command remarks 1. Enter system view. System-view n/a 2. Create an nqa operation and enter nqa operation view. Nqaentry admin-name operation-tag by default, no nqa ...
Page 39
25 step command remarks 5. (optional.) specify the payload size in each icmp echo request. Data-size size the default setting is 100 bytes. 6. (optional.) specify the string to be filled in the payload of each icmp echo request. Data-fill string the default setting is the hexadecimal number 00010203...
Page 40
26 step command remarks 5. Specify the interval at which the nqa operation repeats. Frequency interval for a voice or path jitter operation, the default setting is 60000 milliseconds. For other operations, the default setting is 0 milliseconds. Only one operation is performed. If the operation is no...
Page 42
28 the state of a reaction entry can be invalid, over-threshold, or below-threshold. • before an nqa operation starts, the reaction entry is in invalid state. • if the threshold is violated, the state of the entry is set to over-threshold. Otherwise, the state of the entry is set to below-threshold....
Page 44
30 configuring the nqa statistics collection function nqa forms statistics within the same collection interval as a statistics group. To display information about the statistics groups, use the display nqa statistics command. Nqa does not generate any statistics group for the operation that runs onc...
Page 45
31 step command remarks 4. Enable the saving of history records for the nqa operation. History-record enable by default, this function is enabled only for the udp tracert operation. 5. (optional.) set the lifetime of history records. History-record keep-time keep-time the default setting is 120 minu...
Page 46
32 configuring the icmp template a feature that uses the icmp template performs the icmp operation to measure the reachability of a destination device. The icmp template is supported in both ipv4 and ipv6 networks. To configure the icmp template: step command remarks 1. Enter system view. System-vie...
Page 47
33 to configure the dns template: step command remarks 1. Enter system view. System-view n/a 2. Create a dns template and enter dns template view. Nqa template dns name n/a 3. (optional.) specify the destination ipv4 or ipv6 address of dns packets. • ipv4 address: destination ip ip-address • ipv6 ad...
Page 48
34 step command remarks 1. Enter system view. System-view n/a 2. Create a tcp template and enter its view. Nqa template tcp name n/a 3. (optional.) specify the destination ipv4 or ipv6 address of the operation. • ipv4 address: destination ip ip-address • ipv6 address: destination ipv6 ipv6-address b...
Page 49
35 step command remarks 1. Enter system view. System-view n/a 2. Create an http template and enter its view. Nqa template http name n/a 3. Specify the url of the destination http server. Url url by default, no url is specified for the destination http server. Enter the url in one of the following fo...
Page 50
36 configure the username and password for the ftp client to log in to the ftp server before you perform an ftp operation. For information about configuring the ftp server, see fundamentals configuration guide. To configure the ftp template: step command remarks 1. Enter system view. System-view n/a...
Page 52
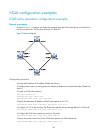
38 nqa configuration examples icmp echo operation configuration example network requirements as shown in figure 7 , configure an icmp echo operation from the nqa client device a to device b to test the round-trip time. The next hop of device a is device c. Figure 7 network diagram configuration proc...
Page 53
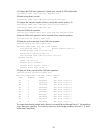
39 # configure the icmp echo operation to repeat at an interval of 5000 milliseconds. [devicea-nqa-admin-test1-icmp-echo] frequency 5000 # enable saving history records. [devicea-nqa-admin-test1-icmp-echo] history-record enable # configure the maximum number of history records that can be saved as 1...
Page 54
40 dhcp operation configuration example network requirements as shown in figure 8 , configure a dhcp operation to test the time required for router a to obtain an ip address from the dhcp server. Figure 8 network diagram configuration procedure # create a dhcp operation. System-view [routera] nqa en...
Page 55
41 dns operation configuration example network requirements as shown in figure 9 , configure a dns operation to test whether device a can perform address resolution through the dns server and test the resolution time. Figure 9 network diagram configuration procedure # assign each interface an ip add...
Page 56
42 [devicea] display nqa history admin test1 nqa entry (admin admin, tag test) history records: index response status time 1 62 succeeded 2011-11-10 10:49:37.3 the output shows that it took device a 62 milliseconds to translate domain name host.Com into an ip address. Ftp operation configuration exa...
Page 57
43 # after the ftp operation runs for a period of time, stop the operation. [devicea] undo nqa schedule admin test1 # display the most recent result of the ftp operation. [devicea] display nqa result admin test1 nqa entry (admin admin, tag test1) test results: send operation times: 1 receive respons...
Page 58
44 # configure the http operation to get data from the http server. [devicea-nqa-admin-test1-http] operation get # configure the operation to use http version 1.0. [devicea-nqa-admin-test1-http] version v1.0 # enable the saving of history records. [devicea-nqa-admin-test1-http] history-record enable...
Page 59
45 configuration procedure 1. Assign each interface an ip address. (details not shown.) 2. Configure static routes or a routing protocol to make sure the devices can reach each other. (details not shown.) 3. Configure device b: # enable the nqa server. System-view [deviceb] nqa server enable # confi...
Page 60
46 positive sd average: 10 positive ds average: 10 positive sd square-sum: 754 positive ds square-sum: 460 min negative sd: 1 min negative ds: 6 max negative sd: 13 max negative ds: 22 negative sd number: 4 negative ds number: 5 negative sd sum: 38 negative ds sum: 52 negative sd average: 10 negativ...
Page 61
47 min sd delay: 7 min ds delay: 7 number of sd delay: 410 number of ds delay: 410 sum of sd delay: 3705 sum of ds delay: 3891 square-sum of sd delay: 45987 square-sum of ds delay: 49393 sd lost packets: 0 ds lost packets: 0 lost packets for unknown reason: 0 snmp operation configuration example net...
Page 62
48 # display the most recent result of the snmp operation. [devicea] display nqa result admin test1 nqa entry (admin admin, tag test1) test results: send operation times: 1 receive response times: 1 min/max/average round trip time: 50/50/50 square-sum of round trip time: 2500 last succeeded probe ti...
Page 63
49 [devicea-nqa-admin-test1] type tcp # configure 10.2.2.2 as the destination ip address and port 9000 as the destination port. [devicea-nqa-admin-test1-tcp] destination ip 10.2.2.2 [devicea-nqa-admin-test1-tcp] destination port 9000 # enable the saving of history records. [devicea-nqa-admin-test1-t...
Page 64
50 configuration procedure 1. Assign each interface an ip address. (details not shown.) 2. Configure static routes or a routing protocol to make sure the devices can reach each other. (details not shown.) 3. Configure device b: # enable the nqa server. System-view [deviceb] nqa server enable # confi...
Page 65
51 udp tracert operation configuration example network requirements as shown in figure 16 , configure a udp tracert operation to determine the routing path from device a to device b. Figure 16 network diagram configuration procedure 1. Assign an ip address to each interface. (details not shown.) 2. ...
Page 66
52 # display the most recent result of the udp tracert operation. [devicea] display nqa result admin test1 nqa entry (admin admin, tag test1) test results: send operation times: 6 receive response times: 6 min/max/average round trip time: 1/1/1 square-sum of round trip time: 1 last succeeded probe t...
Page 67
53 # configure a listening service to listen on ip address 10.2.2.2 and udp port 9000. [deviceb] nqa server udp-echo 10.2.2.2 9000 4. Configure device a: # create a voice operation. System-view [devicea] nqa entry admin test1 [devicea-nqa-admin-test1] type voice # configure 10.2.2.2 as the destinati...
Page 68
54 sum of sd delay: 343 sum of ds delay: 985 square-sum of sd delay: 117649 square-sum of ds delay: 970225 sd lost packets: 0 ds lost packets: 0 lost packets for unknown reason: 0 voice scores: mos value: 4.38 icpif value: 0 # display the statistics of the voice operation. [devicea] display nqa stat...
Page 69
55 dlsw operation configuration example network requirements as shown in figure 18 , configure a dlsw operation to test the response time of the dlsw device. Figure 18 network diagram configuration procedure # assign each interface an ip address. (details not shown.) # configure static routes or a r...
Page 70
56 nqa entry (admin admin, tag test1) history records: index response status time 1 19 succeeded 2011-11-22 10:40:27.7 the output shows that the response time of the dlsw device is 19 milliseconds. Path jitter operation configuration example network requirements as shown in figure 19 , configure a p...
Page 71
57 extended results failures due to timeout: 0 failures due to internal error: 0 failures due to other errors: 0 packets out of sequence: 0 packets arrived late: 0 path-jitter results jitter number: 9 min/max/average jitter: 1/10/4 positive jitter number: 6 min/max/average positive jitter: 1/9/4 sum...
Page 72
58 figure 20 network diagram configuration procedure 1. Assign each interface an ip address. (details not shown.) 2. On router a, configure a static route, and associate the static route with track entry 1. System-view [routera] ip route-static 10.1.1.2 24 10.2.1.1 track 1 3. On router a, configure ...
Page 73
59 # display brief information about active routes in the routing table on router a. [routera] display ip routing-table destinations : 13 routes : 13 destination/mask proto pre cost nexthop interface 0.0.0.0/32 direct 0 0 127.0.0.1 inloop0 10.1.1.0/24 static 60 0 10.2.1.1 ge2/0/1 10.2.1.0/24 direct ...
Page 74
60 127.0.0.1/32 direct 0 0 127.0.0.1 inloop0 127.255.255.255/32 direct 0 0 127.0.0.1 inloop0 224.0.0.0/4 direct 0 0 0.0.0.0 null0 224.0.0.0/24 direct 0 0 0.0.0.0 null0 255.255.255.255/32 direct 0 0 127.0.0.1 inloop0 the output shows that the static route does not exist, and the status of the track e...
Page 75
61 # if the number of consecutive successful probes reaches 2, the operation succeeds. The nqa client notifies the feature of the successful operation event. [devicea-nqatplt-icmp-icmp] reaction trigger probe-pass 2 # if the number of consecutive probe failures reaches 2, the operation fails. The nq...
Page 76
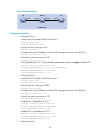
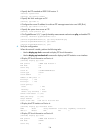
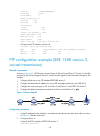
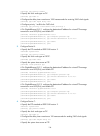
62 tcp template configuration example network requirements as shown in figure 23 , configure a tcp template for a feature to perform the tcp operation. The operation tests whether device a can establish a tcp connection to device b. Figure 23 network diagram configuration procedure 1. Assign each in...
Page 77
63 figure 24 network diagram configuration procedure # assign each interface an ip address. (details not shown.) # configure static routes or a routing protocol to make sure the devices can reach each other. (details not shown.) # create http template http. System-view [devicea] nqa template http ht...
Page 78
64 # specify the url of the ftp server. [devicea-nqatplt-ftp-ftp] url ftp://10.2.2.2 # specify 10.1.1.1 as the source ip address. [devicea-nqatplt-ftp-ftp] source ip 10.1.1.1 # configure the device to upload file config.Txt to the ftp server. [devicea-nqatplt-ftp-ftp] operation put [devicea-nqatplt-...
Page 79
65 configuring ntp synchronize your device with a trusted time source by using the network time protocol (ntp) or changing the system time before you run it on a live network. Various tasks, including network management, charging, auditing, and distributed computing depend on an accurate system time...
Page 80
66 figure 26 basic work flow the synchronization process is as follows: 1. Device a sends device b an ntp message, which is timestamped when it leaves device a. The time stamp is 10:00:00 am (t1). 2. When this ntp message arrives at device b, device b adds a timestamp showing the time when the messa...
Page 81
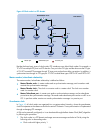
67 figure 27 ntp architecture typically, a stratum 1 ntp server gets its time from an authoritative time source, such as an atomic clock. It provides time for other devices as the primary ntp server. The accuracy of each server is the stratum, with the topmost level (primary servers) assigned as one...
Page 82
68 table 2 ntp association modes mode working process principle application scenario client/server on the client, specify the ip address of the ntp server. A client sends a clock synchronization message to the ntp servers. Upon receiving the message, the servers automatically operate in server mode ...
Page 83
69 mode working process principle application scenario broadcast a server periodically sends clock synchronization messages to the broadcast address 255.255.255.255. Clients listen to the broadcast messages from the servers to synchronize to the server according to the broadcast messages. When a cli...
Page 84
70 • if no ntp access control is configured, peer is granted to the local device and peer devices. • if the ip address of the peer device matches a permit statement in an acl for more than one access right, the least restrictive access right is granted to the peer device. If a deny statement or no a...
Page 85
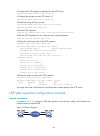
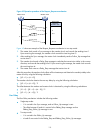
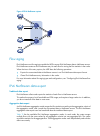
71 • configure the pes to operate in ntp client or symmetric active mode. • specify the vpn to which the ntp server or ntp symmetric passive peer belongs. Figure 29 network diagram protocols and standards • rfc 1305, network time protocol (version 3) specification, implementation and analysis • rfc ...
Page 86
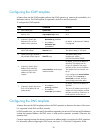
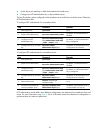
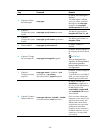
72 tasks at a glance (optional.) configuring ntp authentication (optional.) configuring ntp optional parameters enabling the ntp service step command remarks 1. Enter system view. System-view n/a 2. Enable the ntp service. Ntp-service enable by default, the ntp service is not enabled. Configuring nt...
Page 91
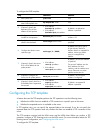
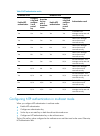
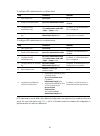
77 • set the key as a trusted key on both client and server. • associate the key with the ntp server on the client. The key ids and key values configured on the server and client must be the same. Otherwise, ntp authentication fails. To configure ntp authentication for a client: step command remarks...
Page 92
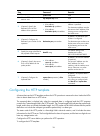
78 table 3 ntp authentication results client server authentication result enable ntp authentication configure a key and configure it as a trusted key associate the key with an ntp server enable ntp authentication configure a key and configure it as a trusted key yes yes yes yes yes succeeded. Ntp me...
Page 94
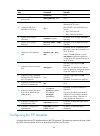
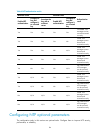
80 active peer passive peer authentication result enable ntp authentication configure a key and configure it as a trusted key associate the key with a passive peer enable ntp authentication configure a key and configure it as a trusted key yes yes yes yes yes succeeded. Ntp messages can be sent and ...
Page 95
81 • set the key as a trusted key on both the broadcast client and server. • configure an ntp authentication key on the broadcast server. The key ids and key values configured on the broadcast server and client must be the same. Otherwise, ntp authentication fails. To configure ntp authentication fo...
Page 96
82 table 5 ntp authentication results broadcast server broadcast client authentication result enable ntp authentication configure a key and configure it as a trusted key associate the key with a broadcast server enable ntp authentication configure a key and configure it as a trusted key yes yes yes ...
Page 97
83 to configure ntp authentication for a multicast client: step command remarks 1. Enter system view. System-view n/a 2. Enable ntp authentication. Ntp-service authentication enable by default, ntp authentication is disabled. 3. Configure an ntp authentication key. Ntp-service authentication-keyid k...
Page 98
84 table 6 ntp authentication results multicast server multicast client authentication result enable ntp authentication configure a key and configure it as a trusted key associate the key with a multicast server enable ntp authentication configure a key and configure it as a trusted key yes yes yes ...
Page 99
85 specifying the source interface for ntp messages to prevent interface status changes from causing ntp communication failures, configure the device to use the ip address of an interface that is always up. For example, you can configure the device to use a loopback interface as the source ip addres...
Page 100
86 configuring the maximum number of dynamic associations ntp has the following types of associations: • static association—a manually created association. • dynamic association—temporary association created by the system during ntp operation. A dynamic association is removed if no messages are exch...
Page 101
87 • make sure the local clock can provide the time accuracy required for the network. After you configure the local clock as a reference source, the local clock is synchronized, and can operate as a time server to synchronize other devices in the network. If the local clock is incorrect, timing err...
Page 102
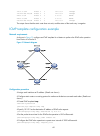
88 2. Configure device a: # enable the ntp service. System-view [devicea] ntp-service enable # specify the local clock as the reference source, with the stratum level 2. [devicea] ntp-service refclock-master 2 3. Configure device b: # enable the ntp service. System-view [deviceb] ntp-service enable ...
Page 103
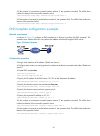
89 figure 31 network diagram configuration procedure 1. Assign an ip address to each interface, and make sure device a and device b can reach each other, as shown in figure 31 . (details not shown.) 2. Configure device a: # enable the ntp service. System-view [devicea] ntp-service enable # specify t...
Page 104
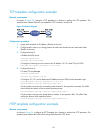
90 last receive time: 19 offset: 0.0 roundtrip delay: 0.0 dispersion: 0.0 total sessions: 1 ntp symmetric active/passive mode configuration example network requirements as shown in figure 32 , perform the following tasks: • configure the local clock of device a as a reference source, with the stratu...
Page 105
91 leap indicator: 00 clock jitter: 0.000916 s stability: 0.000 pps clock precision: 2^-17 root delay: 0.00609 ms root dispersion: 1.95859 ms reference time: 83aec681.Deb6d3e5 wed, jan 8 2014 14:33:11.081 # verify that an ipv4 ntp association has been established between device b and device a. [devi...
Page 106
92 # configure device b as an ipv6 symmetric passive peer. [devicea] ntp-service ipv6 unicast-peer 3000::36 4. Verify the configuration: # verify that device b has synchronized to device a. [deviceb] display ntp-service status clock status: synchronized clock stratum: 3 system peer: 3000::35 local m...
Page 107
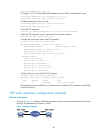
93 figure 34 network diagram configuration procedure 1. Assign an ip address to each interface, and make sure router a, router b, and router c can reach each other, as shown in figure 34 . (details not shown.) 2. Configure router c: # enable the ntp service. System-view [routerc] ntp-service enable ...
Page 108
94 the following uses router a as an example to describe configuration verification. # verify that router a has synchronized to router c, and the clock stratum level is 3 on router a and 2 on router c. [routera-gigabitethernet2/0/1] display ntp-service status clock status: synchronized clock stratum...
Page 109
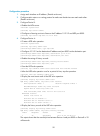
95 figure 35 network diagram configuration procedure 1. Assign an ip address to each interface, and make sure the routers can reach each other, as shown in figure 35 . (details not shown.) 2. Configure router c: # enable the ntp service. System-view [routerc] ntp-service enable # specify the local c...
Page 110
96 system peer: 3.0.1.31 local mode: bclient reference clock id: 3.0.1.31 leap indicator: 00 clock jitter: 0.044281 s stability: 0.000 pps clock precision: 2^-10 root delay: 0.00229 ms root dispersion: 4.12572 ms reference time: d0d289fe.Ec43c720 sat, jan 8 2011 7:00:14.922 # verify that an ipv4 ntp...
Page 111
97 reference clock id: 3.0.1.31 leap indicator: 00 clock jitter: 0.165741 s stability: 0.000 pps clock precision: 2^-10 root delay: 0.00534 ms root dispersion: 4.51282 ms reference time: d0c61289.10b1193f wed, dec 29 2010 20:03:21.065 # verify that an ipv4 ntp association has been established betwee...
Page 112
98 # enable the ntp service. System-view [routerc] ntp-service enable # specify the local clock as the reference source, with the stratum level 2. [routerc] ntp-service refclock-master 2 # configure router c to operate in ipv6 multicast server mode and send multicast messages through gigabitethernet...
Page 113
99 total sessions: 1 5. Configure router b: because router a and router c are on different subnets, you must enable the multicast functions on router b before router a can receive ipv6 multicast messages from router c. # enable the ipv6 multicast function. System-view [routerb] ipv6 multicast routin...
Page 114
100 roundtrip delay: 0.0 dispersion: 0.0 total sessions: 1 configuration example for ntp client/server mode with authentication network requirements as shown in figure 37 , perform the following tasks: • configure the local clock of device a as a reference source, with the stratum level 2. • configu...
Page 115
101 4. Configure ntp authentication on device a: # enable ntp authentication. [devicea] ntp-service authentication enable # set an authentication key, and input the key in plain text. [devicea] ntp-service authentication-keyid 42 authentication-mode md5 simple anicekey # specify the key as a trusted...
Page 116
102 • configure ntp authentication on router a, router b, and router c. Figure 38 network diagram configuration procedure 1. Assign an ip address to each interface, and make sure router a, router b, and router c can reach each other, as shown in figure 38 . (details not shown.) 2. Configure router a...
Page 117
103 4. Configure router c: # enable the ntp service. System-view [routerc] ntp-service enable # specify the local clock as the reference source, with the stratum level 3. [routerc] ntp-service refclock-master 3 # configure router c to operate in the ntp broadcast server mode and use gigabitethernet ...
Page 118
104 [routerb-gigabitethernet2/0/1] display ntp-service sessions source reference stra reach poll now offset delay disper ******************************************************************************** [1245]3.0.1.31 127.127.1.0 3 3 64 68 -0.0 0.0000 0.0 notes: 1 source(master),2 source(peer),3 sele...
Page 119
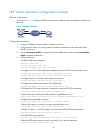
105 configuration procedure before you perform the following configuration, be sure you have completed mpls vpn-related configurations. For information about configuring mpls vpn, see mpls configuration guide. 1. Assign an ip address to each interface, as shown in figure 39 . Make sure ce 1 and pe 1...
Page 120
106 refid 127.127.1.0 configuration example for mpls vpn time synchronization in symmetric active/passive mode network requirements as shown in figure 40 , two vpns are present on pe 1 and pe 2: vpn 1 and vpn 2. Ce 1 and ce 3 belong to vpn 1. To synchronize time between pe 1 and ce 1 in vpn 1, perfo...
Page 121
107 system-view [ce1] ntp-service enable # specify the local clock as the reference source, with the stratum level 2. [ce1] ntp-service refclock-master 2 3. Configure pe 1: # enable the ntp service. System-view [pe1] ntp-service enable # specify ce 1 in vpn 1 as the symmetric-passive peer of pe 1. [...
Page 122
108 configuring sntp sntp is a simplified, client-only version of ntp specified in rfc 4330. Sntp supports only the client/server mode. An sntp-enabled device can receive time from ntp servers, but cannot provide time services to other devices. Sntp uses the same packet format and packet exchange pr...
Page 125
111 2. Configure device a: # enable the ntp service. System-view [devicea] ntp-service enable # configure the local clock of device a as a reference source, with the stratum level 2. [devicea] ntp-service refclock-master 2 # enable ntp authentication on device a. [devicea] ntp-service authentication...
Page 126
112 configuring ptp overview precision time protocol (ptp) synchronizes time among devices. It provides greater accuracy than other time synchronization protocols such as ntp. For more information about ntp, see "configuring ntp." basic concepts ptp profile a ptp profile defines the following ptp st...
Page 127
113 figure 42 clock nodes in a ptp domain besides the three basic types of clock nodes, ptp introduces some hybrid clock nodes. For example, a tc+oc has multiple ptp ports in a ptp domain. One port is the oc type, and the others are the tc type. A tc+oc forwards ptp messages through tc-type ports an...
Page 128
114 b. Clock node with higher time class. C. Clock node with higher time accuracy. D. Clock node with higher priority 2. E. Clock node with a smaller port id (containing clock number and port number). The master nodes, member nodes, master ports, and subordinate ports are determined during the proce...
Page 129
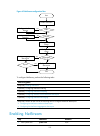
115 figure 43 operation procedure of the request_response mechanism figure 43 shows an example of the request_response mechanism in two-step mode. 1. The master clock sends a sync message to the member clock, and records the sending time t1. Upon receiving the message, the member clock records the r...
Page 130
116 figure 44 operation procedure of the peer delay mechanism the peer delay mechanism uses pdelay messages to calculate link delay, which applies only to point-to-point delay measurement. Figure 44 shows an example of the peer delay mechanism by using the two-step mode. 1. The master clock sends a ...
Page 131
117 feature and hardware compatibility hardware ptp compatibility sr6602-x no sr6604/sr6608/sr6616 yes sr6604-x/sr6608-x/sr6616-x yes configuring clock nodes before performing the following configurations, define the scope of the ptp domain and the role of every clock node. Configuration task list t...
Page 132
118 tasks at a glance the ptp standard is ieee 1588 version 2: (required.) specifying a clock node type (optional.) specifying a ptp domain (optional.) configuring an oc to operate only as a member clock (optional.) configuring tod input or output (optional.) configuring the role of a ptp port (opti...
Page 133
119 tasks at a glance the ptp standard is ieee 802.1as (802.1as): (required.) specifying a clock node type (optional.) specifying a ptp domain (optional.) configuring an oc to operate only as a member clock (optional.) configuring tod input or output (optional.) configuring the role of a ptp port (o...
Page 135
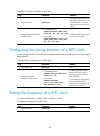
121 hardware tod input or output compatibility sr6604-x/sr6608-x/sr6616-x yes to use a tod clock, you must configure tod input or output: • tod input—the device obtains clock signals from an external tod clock and synchronizes tod to all devices in the ptp network. • tod output—the device operates a...
Page 138
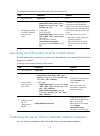
124 step command remarks 3. Configure the port type for a tc+oc as oc. Ptp port-mode oc by default, the port type for all ports on a tc+oc is tc. Configuring the interval for sending announce messages step command remarks 1. Enter system view. System-view n/a 2. Enter layer 3 ethernet interface view...
Page 139
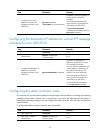
125 configuring the interval for sending pdelay_req messages step command remarks 1. Enter system view. System-view n/a 2. Enter layer 3 ethernet interface view. Interface interface-type interface-number n/a 3. Configure the interval for sending pdelay_req messages. Ptp pdelay-req-interval value opt...
Page 140
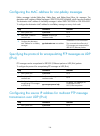
126 configuring the mac address for non-pdelay messages pdelay messages include pdelay_req, pdelay_resp, and pdelay_resp_follow_up messages. The destination mac address of pdelay messages is 0180-c200-000e by default, which cannot be modified. The destination mac address of non-pdelay messages is ei...
Page 141
127 step command remarks 2. Configure the source ip address for multicast ptp message transmission over udp (ipv4). Ptp source ip-address [ vpn-instance vpn-instance-name ] by default, no source ip address is configured for multicast ptp messages. This command takes effect only when multicast ptp me...
Page 143
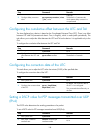
129 step command remarks 3. Set a dscp value for ptp messages transmitted over udp (ipv4). Ptp dscp dscp by default, the dscp value is 56. Specifying the system time source as ptp make sure you use the clock protocol command to specify the time protocol as ptp. For more information about the clock p...
Page 144
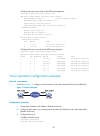
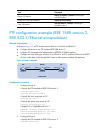
130 task command display ptp statistics. Display ptp statistics [ interface interface-type interface-number ] display ptp clock time properties. Display ptp time-property clear ptp statistics. Reset ptp statistics [ interface interface-type interface-number ] ptp configuration example (ieee 1588 ver...
Page 145
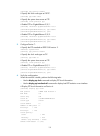
131 [deviceb] ptp profile 1588v2 # specify the clock node type as e2etc. [deviceb] ptp mode e2etc # specify the system time source as ptp. [deviceb] clock protocol ptp # enable ptp for gigabitethernet 2/0/1. [deviceb] interface gigabitethernet 2/0/1 [deviceb-gigabitethernet2/0/1] ptp enable [deviceb...
Page 146
132 mean path delay : 0 (ns) steps removed : 0 local clock time : sun jan 15 20:57:29 2011 # display brief ptp statistics on device a. [devicea] display ptp interface brief name state delay mechanism clock step asymmetry correction ge2/0/1 master e2e two 0 # display ptp clock information on device b...
Page 147
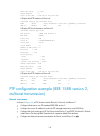
133 figure 46 network diagram configuration procedure 1. Configure device a: # specify the ptp standard as ieee 1588 version 2. System-view [devicea] ptp profile 1588v2 # specify the clock node type as oc. [devicea] ptp mode oc # configure the source ip address for multicast ptp message transmission...
Page 148
134 # specify the ptp standard as ieee 1588 version 2. System-view [devicec] ptp profile 1588v2 # specify the clock node type as oc. [devicec] ptp mode oc # configure the source ip address for multicast ptp message transmission over udp (ipv4). [devicec] ptp source 10.10.10.3 # specify the system ti...
Page 149
135 clock id : 000fe2-fffe-ff0001 clock type : local clock domain : 0 number of ptp ports : 2 priority1 : 128 priority2 : 128 clock quality : class : 248 accuracy : 254 offset (log variance) : 65535 offset from master : n/a mean path delay : n/a steps removed : n/a local clock time : sun jan 15 20:5...
Page 150
136 [devicea] ptp profile 1588v2 # specify the clock node type as oc. [devicea] ptp mode oc # configure the delay time correction as 1000 nanoseconds for receiving tod0 clock signals. [devicea] ptp tod0 input delay 1000 # configure priority 1 as 0 for the tod0 clock. [devicea] ptp priority clock-sou...
Page 151
137 [devicec] clock protocol ptp # on gigabitethernet 2/0/1, configure the destination ip address for unicast ptp message transmission over udp (ipv4), and enable ptp. [devicec] interface gigabitethernet 2/0/1 [devicec-gigabitethernet2/0/1] ptp transport-protocol udp [devicec-gigabitethernet2/0/1] p...
Page 152
138 class : 248 accuracy : 254 offset (log variance) : 65535 offset from master : n/a mean path delay : n/a steps removed : n/a local clock time : sun jan 15 20:57:29 2011 # display brief ptp statistics on device b. [deviceb] display ptp interface brief name state delay mechanism clock step asymmetr...
Page 153
139 # specify the ptp standard as ieee 802.1as. System-view [deviceb] ptp profile 802.1as # specify the clock node type as p2ptc. [deviceb] ptp mode p2ptc # specify the system time source as ptp. [deviceb] clock protocol ptp # enable ptp for gigabitethernet 2/0/1. [deviceb] interface gigabitethernet...
Page 154
140 offset (log variance) : 16640 offset from master : 0 (ns) mean path delay : 0 (ns) steps removed : 0 local clock time : sun jan 15 20:57:29 2011 # display brief ptp statistics on device a. [devicea] display ptp interface brief name state delay mechanism clock step asymmetry correction ge2/0/1 ma...
Page 155
141 configuring network synchronization overview the network clock monitoring module provides network clock synchronization for all interface cards in the system. It ensures that all ports on the interface cards operate at the same clock rates for network synchronization. Network synchronization is ...
Page 156
142 clock source priority for a clock source to be selected as the clock reference, assign it a lower priority value than other clock sources. The lower the priority value, the better the clock source. For example, the clock source with a priority of 1 is better than the clock source with a priority...
Page 157
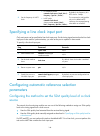
143 a port can operate in one of the following clock modes: • master—the port provides timing to the peer end. The timing signal is derived from the network clock monitoring module. { if automatic reference selection is used, the timing signal is derived from the reference clock selected by the netw...
Page 158
144 (optional.) enabling the reference manually specified on a non-default mdc you must perform this task if a line clock input port on a non-default mdc has been specified as the clock reference source. This task enables the clock reference setting to take effect on all mdcs. Configuring clock refe...
Page 159
145 to specify an sa bit for the ssm of a bits clock: step command remarks 1. Enter system view. System-view in an mdc environment, you can perform this task only on the default mdc. However, the setting takes effect on all mdcs. 2. Specify an sa bit for the ssm of a bits clock. • in standalone mode...
Page 162
148 • if the ssm quality level contributes to the selection process, the network clock monitoring module selects a reference from available clock sources by their ssm quality level and priority. • if the ssm quality level does not contribute to the selection process, the network clock monitoring mod...
Page 163
149 step command remarks 1. Verify that the mdc you are specifying has clock sources in normal state. Display network-clock source this command is available in any view. 2. Enter system view. System view n/a 3. Enable the clock reference manually specified on a non-default mdc. • in standalone mode:...
Page 164
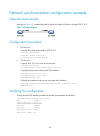
150 network synchronization configuration example network requirements as shown in figure 49 , configure device b to derive its timing from device a through pos 2/2/0. Figure 49 network diagram configuration procedure 1. On device a: # specify the master clock mode on pos 2/2/0. System-view [devicea...
Page 165
151 configuring synchronous ethernet overview synchronous ethernet (synce) provides high-quality frequency synchronization on ethernet at the physical layer. It can provide the same level of clock precision as sonet/sdh. Transferring frequency signals at the physical layer, synce functions regardles...
Page 166
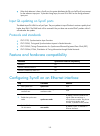
152 • if the clock reference is from a synce port, the system distributes the ql out of all synce ports except for the reference input port. To prevent timing loops, the sent ql is dnu on the timing reference input port. Input ql updating on synce ports the default input ql is dnu on a synce port. T...
Page 167
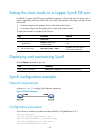
153 setting the clock mode on a copper synce ge port by default, a copper synce ge port automatically negotiates its clock mode with the remote end. To avoid a negotiation result that conflicts with your clock synchronization trail design, manually set the clock mode. • to derive timing from the ups...
Page 168
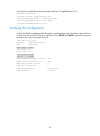
154 # on device b, enable the synchronous mode and esmc on gigabitethernet 2/0/1. System-view [deviceb] interface gigabitethernet 2/0/1 [deviceb-gigabitethernet2/0/1] synchronous mode [deviceb-gigabitethernet2/0/1] esmc enable [deviceb-gigabitethernet2/0/1] quit verifying the configuration # verify ...
Page 169
155 configuring snmp overview simple network management protocol (snmp) is an internet standard protocol widely used for a management station to access and operate the devices on a network, regardless of their vendors, physical characteristics, and interconnect technologies. Snmp enables network adm...
Page 170
156 a mib view represents a set of mib objects (or mib object hierarchies) with certain access privileges and is identified by a view name. The mib objects included in the mib view are accessible while those excluded from the mib view are inaccessible. A mib view can have multiple view records each ...
Page 171
157 if you create the same snmp community or user with both modes multiple times, the most recent configuration takes effect. For more information about user roles and the rule command, see fundamentals command reference. For an nms to access an agent: • the rbac mode requires the user role bound to...
Page 173
159 step command remarks 10. (optional.) map an snmp community to an snmp context. Snmp-agent community-map community-name context context-name by default, no mapping between an snmp community and an snmp context exists on the device. 11. (optional.) configure the maximum snmp packet size (in bytes)...
Page 174
160 step command remarks 2. (optional.) enable the snmp agent. Snmp-agent by default, the snmp agent is disabled. The snmp agent is enabled when you use any command that begins with snmp-agent except for the snmp-agent calculate-password command. 3. (optional.) configure the system contact. Snmp-age...
Page 177
163 step command remarks 12. (optional.) assign a user role to an snmpv3 user created in rbac mode. Snmp-agent usm-user user-name v3 user-role role-name by default, no snmpv3 users are configured in rbac mode. 13. (optional.) create an snmp context. Snmp-agent context context-name by default, no snm...
Page 178
164 configuring snmp notifications the snmp agent sends notifications (traps and informs) to inform the nms of significant events, such as link state changes and user logins or logouts. Unless otherwise stated, the trap keyword in the command line includes both traps and informs. Enabling snmp notif...
Page 179
165 you can extend standard linkup/linkdown notifications to include interface description and interface type, but must make sure the nms supports the extended snmp messages. To send informs, make sure: • the snmp agent and the nms use snmpv2c or snmpv3. • if snmpv3 is used, you must configure the s...
Page 181
167 snmpv1/snmpv2c configuration example the snmpv1 configuration procedure is the same as the snmpv2c configuration procedure. This example uses snmpv1, and is available only for high encryption in non-fips mode. Network requirements as shown in figure 53 , the nms (1.1.1.2/24) uses snmpv1 to manag...
Page 182
168 verifying the configuration # try to get the mtu value of null0 interface from the agent. The attempt succeeds. Send request to 1.1.1.1/161 ... Protocol version: snmpv1 operation: get request binding: 1: 1.3.6.1.2.1.2.2.1.4.135471 response binding: 1: oid=ifmtu.135471 syntax=int value=1500 get f...
Page 183
169 # configure the ip address of the agent, and make sure the agent and the nms can reach each other. (details not shown.) # create the user role test, and permit test to have read and write access to the snmp node (oid 1.3.6.1.2.1.11). System-view [agent] role name test [agent-role-test] rule 1 pe...
Page 184
170 [agent] snmp-agent mib-view included test iftable [agent] snmp-agent group v3 managev3group privacy read-view test write-view test # assign the nms (snmpv3 group managev3group) read-only access to the objects under the system node (oid 1.3.6.1.2.1.1) and hh3cuimgt node (oid 1.3.6.1.4.1.25506.2.2...
Page 185
171 # try to set the device name from the agent. The set attempt fails because the nms has no access right to the node. Send request to 1.1.1.1/161 ... Protocol version: snmpv3 operation: set request binding: 1: 1.3.6.1.2.1.1.5.0 response binding: session failed ! Snmp: cannot access variable, no ac...
Page 186
172 configuring rmon overview remote network monitoring (rmon) is an enhancement to snmp. It enables proactive remote monitoring and management of network devices and subnets. An rmon monitor periodically or continuously collects traffic statistics for the network attached to a port on the managed d...
Page 187
173 the history table stores traffic statistics collected for each sampling interval. Event group the event group controls the generation and notifications of events triggered by the alarms defined in the alarm group and the private alarm group. The following are rmon alarm event handling methods: •...
Page 188
174 3. Compares the calculation result with the predefined thresholds, and then takes one of the following actions: { triggers the event associated with the rising alarm event if the result is equal to or greater than the rising threshold. { triggers the event associated with the falling alarm event...
Page 189
175 step command remarks 3. Create an entry for the interface in the rmon statistics table. Rmon statistics entry-number [ owner text ] by default, the rmon statistics table does not contain entries. You can create one statistics entry for each ethernet interface, and a maximum of 100 statistics ent...
Page 190
176 entry parameters to be compared maximum number of entries alarm • alarm variable (alarm-variable) • sampling interval (sampling-interval) • sample type (absolute or delta) • rising threshold (threshold-value1) • falling threshold (threshold-value2) 60 private alarm • alarm variable formula (pria...
Page 191
177 task command display rmon private alarm entries. Display rmon prialarm [ entry-number ] display rmon event entries. Display rmon event [ entry-number ] display log information for event entries. Display rmon eventlog [ entry-number ] ethernet statistics group configuration example network requir...
Page 192
178 history group configuration example network requirements as shown in figure 57 , create an rmon history control entry on the device to sample traffic statistics for gigabitethernet 2/0/1 every minute. Figure 57 network diagram configuration procedure # create an rmon history control entry to sam...
Page 193
179 sampling record 4 : dropevents : 0 , octets : 933 packets : 8 , broadcast packets : 0 multicast packets : 7 , crc alignment errors : 0 undersize packets : 0 , oversize packets : 0 fragments : 0 , jabbers : 0 collisions : 0 , utilization : 0 sampling record 5 : dropevents : 0 , octets : 898 packe...
Page 194
180 figure 58 network diagram configuration procedure # configure the snmp agent (the device) with the same snmp settings as the nms at 1.1.1.2. This example uses snmpv1, read community public, and write community private. System-view [sysname] snmp-agent [sysname] snmp-agent community read public [...
Page 195
181 etherstatsentry 1 owned by user1 is valid. Interface : gigabitethernet2/0/1 etherstatsoctets : 57329 , etherstatspkts : 455 etherstatsbroadcastpkts : 53 , etherstatsmulticastpkts : 353 etherstatsundersizepkts : 0 , etherstatsoversizepkts : 0 etherstatsfragments : 0 , etherstatsjabbers : 0 ethers...
Page 196
182 configuring eaa overview embedded automation architecture (eaa) is a monitoring framework that enables you to self-define monitored events and actions to take in response to an event. It allows you to create monitor policies by using the cli or tcl scripts. Eaa framework eaa framework includes a...
Page 197
183 rtm rtm manages the creation, state machine, and execution of monitor policies. Eaa monitor policies a monitor policy specifies the event to monitor and actions to take when the event occurs. You can configure eaa monitor policies by using the cli or tcl. A monitor policy contains the following ...
Page 198
184 event type description snmp-notification snmp-notification event occurs when the monitored mib variable's value in an snmp notification matches the specified condition. For example, the broadcast traffic rate on an ethernet interface reaches or exceeds 30%. Action you can create a series of orde...
Page 199
185 • event-specific variable—available only for a type of event. Table 10 shows all system-defined variables. Table 10 system-defined eaa environment variables by event type variable name description any event: _event_id event id. _event_type event type. _event_type_string event type description. _...
Page 200
186 step command remarks 1. Enter system view. System-view n/a 2. Configure a user-defined eaa environment variable. Rtm environment var-name var-value by default, no user-defined environment variables are configured. The system provides the system-defined variables in table 10 . Configuring a monit...
Page 202
188 step command remarks 4. Configure the actions to take when the event occurs. • configure the action to execute a command: action number cli command-line • configure a reboot action (in standalone mode): action number reboot [ slot slot-number [ subslot subslot-number ] ] • configure a reboot act...
Page 203
189 step command remarks 4. Create a tcl-defined policy and bind it to the tcl script file. Rtm tcl-policy policy-name tcl-filename by default, the system does not have tcl policies. This step enables the tcl-defined policy. To revise the tcl script of a policy, you must suspend all monitor policies...
Page 205
191 verifying the configuration # display information about the policy. [sysname-rtm-test] display rtm policy registered total number: 1 type event timeregistered policyname cli cli aug 29 14:56:50 2013 test # enable the information center to output log messages to the current monitoring terminal. [...
Page 206
192 # add an action that enters system view when the event occurs. [sysname-rtm-test] action 0 cli system-view # add an action that creates the interface loopback 0 and enters loopback interface view. [sysname-rtm-test] action 1 cli interface loopback 0 # add an action that assigns the ip address 1....
Page 207
193 • the system executes the command only after it executes the policy successfully. Figure 60 network diagram configuration procedure # edit a tcl script file (rtm_tcl_test.Tcl, in this example) for eaa to send the message "rtm_tcl_test is running" when a command that contains the display this str...
Page 208
194 monitoring and maintaining processes h3c comware v7 is a full-featured, modular, and scalable network operating system based on the linux kernel. Comware v7 software features run the following types of independent processes: • user process—runs in user space. Most comware v7 software features ru...
Page 209
195 task command monitor process running state. Monitor process [ dumbtty ] [ iteration number ] [ chassis chassis-number slot slot-number [ cpu cpu-number ] ] monitor thread running state. Monitor thread [ dumbtty ] [ iteration number ] [ chassis chassis-number slot slot-number [ cpu cpu-number ] ]...
Page 210
196 task command display memory usage for all user processes. Display process memory [ chassis chassis-number slot slot-number [ cpu cpu-number ] ] display heap memory usage for a user process. Display process memory heap job job-id [ verbose ] [ chassis chassis-number slot slot-number [ cpu cpu-num...
Page 211
197 step command remarks 1. Enter system view. System-view n/a 2. Enable kernel thread deadloop detection. Monitor kernel deadloop enable [ slot slot-number [ cpu cpu-number ] ] by default, kernel thread deadloop detection is disabled. 3. (optional.) set the interval for identifying a kernel thread ...
Page 212
198 step command remarks 2. Enable kernel thread starvation detection. Monitor kernel starvation enable [ slot slot-number [ cpu cpu-number ] ] by default, the function is disabled. 3. (optional.) set the interval for identifying a kernel thread starvation. Monitor kernel starvation time interval [ ...
Page 213
199 task command clear kernel thread starvation information. Reset kernel starvation [ slot slot-number [ cpu cpu-number ] ] execute display commands in any view and reset commands in user view (in irf mode). Task command display kernel thread deadloop information. Display kernel deadloop show-numbe...
Page 214
200 configuring samplers a sampler selects a packet from among sequential packets and sends the packet to other service modules for processing. Sampling is useful when you want to limit the volume of traffic to be analyzed. The sampled data is statistically accurate and sampling decreases the impact...
Page 215
201 • configure fixed sampling in the inbound direction to select the first packet from among 100 packets. • configure random sampling in the outbound direction to select one packet randomly from among 200 packets. Figure 61 network diagram configuration procedure # create sampler 100 in fixed sampl...
Page 216
202 configuring port mirroring overview port mirroring copies the packets passing through a port to a port that connects to a data monitoring device for packet analysis. Terminology the following terms are used in port mirroring configuration. Mirroring source the mirroring sources can be one or mor...
Page 217
203 port mirroring implementation the local port mirroring has the following characteristics: • the mirroring sources and the mirroring destination are on the same device. • the source device is directly connected to a data monitoring device. • the source device acts as the destination device to for...
Page 218
204 creating a local mirroring group step command remarks 1. Enter system view. System-view n/a 2. Create a local mirroring group. Mirroring-group group-id local by default, no local mirroring group exists. Configuring source ports for the local mirroring group to configure source ports for a local ...
Page 219
205 configuring the monitor port for the local mirroring group to configure the monitor port for a mirroring group, use one of the following methods: • configure the monitor port for the mirroring group in system view. • assign a port to the mirroring group as the monitor port in interface view. Con...
Page 220
206 local port mirroring configuration example network requirements as shown in figure 63 , configure local port mirroring to enable the server to monitor the bidirectional traffic of the marketing department and the technical department. Figure 63 network diagram configuration procedure # create lo...
Page 221
207 configuring netstream overview netstream is an accounting technology that provides statistics on a per-flow basis. An ipv4 flow is defined by the following 7-tuple elements: • destination ip address. • source ip address. • destination port number. • source port number. • protocol number. • tos. ...
Page 222
208 figure 64 netstream system flow aging netstream uses flow aging to enable the nde to export netstream data to netstream servers. Netstream creates a netstream entry for each flow for storing the flow statistics in the cache. When the timer of the entry expires, the nde performs the following ope...
Page 223
209 for example, when the aggregation mode configured on the nde is protocol-port, netstream aggregates the statistics of flow entries by protocol number, source port, and destination port. Four netstream entries record four tcp flows with the same destination address, source port, and destination p...
Page 224
210 aggregation mode aggregation criteria tos-source-prefix aggregation • tos • source as number • source prefix • source address mask length • inbound interface index tos-destination-prefix aggregation • tos • destination as number • destination address mask length • destination prefix • outbound i...
Page 225
211 netstream filtering and sampling netstream filtering netstream filtering uses an acl to identify packets. Whether netstream collects data for identified packets depends on the action in the matching rule. • netstream collects data for packets that match permit rules in the acl. • netstream does ...
Page 226
212 figure 65 netstream configuration flow to configure netstream, perform the following tasks: tasks at a glance (required.) enabling netstream (optional.) configuring netstream filtering (optional.) configuring netstream sampling (optional.) configuring attributes of the netstream data export (opt...
Page 228
214 • statistics about source as, destination as, and peer ass in version 5 or version 9 format. • statistics about bgp next hop only in version 9 format. To configure the netstream data export format: step command remarks 1. Enter system view. System-view n/a 2. (optional.) configure the netstream ...
Page 229
215 configuring the refresh rate for netstream version 9 templates version 9 is template-based and supports user-defined formats. A netstream-enabled device must periodically resend the updated template to netstream servers, because the servers do not permanently save the template. The server cannot...
Page 230
216 • inactive flow aging—a flow is inactive if no packet arrives for this netstream entry within the period specified by using the ip netstream timeout inactive command. When the inactive flow aging timer expires, the following situations occur: { the inactive flow entry is aged out. { the statisti...
Page 231
217 step command remarks 3. (optional.) configure forced aging. A. Exit to user view: quit b. Age out netstream entries: reset ip netstream statistics n/a configuring the netstream data export configuring the netstream traditional data export step command remarks 1. Enter system view. System-view n/...
Page 233
219 netstream configuration examples netstream traditional data export configuration example network requirements as shown in figure 67 , configure netstream on router a to collect statistics on packets passing through router a. • enable netstream for incoming traffic on gigabitethernet 2/0/1 and fo...
Page 234
220 l2 active flow entries : 0 ipl2 active flow entries : 0 ip flow entries counted : 0 mpls flow entries counted : 0 l2 flow entries counted : 0 ipl2 flow entries counted : 0 last statistics resetting time : never ip packet size distribution (11 packets in total): 1-32 64 96 128 160 192 224 256 288...
Page 235
221 • router a performs netstream aggregation in the modes of as, protocol-port, source-prefix, destination-prefix, and prefix. • router a exports the aggregation data of different modes to 4.1.1.1, with udp ports 2000, 3000, 4000, 6000, and 7000. Figure 68 network diagram configuration procedure # ...
Page 236
222 # configure the aggregation mode as destination-prefix, and specify the destination host for the aggregation data export. [routera] ip netstream aggregation destination-prefix [routera-ns-aggregation-dstpre] enable [routera-ns-aggregation-dstpre] ip netstream export host 4.1.1.1 6000 [routera-ns...
Page 237
223 # display the statistics of the netstream data export. [routera] display ip netstream export as aggregation export information: flow source interface : not specified flow destination vpn instance : not specified flow destination ip address (udp) : 4.1.1.1 (2000) version 8 exported flows number :...
Page 238
224 flow source interface : not specified flow destination vpn instance : not specified flow destination ip address (udp) : 4.1.1.1 (5000) version 5 exported flows number : 10 version 5 exported udp datagrams number (failed): 10 (0) version 9 exported flows number : 0 version 9 exported udp datagram...
Page 239
225 configuring ipv6 netstream overview ipv6 netstream is an accounting technology that provides statistics on a per-flow basis. An ipv6 flow is defined by the following 8-tuple elements: • destination ipv6 address. • source ipv6 address. • destination port number. • source port number. • protocol n...
Page 240
226 figure 69 ipv6 netstream system flow aging ipv6 netstream uses flow aging to enable the nde to export ipv6 netstream data to netstream servers. Ipv6 netstream creates an ipv6 netstream entry for each flow for storing the flow statistics in the cache. When the timer of the entry expires, the nde ...
Page 241
227 table 13 ipv6 netstream aggregation modes aggregation mode aggregation criteria as aggregation • source as number • destination as number • input interface index • output interface index protocol-port aggregation • protocol number • source port • destination port source-prefix aggregation • sour...
Page 242
228 ipv6 netstream sampling ipv6 netstream sampling collects statistics on fewer packets and is useful when the network has a large amount of traffic. Ipv6 netstream on sampled traffic lessens the impact on the device's performance. For more information about sampling, see "configuring samplers." ip...
Page 243
229 tasks at a glance (required.) enabling ipv6 netstream (optional.) configuring ipv6 netstream filtering (optional.) configuring ipv6 netstream sampling (optional.) configuring attributes of the ipv6 netstream data export (optional.) configuring ipv6 netstream flow aging (required.) perform at lea...
Page 245
231 figure 71 recorded as information varies by different keyword configurations to configure the ipv6 netstream data export format: step command remarks 1. Enter system view. System-view n/a 2. (optional.) configure the ipv6 netstream data export format, and specify whether to record as and bgp nex...
Page 246
232 the refresh frequency and the refresh interval can both be configured. The template is resent when either of the conditions is reached. To configure the refresh rate for ipv6 netstream version 9 templates: step command remarks 1. Enter system view. System-view n/a 2. (optional.) configure the re...
Page 247
233 collect its statistics, which can be displayed by using the display ipv6 netstream cache command. The active flow aging method periodically exports the statistics of active flows to netstream servers. Forced aging to implement forced aging, use one of the following commands: • use the reset ipv6...
Page 249
235 step command remarks 4. (optional.) specify the source interface for ipv6 netstream data packets sent to the netstream servers. Ipv6 netstream export source interface interface-type interface-number by default, no source interface is specified for ipv6 netstream data packets. The packets take th...
Page 250
236 ipv6 netstream configuration examples ipv6 netstream traditional data export configuration example network requirements as shown in figure 72 , configure ipv6 netstream on router a to collect statistics on packets passing through router a. • enable ipv6 netstream for incoming and outgoing traffi...
Page 251
237 1-32 64 96 128 160 192 224 256 288 320 352 384 416 448 480 .249 .694 .000 .000 .000 .000 .000 .000 .000 .000 .000 .000 .000 .000 .000 512 544 576 1024 1536 2048 2560 3072 3584 4096 4608 >4608 .000 .000 .027 .000 .027 .000 .000 .000 .000 .000 .000 .000 protocol total packets flows packets active(...
Page 252
238 figure 73 network diagram configuration procedure # assign an ip address to gigabitethernet 2/0/1. System-view [routera] interface gigabitethernet 2/0/1 [routera-gigabitethernet2/0/1] ipv6 address 10::1/64 # enable ipv6 netstream for incoming and outgoing traffic on gigabitethernet 2/0/1. [route...
Page 253
239 [routera-ns6-aggregation-dstpre] ipv6 netstream export host 40::1 6000 [routera-ns6-aggregation-dstpre] quit # configure the aggregation mode as prefix, and specify the destination host for the aggregation data export. [routera] ipv6 netstream aggregation prefix [routera-ns6-aggregation-prefix] ...
Page 254
240 flow source interface : not specified flow destination vpn instance : not specified flow destination ip address (udp) : 40::1 (5000) version 9 exported flows number : 0 version 9 exported udp datagrams number (failed): 0 (0).
Page 255
241 configuring the information center the information center on a device classifies and manages logs for all modules so that network administrators can monitor network performance and troubleshoot network problems. Overview the information center receives logs generated by source modules and output...
Page 256
242 table 14 log levels severity value level description 0 emergency the system is unusable. For example, the system authorization has expired. 1 alert action must be taken immediately. For example, traffic on an interface exceeds the upper limit. 2 critical critical condition. For example, the devi...
Page 257
243 table 16 default output rule for diagnostic logs destination log source modules output switch severity diagnostic log file all supported modules enabled debug default output rules for security logs security logs can only be output to the security log file, and cannot be filtered by source module...
Page 258
244 log formats the format of logs varies by output destinations. Table 21 shows the original format of log information, which might be different from what you see. The actual format varies by the log resolution tool used. Table 21 log formats output destination format example console, monitor termi...
Page 259
245 field description timestamp records the time when the log was generated. Logs sent to the log host and those sent to the other destinations have different timestamp precisions, and their timestamp formats are configured with different commands. For more information, see table 23 and table 24 . H...
Page 260
246 table 24 description of the timestamp parameters timestamp parameters description example boot time that has elapsed since system startup, in the format of xxx.Yyy. Xxx represents the higher 32 bits, and yyy represents the lower 32 bits, of milliseconds elapsed. Logs that are sent to all destina...
Page 261
247 task at a glance • outputting logs to the log buffer • saving logs to a log file (optional.) managing security logs (optional.) saving diagnostic logs to a diagnostic log file (optional.) configuring the maximum size of the trace log file (optional.) outputting custom nat444 logs to a log host (...
Page 263
249 outputting logs to the log buffer step command remarks 1. Enter system view. System-view n/a 2. Enable the information center. Info-center enable by default, the information center is enabled. 3. Enable log output to the log buffer. Info-center logbuffer by default, log output to the log buffer ...
Page 264
250 step command remarks 5. (optional.) configure the maximum size for a log file. Info-center logfile size-quota size by default, the maximum size of a log file is 2 mb. To ensure normal operation, set the size argument to a value between 1 mb and 10 mb. 6. (optional.) specify the directory to save...
Page 265
251 step command remarks 1. Enter system view. System-view n/a 2. Enable the information center. Info-center enable by default, the information center is enabled. 3. Enable the saving of the security logs to the security log file. Info-center security-logfile enable by default, saving security logs ...
Page 266
252 the device supports multiple diagnostic log files. Each diagnostic log file has a maximum capacity. The diagnostic log files are named as diagfile1.Log, diagfile2.Log, and so on. When the capacity of diagfile1.Log is reached, the system compresses diagfile1.Log as diagfile1.Log.Gz and creates a ...
Page 267
253 step command remarks 1. Enter system view. System-view n/a 2. Set the maximum size of the trace log file. Info-center trace-logfile quota size by default, the maximum size of the trace log file is 1 mb. Outputting custom nat444 logs to a log host step command remarks 1. Enter system view. System...
Page 268
254 enabling duplicate log suppression the output of consecutive duplicate logs at an interval of less than 30 seconds wastes system and network resources. With this feature enabled, the system starts a suppression period upon outputting a log: • during the suppression period, the system does not ou...
Page 269
255 displaying and maintaining information center execute display commands in any view and reset commands in user view. Task command display the information of each output destination. Display info-center display the state and the log information of the log buffer (in standalone mode). Display logbu...
Page 270
256 # enable the display of logs on the console. (this function is enabled by default.) terminal logging level 6 terminal monitor the current terminal is enabled to display logs. Now, if the ftp module generates logs, the information center automatically sends the logs to the console, and the consol...
Page 271
257 local4.Info /var/log/device/info.Log in this configuration, local4 is the name of the logging facility that the log host uses to receive logs. Info is the informational level. The unix system records the log information that has a severity level of at least informational to the file /var/log/dev...
Page 272
258 # configure an output rule to enable output to the log host ftp logs that have a severity level of at least informational. [device] info-center source ftp loghost level informational 2. Configure the log host: the following configurations were performed on solaris. Other unix operating systems h...
Page 273
259 configuring flow log flow log records users' access to external networks based on flows. Each flow is identified by a 5-tuple of the source ip address, destination ip address, source port, destination port, and protocol number. Flow log creates entries based on nat sessions. You can export these...
Page 274
260 field description operator reasons why a flow log was generated: • 0—reserved. • 1—flow was ended normally. • 2—flow was aged out because of aging timer expiration. • 3—flow was aged out because of configuration change. • 4—flow was aged out because of insufficient resources. • 5—reserved. • 6—r...
Page 275
261 flow log configuration task list task at a glance (optional.) configuring the flow log version (optional.) specifying a source ip address for flow log packets (optional.) enabling load balancing for flow log entries (optional.) configuring the timestamp of flow logs (required.) perform one of th...
Page 276
262 h3c recommends that you use a loopback interface's address as the source ip address for flow log packets. A loopback interface is always up. The setting avoids export failure on interfaces that might go down. To configure the source ip address for flow log packets: step command remarks 1. Enter ...
Page 277
263 specifying a flow log export destination you can export flow log entries to a log host or the information center, but not both. If you configure both methods, the system exports flow log entries to the information center. • if the destination is a log host, flow log entries are sent as binary ch...
Page 278
264 flow log configuration example network requirements as shown in figure 78 , configure flow log on the device to send flow log entries generated for the user to the log host. Figure 78 network diagram configuration procedure # configure ip addresses, as shown in the network diagram. Make sure the...
Page 279
265 flow: export flow log as udp packet. Version: 3.0 source address: 2.2.2.2 log load balance function: disabled log host numbers: 1 log host 1: ip address/port: 1.2.3.6/2000 total logs/udp packets exported: 112/87.
Page 280
266 index a c d e f h i l m n o p s t a alarm function configuration example, 179 c configuration example for mpls vpn time synchronization in client/server mode, 104 configuration example for mpls vpn time synchronization in symmetric active/passive mode, 106 configuration example for ntp broadcast...
Page 281
267 displaying and maintaining user processes, 195 displaying the snmp settings, 166 e eaa configuration examples, 190 enabling duplicate log suppression, 254 enabling ipv6 netstream, 229 enabling load balancing for flow log entries, 262 enabling netstream, 212 enabling synchronous information outpu...
Page 282
268 setting the frequency of a bits clock, 145 setting the sa bit for the ssm of bits clocks, 144 snmpv1/snmpv2c configuration example, 167 snmpv3 configuration example, 168 sntp configuration example, 110 specifying a flow log export destination, 263 specifying a line clock input port, 146 specifyi...


