- DL manuals
- Jasco
- Measuring Instruments
- V-530
- Instruction Manual
Jasco V-530 Instruction Manual
Summary of V-530
Page 1
P/n:0302-0304c january 2003 v-530/550/560/570 spectrophotometer instruction manual v -500 for w indow s Ò.
Page 2: Safety Considerations
I safety considerations to ensure operation safety, this instrument must be operated correctly and maintained according to a regular schedule. Carefully read to fully understand all safety precautions in this manual before operating the instrument. Please take a moment to understand what the signal ...
Page 3: Warning
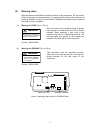
Ii (2) warning label warning labels are attached at several locations on this instrument. Do not remove, deface or damage the warning labels. If a warning label peels off the instrument or becomes illegible, contact your local jasco distributor and state the part number of the label you want to repl...
Page 4
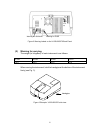
Iii warning for fuse warning for ground figure 2 warning labels on the v-550/560/570 back panel (2) warning for carrying the weight (in kilograms) of each instrument is as follows: v-530 v-550 v-560 v-570 16.0 30.5 32.0 33.0 when moving the instrument, hold the handgrips at the bottom of the instrum...
Page 5: Regulatory Statements
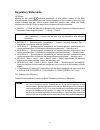
Iv regulatory statements ce notice marking by the symbol indicates compliance of this jasco system to the emc (electromagnetic compatibility) and low voltage directives of the european community. This symbol indicates that this jasco system meets the relevant basic safety and health requirements of ...
Page 6: Preface
V preface this instruction manual is your guide for using this instrument. It instructs first-time users on how to use the instrument, and serves as a reference for experienced users. Before using the instrument, please read this instruction manual carefully, and make sure that the contents are full...
Page 7: Installation Requirements
Vi installation requirements to ensure operation safety, observe the following conditions: (1) do not operate the instrument under voltage fluctuations exceeding 10% of the recommended line voltage. Otherwise, the instrument may not function properly. (2) frequency or spike noise in the power supply...
Page 8: Servicing
Vii servicing contact your local jasco distributor for instrument servicing. In addition, contact your jasco distributor before moving the instrument to another location. Consumable parts should be ordered according to part number from your local jasco distributor. If a part number is unknown, give ...
Page 9: Limited Warranty
Viii limited warranty products sold by jasco, unless otherwise specified, are warranted for a period of one year from the date of shipment to be free of defects in materials and workmanship. If any defects in the product are found during this warranty period, jasco will repair or replace the defecti...
Page 10: Contents
Ix contents safety considerations................................................................................................................. I regulatory statements.............................................................................................................. Iv preface ...........
Page 11
X 4.1 [file] menu ..................................................................................................................... 30 4.1.1 [new...] ................................................................................................................................. 30 4.1.2 [open.....
Page 12
Xi 6.1.1 [start].................................................................................................................................... 61 6.1.2 [parameter...] ........................................................................................................................ 61 6.1...
Page 13
Xii.
Page 14: 1. Introduction
1 1. Introduction 1.1 layout of this m anual t his section describes the layout and function of this m anual. T he v -500 for w indow s Ò instruction m anual consists of 10 sections, including this one. R ead this m anual carefully in order to ensure a full understanding of the operating procedures ...
Page 15
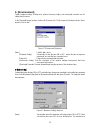
2 t he follow ing notational conventions are used throughout this m anual: general notation notation meaning [measurement] menu [parameters...] command names of menus, commands, and text boxes are enclosed in square brackets [ ], followed by a description indicating whether the function is a menu, c...
Page 16
3 eight w avelengths can be set and m easured. (5) [a bs/% t m eter] program t his program reproduces the analog spectrophotom eter on the c r t screen, so you can read the absorbance (a bs) or transm ittance (% t ) at an arbitrary w avelength on the m eter. (6) [e nvironm ent] program t his program...
Page 17
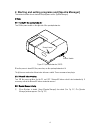
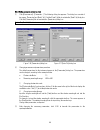
4 2. Starting and exiting programs and [spectra manager] t his section describes how to start and exit program s and the [s pectra m anager]. 2.1 s tartup 2.1.1 t urning o n the spectrophotom eter t urn o n the pow er sw itch on the right side of the spectrophotom eter. "power" switch "power" lamp f...
Page 18
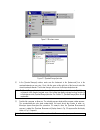
5 f igure 2.2 w indow s screen f igure 2.3 [s pectra m anager] w indow (2) in the [s pectra m anager] w indow , m ake sure the instrum ent in the [instrum ents:] box is the spectrophotom eter you are using. If not, click the arrow at the right side of the box and select the correct spectrophotom ete...
Page 19
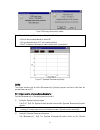
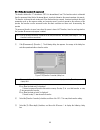
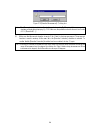
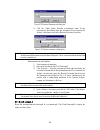
6 f igure 2.4 m essage boxes during startup n ote: c heck the follow ing if the m essage on the right in fig. 2.4 appears. · p ow er to the spectrophotom eter is turned o n . · the spectrophotom eter and p c are correctly interfaced. · the p c environm ent (for exam ple, com m unication port) is cor...
Page 20
7 m anager] w indow appears. (3) e xiting the [s pectra m anager] program c lick [a pplications] - [e xit]. (4) e xiting w indow s e xit w indow s according to the w indow s u ser ’ s g uide. 2.2.2 p c and spectrophotom eter shutdow n (1) t urn o f f the pow er to the p c and display. D o not forget...
Page 21
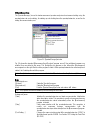
8 2.3 [s pectra m anager] m enu t he [s pectra m anager] is used to start m easurem ent, spectra analysis and environm ent setting using the spectrophotom eter, and selecting, for starting up and shutting dow n the spectrophotom eter, as w ell as for setting the com m unication port. F igure 2.6 [s ...
Page 22
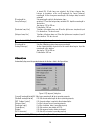
9 [o ption...] install the optional accessory (r efer to the accessory instruction m anual). [a bout...] d isplays the version inform ation of the control driver of the spectrophotom eter. [h elp] m enu [c ontents] d isplays the help c ontents w indow . [s earch t opic] d isplays the keyw ord w indo...
Page 23
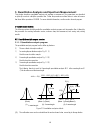
10 3. Quantitative analysis and spectrum measurement t his section describes quantitative analysis and spectrum m easurem ent. T he param eters are described only briefly in order to clarify the operation flow . F ollow the procedures outlined below in order to becom e fam iliar w ith the operation ...
Page 24
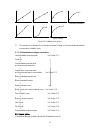
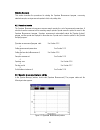
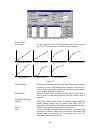
11 segmented line logistic function spline function proportional expression linear expression quadratic expression third-order expression f igure 3.2 c alibration curve m odes (3) t he operator can set w hether to use standard m easurem ent data (set of concentration/absorbance) to calculate the cal...
Page 25
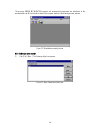
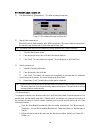
12 t he m essage u n d e r in it ia liz a t io n appears and m easurem ent param eters are transferred to the spectrophotom eter. W hen transfer is finished, the program starts and the follow ing w indow appears. F igure 3.3 [q uantitative analysis] w indow 3.1.3 c alibration curve creation (1) c li...
Page 26
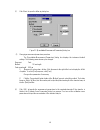
13 (2) c lick to open the follow ing dialog box. F igure 3.5 [q uantitative m easurem ent p aram eters] dialog box (3) c hanging m easurem ent param eters procedure t he [q uantitative m easurem ent p aram eters] dialog box displays the instrum ent default settings. T he follow ing param eters m ay ...
Page 27
14 f igure 3.6 [c alibrate c urve p aram eters] dialog box (5) c alibration curve param eter setting 1) s et [c alib. Curve] to [p roportional]. U se the sam e procedure as for changing param eters 2) if [s tandard blank] is know n, input that value to the text box. If the [s tandard blank] is unkno...
Page 28
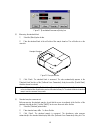
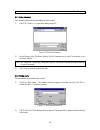
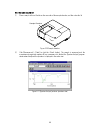
15 f igure 3.7 [q uantitative m easurem ent] dialog box (8) m easuring the standard blank 1) s elect the [b lank] option button. 2) p lace the standard blank in the cell holder of the sam ple cham ber. T he cell holder is on the near-side. Sample chamber f igure 3.8 s am ple cham ber 3) c lick . T h...
Page 29
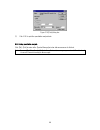
16 [u se] field changes from [---] to [u se]. T he cursor autom atically m oves to the next line. N ote: the standard blank value is not subtracted from the absorbance in the standard data display field. 4) r epeat steps 2) and 3) as m any tim es as the num ber of standard sam ples. 5) a fter standa...
Page 30
17 (2) invalidating 1) m ove the cursor to the incorrect data line. 2) u nselect the [e nable c alib. D ata] checkbox, and then click . T he [u se] changes to [---]. 3.1.5 s aving quantitative analysis m ethod s ave to disk the quantitative analysis m ethod (calibration curve data) and the m easurem...
Page 31
18 3.1.6 u nknow n sam ple m easurem ent (1) c lick [m easurem ent] - [m easurem ent...]. T he follow ing dialog box appears. F igure 3.11 [q uantitative m easurem ent] dialog box (2) s am ple blank m easurem ent m easure the sam ple blank according to the follow ing procedure. If the sam ple blank ...
Page 32
19 n ote: the line w ith the incorrect m easurem ent can be invalidated (see s ection 4.4.4, “[title...]”). 3.1.7 s aving data sheet s ave to disk the data sheet and quantitative analysis m ethod. (1) c lick [f ile] - [s ave a s...] to open the follow ing dialog box. F igure 3.12 [s ave a s] dialog ...
Page 33
20 f igure 3.14 [p rint] dialog box (3) c lick to print the quantitative analysis data. 3.1.9 e xiting quantitative analysis c lick [f ile] - [e xit] to return to the [s pectra m anager] w indow after m easurem ent is finished. N ote: if unsaved [d ata s heet] and/or [c alibrate c urve] data exist, ...
Page 34
21 3.2 s pectrum m easurem ent t his section describes the procedures for starting the s pectrum m easurem ent program , m easuring standard sam ples, saving m easured spectra to disk, and printing data. 3.2.1 p rocedural overview t he s pectrum m easurem ent program m easures sam ple spectra for a ...
Page 35
22 3.2.3 s etting m easurem ent param eters (1) c lick [m easurem ent] - [p aram eter...]. T he follow ing dialog box appears. T he dialog box consists of tw o pages, [p aram eter] and [d ata f ile]. C lick the [d ata f ile] tab to activate the [d ata f ile] dialog box. C lick the [p aram eters] tab...
Page 36
23 3.2.4 s etting the baseline(or m easurem ent) t he baseline defines the “ 0 ” absorbance (100% for transm ittance) level. T he baseline value is subtracted from the m easured data (divided for transm ittance) in order to determ ine the correct spectrum of a sam ple. T he baseline is inherent to e...
Page 37
24 f igure 3.19 [b aseline m easurem ent] (1) dialog box n ote: if the button is clicked w ithout putting a check m ark to [full w avelength], m easurem ent w ill start im m ediately w ithout displaying fig. 3.20. In this case, the partial baseline is m easured (see s ection 4.2.1.3 [b aseline (b )....
Page 38
25 3.2.5 s am ple m easurem ent (1) p lace a sam ple in the cell holder on the near-side of the sam ple cham ber, and then close the lid. Sample chamber f igure 3.20 s am ple cham ber (2) c lick [m easurem ent] - [s tart] (or click the button). T he sam ple is m easured and the m easurem ent progres...
Page 39
26 3.2.6 s pectrum save s pectra can be saved in a file. (1) c lick [f ile] - [s ave a s...]. T he follow ing dialog box appears. F igure 3.22 [s ave a s] dialog box (2) input the filenam e in the [f ile n am e] text box. U p to 8 characters can be input. T he extension is not required (after the “ ...
Page 40
27 (2) c lick [f ile] - [p rint...] to print the spectra. 3.2.8 instrum ent shutdow n (1) e xiting the [s pectra a nalysis] program c lick [f ile] - [e xit]. T he [s pectra a nalysis] w indow closes and the [s pectrum m easurem ent] w indow appears. N ote: if an unsaved spectrum exists, a m essage a...
Page 41: 4. [Quantitative Analysis]
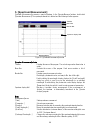
28 4. [quantitative analysis] d ouble-click [q uantitative a nalysis] in the [s pectra m anager] w indow . T he program starts and the follow ing w indow appears after spectrophotom eter initialization. Calibration curve data sheet method's information f igure 4.1 [q uantitative a nalysis] w indow [...
Page 42
29 m anager]. [m ethod] m enu [n ew ...] c reates a new calibration curve. [o pen...] o pens saved quantitative analysis m ethod files. [s ave a s...] s aves quantitative analysis m ethod data, including calibration curve, and m easurem ent param eters. [m odify...] e dits existing calibration curve...
Page 43
30 o pens a saved [d ata s heet] file ([f ile]-[o pen...]) p rints the data from the active w indow set by [p age s etup...] ([f ile]-[p rint...]) 4.1 [file] m enu 4.1.1 [n ew ...] o pens a new [d ata s heet] display. N ote: if an unsaved [d ata s heet] and/or [c alibrate c urve] is in the w indow w...
Page 44
31 f igure 4.3 [inform ation] dialog box f igure 4.4 [d ata s heet] w indow a n unknow n sam ple can be m easured from the [d ata s heet] w indow using the displayed quantitative analysis m ethod..
Page 45
32 4.1.2 [o pen...] o pens a saved [d ata s heet] file. N ote: if an unsaved [d ata s heet] or [c alibrate c urve] is in the w indow w hen [o pen...] is clicked, a m essage appears to ask the operator w hether the data should be saved. P roceed according to the m essage. F igure 4.5 [o pen] dialog b...
Page 46
33 4.1.4 [s ave a s...] s aves the active [d ata s heet] under a new filenam e. M easurem ent param eters and calibration curve data are also saved. F igure 4.6 [s ave a s] dialog box [s ave in] s ets target drive or directory. A vailable drives or directory appear in the drop-dow n list box. F ile ...
Page 47
34 4.1.5 [p age s etup...] s ets print contents such as [d ata s heet], calibration curve, or m easurem ent param eters. F igure 4.8 [p rint f orm at] dialog box [t itle] t itle input text box. U p to 62 characters m ay be input. [p attern] group the quantitative analysis m ethod or results can be p...
Page 48
35 4.1.7 [p rint...] p rints the data from the active w indow set in [p age s etup...]. F igure 4.10 [p rint] dialog box [p rint range] o nly [a ll pages] is available. [p rint q uality] list s ets print quality. C annot be set for som e printers. T he resolution of the printer is in dpi, w hich is ...
Page 49
36 4.2 [m ethod] m enu 4.2.1 [n ew ...] c reates a new calibration curve. C lick [n ew ...] to open the follow ing dialog box. N ote: if a calibration curve has not been saved, a m essage appears to ask the operator w hether to save it. P roceed according to the m essage. F igure 4.11 [q uantitative...
Page 50
37 0.5 2 1 4 2 (l2) 8 5 (l5) 20 10 (l10) 40 [m ethod] n o. Of w avelengths used in quantitative analysis. S elects optim um num ber. Of w avelengths (1, 2, or 3) according to the sam ple condition. 1-w avelength: f or com m on solution sam ple. S ee f ig. 4.13 (1). 2-w avelength: f or baseline corre...
Page 51
38 f igure 4.13 [c alibrate c urve p aram eters] dialog box [g raph s etting] [c alib c urve] t he type of calibration curve. C lick the drop-dow n form at box and select a type. F ig. 4.15 show s the nam es of m odes and types of graphs. Segmented line logistic function spline function proportional...
Page 52
39 [e nable c alib. D ata] d ata in the standard data display field can be used for the calibration curve by selecting the [e nable c alib. D ata] checkbox. S elect the checkbox (x), then click . T he colum n w ith [---] in the standard data display field is rew ritten to [u se]. C lick to w rite in...
Page 53
40 : c loses the dialog box w ithout changing the previously set w avelength. S ets the absorbance value of the current w avelength to zero. E xits the [c alibrate c urve p aram eters] dialog box and opens the [c alibrate c urve] and [m ethod inform ation] w indow s. F igure 4.17 [c alibrate c urve]...
Page 54
41 4.2.3 [s ave a s...] s aves quantitative analysis m ethod data, including calibration curve, and m easurem ent param eters. F igure 4.18 [s ave p aram eters] dialog box [p aram eter n am e] t ext box for inputting the quantitative analysis m ethod filenam e. U p to 32 characters m ay be input. If...
Page 55
42 4.2.5 [inform ation...] w hen the [m ethod inform ation] w indow is in icon form , starting this function opens the original w indow again. F igure 4.20 [m ethod inform ation] w indow 4.3 [m easurem ent] m enu 4.3.1 [m easurem ent...] u se this function to m easure a sam ple blank or unknow n sam...
Page 56
43 c loses the [q uantitative m easurem ent] dialog box. M oves the w avelength of the spectrophotom eter to a set w avelength (see f ig. 4.16). S ets the absorbance value at the current w avelength to zero. 4.3.2 [p aram eters...] c lick [m easurem ent] - [p aram eters...] to set m easurem ent para...
Page 57
44 4.4 [e dit] m enu 4.4.1 [c opy p icture] c opies a calibration curve to the clipboard as a picture. 4.4.2 [c opy b itm ap] c opies a calibration curve to the clipboard as a bitm ap. S uitable for editing graphs using paint-type softw are such as p aintbrush. 4.4.3 [c opy t ext] c opies the result...
Page 58
45 4.5.1 [f ont...] s ets the font for the [d ata s heet] or calibration curve. W hen the [c alibrate c urve] w indow is active, the follow ing w indow opens before the [f ont] dialog box appears. F igure 4.26 [f ont s etting] dialog box [item ] lists the item s for w hich the font can be set. [a xi...
Page 59
46 f igure 4.27 [f ont] dialog box [f ont] list s elect a font from this list. [f ont s tyle] list s elect a font style from this list. [s ize] list s et a font size. [e ffects] s et special character styles such as strike-through or underlined. [c olor] list s et a font color. [s am ple] d isplays ...
Page 60
47 [a uto] checkbox to set the scale to the optim al value according to the calibration curve data. T his function is active only w hen the [c alibrate c urve] w indow is active. F igure 4.30 [s cale] dialog box 4.5.5 [p attern...] c lick [v iew ] - [p attern...] to set the calibration curve, fram e...
Page 61
48 f igure 4.32 [g rid lines] dialog box [m ain] s elect the [v ertical a xis] and/or [h orizontal a xis] checkbox to display the scale line. [a uxiliary] n ot used [a s d efault] s elect the [a s d efault] checkbox to use the set grid lines in subsequent displays in the [c alibrate c urve] w indow ...
Page 62
49 4.5.8 [m arker...] c lick [v iew ] - [m arker...] to set the type, size, and color of the m arker used to indicate specific data points on the calibration curve, and w hether to fill the inside of the m arker. F igure 4.34 [m arker s ettings] dialog box [t ype] lists the types of m arkers availab...
Page 63: 5. [Spectrum Measurement]
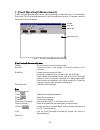
50 5. [spectrum measurement] [s pectrum m easurem ent] m easures a sam ple spectrum . In the [s pectra m anager] w indow , double-click [s pectrum m easurem ent]. T he spectrophotom eter is initialized and the follow ing w indow appears. Title bar menu bar monitor bar spectrum display field f igure ...
Page 64
51 [e xit] e xits the spectrum m easurem ent program and returns to [s pectra m anager]. [h elp] m enu [a bout...] d isplays inform ation such as the program version. 5.1 [m easurem ent] m enu 5.1.1 [s tart] s tarts spectrum m easurem ent. T he spectrum is displayed in real tim e. D uring m easurem ...
Page 65
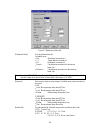
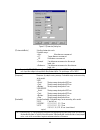
52 f igure 5.3 [p aram eters] dialog box [p hotom etric m ode] s ets the photom etric m ode. S electable range: a bs: a bsorbance m easurem ent % t : t ransm ittance m easurem ent % r : r eflectance m easurem ent s am ple: s ingle-beam m easurem ent on the sam ple beam side r eference: s ingle-beam ...
Page 66
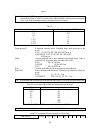
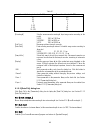
53 region) n ote: w hen using the v -570 for m easurem ent from the near-infrared region to the visible region in succession, the bandw idths listed in table 5.1 should be paired. If the bandw idth is set to the sam e (nearly equal) value, noise in the near-infrared region m easurem ent value w ill ...
Page 67
54 s canning s peed (nm /m in) 10* 20* 40 100 - 200 - - 400 - - - 1000 - - - - 2000 - - - - - 4000 - - - - - - *d ata pitch of 0.025 and 0.05 nm and scanning s peeds of 10 and 20 nm /m in are not available on the v -530. [s am ple n o.] s ets w hich sam ple should be m easured first. S ubsequent sam...
Page 68
55 s aves param eters. R eturns to the [p aram eters] dialog box w ithout saving the param eters. D isplays the param eters selected from the param eter list. U se to confirm selections. D eletes set param eters from the param eters list. P reviously saved param eters in the param eter library can b...
Page 69
56 are saved autom atically. [f ile n am e] t ext box for inputting the filenam e of autom atically saved data. U p to 5 characters m ay be input. T he last 3 characters reflect the sam ple num ber. T he num ber increases in increm ents of 1 each tim e data is saved. [d irectory] t ext box for input...
Page 70
57 f igure 5.8 [p aram eters-o pen] dialog box s electing a filenam e from [p aram eters list] and clicking loads it into m em ory and rew rites [b aseline param eters] to those of the file. If the baseline m easurem ent param eters differ from the currently set m easurem ent param eters, a w arning...
Page 71
58 f igure 5.10 [b aseline m easurem ent] dialog box 4) c lick the button. B aseline m easurem ent starts. D uring m easurem ent, the follow ing dialog box is displayed. W hen m easurem ent finishes, a check m ark is put in the [b aseline c orrection] check box. F igure 5.11 b aseline m easurem ent ...
Page 72
59 f igure 5.12 [g oto w avelength] dialog box [w avelength] t ext box for inputting a w avelength. M oves the spectrophotom eter w avelength to the set w avelength. C loses the dialog box w ithout changing the previously set w avelength. 5.1.5 [a uto z ero] s ets the absorbance (or transm ittance) ...
Page 73
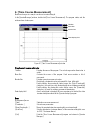
60 6. [time course measurement] m easures changes in a sam ple over tim e at a set w avelength. In the [s pectra m anager] w indow , double-click [t im e c ourse m easurem ent]. T he program starts, and the w indow show n below opens. Title bar menu bar monitor bar data display field f igure 6.1 [t ...
Page 74
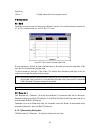
61 [h elp] m enu [a bout...] d isplays inform ation such as program version. 6.1 [m easurem ent] m enu 6.1.1 [s tart] s tarts tim e course m easurem ent. C hanges are displayed in real tim e. T he vertical axis during m easurem ent is 0 to 1 a bs in photom etric m ode, and 0 to 100 in t % m ode. F i...
Page 75
62 f igure 6.3 [p aram eter] dialog box [p hotom etric m ode] s ets the photom etric m ode. S electable range: a bs: a bsorbance m easurem ent % t : t ransm ittance m easurem ent % r : r eflectance m easurem ent s am ple: s ingle-beam m easurem ent on the sam ple beam side r eference: s ingle-beam m...
Page 76
63 t able 6.1 u ltraviolet/visible region bandw idth (u v ) nm n ear-infrared bandw idth (n ir ) nm 0.1 0.4 0.2 0.8 0.5 2 1 4 2 (l2) 8 5 (l5) 20 10 (l10) 40 [w avelength] s ets the m easurem ent w avelength. Input range varies according to the m odel. V -530: 190.0 to 1100.0 nm v -550/560: 190.0 to ...
Page 77
64 6.2 [h elp] m enu [a bout...] d isplays inform ation such as program version..
Page 78
65 7. [fixed wavelength measurement] [f ixed w avelength m easurem ent] m easures sam ple absorbance or transm ittance at a fixed w avelength. D ouble-click [f ixed w avelength m easurem ent] in the [s pectra m anager] w indow . T he program starts and the w indow show n below appears. Title bar men...
Page 79
66 [a bout...] d isplays inform ation such as program version. 7.1 [m easurem ent] m enu 7.1.1 [s tart] s tarts fixed-w avelength m easurem ent. T o suspend m easurem ent, click . 7.1.2 [b lank] ( ) [b lank c orrect] ([c orrect]) s tarts blank m easurem ent. W hen finished, the blank value (b lk ) a...
Page 80
67 7.1.3 [p aram eter...] s ets param eters, and saves them to the hard disk. C lick [m easurem ent] - [p aram eter...] to display the dialog box show n below . F igure 7.3 [param eters] dialog box [p hotom etric m ode] s ets the photom etric m ode. S electable range: a bs: a bsorbance m easurem ent...
Page 81
68 n ote: w hen using the v -570 for m easurem ent from the near-infrared region to the visible region in succession, the bandw idths listed in table 7.1 should be paired. If the bandw idth is set to the sam e (nearly equal) value, noise in the near-infrared region m easurem ent value w ill increase...
Page 82
69 e nds param eter setting. C lick this button to transfer the set param eters to the spectrophotom eter. A t the sam e tim e, the dialog box closes. S tops param eter setting w ithout changing the previous settings, and closes the dialog box. S aves param eters in the param eter library on the har...
Page 83: 8. [Abs/%t Meter]
70 8. [abs/%t meter] [a bs/% t m eter] is a display of the analog spectrophotom eter on the screen. Y ou can read a bsorbance (a bs) or transm ittance (% t ) at a set w avelength. In the [s pectra m anager] w indow , double-click [a bs/% t m eter]. T he program starts and the w indow below appears. ...
Page 84
71 m edium : m oving average during about 1 sec s low : m oving average during about 4 sec [b and w idth] s pectral bandw idth. S electable range varies according to the m odel. V -530: f ixed at 2 nm v -550/560: 0.1, 0.2, 0.5, 1, 2, 5, 10 nm v -570: 0.1, 0.2, 0.5, 1, 2, 5, 10 nm 0.4, 0.8, 2, 4, 8, ...
Page 85: 9. [Environment]
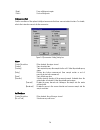
72 9. [environment] s ystem hardw are setting, self-diagnosis, optional accessory setting, and w avelength correction can be started from this m enu. In the [s pectra m anager] w indow , double-click [e nvironm ent]. T he [e nvironm ent] dialog box show n below appears. C lick an item . F igure 9.1 ...
Page 86
73 is turned o n . If both lam ps are selected, the lit lam p changes from halogen to deuterium at the set [w avelength for lam p e xchange] w avelength. A t the changeover w avelength, the halogen lam p becom es activated. [w avelength for s ets w avelength at w hich the deuterium lam p lam p e xch...
Page 87
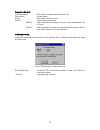
74 d oes self-diagnosis again. E nds self-diagnosis. 9.3 [accessories s etting] s ets the conditions of the optional intelligent accessories that have com m unication functions. F or details, refer to the instruction m anuals for the accessories. F igure 9.4 [a ccessories s etting] dialog box s ippe...
Page 88
75 t em perature c ontroller [c ontrol] check box w hen checked, the tem perature controller is used. [t em perature] s et tem perature. [s tirrer] w hen checked, the stirrer is used. [s ensor] s elects a tem perature sensor. [internal]: a llow s tem perature m easurem ent using the sensor incorpora...
Page 89: 10. Appendix
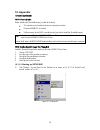
76 10. Appendix 10.1 s pectra m anager installation 10.1.1 b efore installation b efore installing the [s pectra m anager], confirm the follow ing: * t he com puter and all peripheral devices are properly connected. * w indow s 95/98/n t 4.0 is installed. * s ufficient space (about 5 m b ) is availa...
Page 90
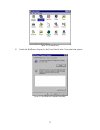
77 f igure 10.2 [c ontrol p anel] (2) d ouble-click [a dd/r em ove p rogram s] in the [c ontrol p anel] w indow . T he w indow below appears. F igure 10.3 [a dd/r em ove p rogram s p roperties].
Page 91
78 (3) s elect [install/u ninstall], then click the button. T he w indow below appears. F igure 10.4 [install p rogram f rom f loppy d isk or c d -r o m ] (4) c lick the button in the w indow show n in f ig. 10.4. T he w indow show n in f ig. 10.5 appears. F igure 10.5 [r un installation p rogram ].
Page 92
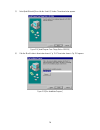
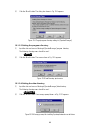
79 (5) c lick the button. T he w indow below appears. F igure 10.6 [s pectra m anager] for w indow s s etup (6) c lick the button. T he screen show n in f ig. 10.7. Appears. F igure 10.7 10.1.2.2 inputting operator name or company name (1) input the nam e of the operator or com pany in the text box ...
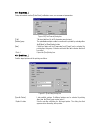
Page 93
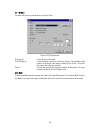
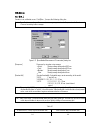
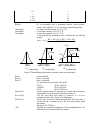
80 (2) c lick the button. T he dialog box show n in f ig. 10.8 appears. F igure 10.8 t arget program directory setting for [s pectra m anager] 10.1.2.3 setting the program directory (1) input the drive and nam e of the target [s pectra m anager] program directory. T he follow ing directory nam e sho...
Page 94
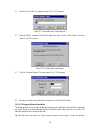
81 (3) c lick the button. T he dialog box show n in f ig. 10.11 appears. F igure 10.11 [s pectra m anager] s etup dialog box (4) insert the [ja s c o instrum ent] disk into the floppy disk drive. C lick the button. T he screen show n in f ig. 10.12 appears. F igure 10.12 c onfirm ation of control dr...
Page 95
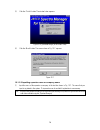
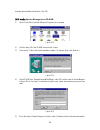
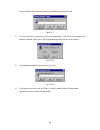
82 indicating that installation has finished. C lick . 10.1.3 installing spectra manager from cd-rom (1) o pen [c ontrol p anel], select [a dd/r em ove p rogram s] to run program . F igure 10.14 (2) p lace the setup c d in the c d -r o m drive and click . (3) t he m essage " if this is the correct i...
Page 96
83 p lease select and click [instrum ent driver v er x.Xx.Xx\d isk1] to continue the setup. F igure 10.17 (6) t he next step w ill be to set up each of the various applications. C lick on the taskbar and proceed to [program ], then [jasco], then [s pectra m anager setup] and click to run program . F...
Page 97
84 10.2 s etting the s erial p ort (r s -232c ) t he serial port default value is [c o m 1]. T he serial port num ber m ust be changed w hen the s pectrophotom eter is controlled through another port. T he procedure is as follow s: f igure 10.20 [s pectra m anager] w indow (1) c lick [instrum ents] ...
Page 98
85.
Page 99
Jasco corporation 2967-5 ishikawa-machi, hachioji tokyo, japan printed in japan.

