Summary of LBO-516
Page 2: Warning!
Warning! The servicing instructions contained in this manual are for use by qualified personnel only. To avoid electric shock, do not perform any servicing other than that contained in the operating instructions unless you are qualified to do so..
Page 3
Lbo-516 100 mhz delayed time base osciiloscope table of contents 1. Generalinformation........................................................................................................................................1 1-1 introduction ..............................................................
Page 4
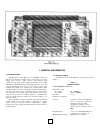
1. General information 1-1. Introduction the lbo-516, shown in figure 1-1, is a 100 mhz oscilloscope with all of the features normally found on a lab-grade scope: high- fidelity pulse response, stable operation, dual timebase with calibrated sweep delay, flexible triggering facilities, and a bright ...
Page 5
Signal delay leading edge displayed. Leading edge displayed. Ch-1 only, ch-2 only, ch-1 & ch-2 displayed alternately, ch-1 & ch-2 chopped (at 250 khz rate), ch-1 & ch-2 added, ch-1 & ch-2 subtracted, ch-1 & ch-2 & ch-3 displayed alternately, ch-1 & ch-2 & ch-3 chopped, ch-1 & ch-2 & ch-3 & ch-1 + ch...
Page 6
Weight 20.9 lbs, 9.5 kg ambient operating 0-40°c (32-104°f) maximum temperature 15-35°c (60-95°f) for guaranteed specs vibration tolerance 2 mmp-p displacement at 12-33 hz and 33-35 hz shock tolerance 30g accessories supplied instruction manual two (2) lp- 100x probes two (2) bnc-to-post adaptors op...
Page 7
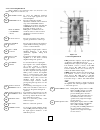
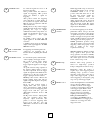
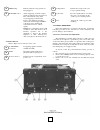
2-1-2 vertical amplifier block refer to figure 2-2 for references (10) to (12) and (14) to (23). Refer to figure 2-3 for reference (13). Volts/div switches to select the calibrated deflection factor of the input signals fed to the vertical amplifier. Variablecontrols provide continuously variable ad...
Page 8
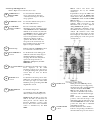
2-1-3 sweep and trigger blocks refer to figure 2-3 for reference (24) to (42). Atime/div and to select either the calibrated delay time sweep of the main (a) time-base switch or the delay time range for delayed- sweep operation. B time/div switch to select the calibrated sweep rate of the delayed (b...
Page 9
Source switch to select the signal used for a or b time-base triggering. Ch-1 position selects the channel 1 signal for triggering. Ch-2 position selects the channel 2 signal for triggering. Alt position selects the triggering mode that allows a stable display of two asynchronous signals on the crt....
Page 10
Trig'd lamp indicates when the sweep generator is being triggered. Holdoff control allows triggering on certain complex signals by changing the hold-off (dead) time of the main (a) sweep. This avoids triggering on intermediate trigger points within the repetition cycle of the desired display. Norm i...
Page 11
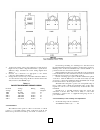
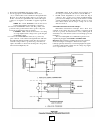
4. Compare the wiring of the power transformer to that shown in figure 2-5. If you want to adapt the instrument to operate from a different voltage, determine the correct wiring diagram from table 2-1. 5. Unsolder any connections not appropriate to the desired connection, and install the new wiring....
Page 12
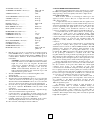
Volts/div switches (10) ............. 2v variable volts/div controls (11) fully cw, and pushed in v mode switches (21) ................ Alt vertical position controls (17 & 18) index up a inten control (3) ................... Index up focus control (5) ..................... Index up illum control (8...
Page 13
10
Page 14
If a low-resistance ground connection between oscilloscope and circuit is not established, enormous amounts of hum will appear in the displayed signal. Generally, the outer conductor of shielded cable provides the ground connection. If you are using plain lead wire, be certain to first connect a gro...
Page 15
And a vertically-deflected but non-synchronized display when vertical signal is present but the trigger controls improperly set. This immediately indicates what is wrong. The only problems with auto operation are that signals below 20 hz cannot, and complex signals of any frequency may · not, reliab...
Page 16
Test signal. To trigger the scope at the vertical (field) rate, select the tv-v position. To trigger the scope at the horizon- tal (line) rate, select the tv-h position. When either tv pos- ition is used, the slope switch (39) must be matched to the polarity of the video signal. Leave the slope push...
Page 17
Cult. Triggering from the stable leading edge (+ slope) yields a trace that has only the trailing-edge jitter of the original signal. If you are ever in doubt, or have an unsatisfactory display, try both slopes to find the best way. The level control determines the point on the selected slope at whi...
Page 18
To compensate a probe for ch-3, proceed as follows: 1. Connect the probe to the ch-3 or ext trig in connector (35) and a 1000 hz signal source set for 8 vp.P output amplitude. 2. Set the a time/div switch to .2 ms, the source switch to .2 v/div, and the coupling switch to dc. 3. Press the alt v mode...
Page 19
2. Press either alt or chop v mode pushbutton (21). Press alt for relatively high-frequency displays (a time/div switch set at .2 ms or faster); press chop for relatively low- frequency displays (a time/div switch set at .5 ms or slower). If the chop pushbutton is pressed when fast sweep speeds are ...
Page 20
5. Press the add v mode pushbutton (21)· the single trace resulting is the algebraic difference of the ch-1 and ch-2 signals. Either or both of the vertical position controls (17) and (18) can be used to shift the resultant trace. Note: if the input signals are in-phase, the amplitude of the resulta...
Page 21
1. Set the following controls as indicated. Any control not mentioned here or in the following steps can be neglected. Pull quad control (23) ........................... Pulled out ch-2 inv switch (19) ................................. Out variable volts/div controls (11) fully cw, and pushed in ac/...
Page 22
B intensity adjustment. The b trace brightness varies relative to a trace brightness as the difference in a and b time/div switch setting varies. The b inten control (4) allows compensatory adjustment for the brightness difference. This control can be rotated clockwise for increased brightness. Alte...
Page 23
Triggered b sweep. In basic delayed sweep, the b timebase is not triggered by a signal event; it begins when the main sweep (a timebase) ends. This is readily seen in the alternate sweep mode. The only problem with this is that main timebase jitter becomes apparent in the b sweep when at high ratios...
Page 24
To intensity modulate the crt, simply connect the mod- ulating signal to the z axis input connector (43) on the back panel. The modulating signal must exceed + 2 volts dc to completely blank the trace at any brightness setting. At low brightness levels, blanking may occur at signal voltages as low a...
Page 25
3. Position the ac/gnd/dc switch (16) to gnd. 4. Use the appropriate vertical position control (17) or (18) to set the baseline on the central horizontal graticule line. However, if you know the signal voltage is to be positive,use the 0% or bottom-most graticule line. If you know the signal voltage...
Page 26
And measured. The ground terminals from the two probes or cables are simply connected to the chassis or ground bus of the circuit under observation. Figure 2-16b shows the connection technique needed for low-level signals in a noisy environment (strong ac fields). Using a separate ground connection ...
Page 27
If the points between which the time difference exists are less than 1 major division apart and located in the middle of complex waveforms that are otherwise in phase, use the delayed (b) timebase as described in 2-3-9 delayed timbase operation to select and expand that section of the complex wavefo...
Page 28
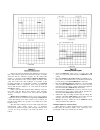
Measuring phase shift of signal-processing devices, the test setup shown in figure 2-22 can be used. Dual-trace method. This method works with any type of waveform (sine, triangle, rectangular, complex pulse, etc.). In fact, it will usually work even if different waveforms are being compared. This m...
Page 29
6. Move the off-screen trace back on the crt with its vertical position control, precisely centering it vertically. Use the associated volts/div switch (10) and variable control (11) to adjust its amplitude to exactly 6 vertical divisions. 7. The horizontal distance between corresponding points on t...
Page 30
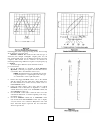
5. Superimpose the two traces with the vertical position controls (17) and (18), and use the variable volts/ div control (11) of the larger trace to achieve the best trace match. 6. Any uniform horizontal displacement of the traces is simply phase difference (described in paragraph 2-4-4). Any other...
Page 31
2-4-8 -- 3 db bandwidth measurement bandwidth measurement usually involves finding the -3 db response point in the frequency-response curve of a circuit or device. This can easily be determined without the need for calculations or db conversions by using the following "trick": 1. Connect the output ...

