- DL manuals
- LeCroy
- Test Equipment
- 9300C Series
- Operator's Manual
LeCroy 9300C Series Operator's Manual
Summary of 9300C Series
Page 1
Operator’s manual lecroy 9300c series digital oscilloscopes revision a — january 1998.
Page 2
Lecroy corporation 700 chestnut ridge road chestnut ridge, ny 10977–6499 tel: (845) 578 6020, fax: (845) 578 5985 lecroy sa 2, rue du pré-de-la-fontaine 1217 meyrin 1/geneva, switzerland tel: (41) 22 719 21 11, fax: (41) 22 782 39 15 internet: www.Lecroy.Com copyright © january 1998, lecroy. All rig...
Page 3
Iii contents chapter 1 — read this first! Product and client care..............................................................1–1 chapter 2 — instrument architecture general designed capabilities ................................................2–1 block diagrams........................................
Page 4
Iv contents chapter 8 — triggers and when to use them choosing the right trigger .......................................................8–1 edge or smart?..............................................................................8–2 edge trigger.......................................................
Page 5
V chapter 13 — waveform store & recall waveform store ......................................................................13–1 waveform recall ....................................................................13–4 chapter 14 — cursors/measure & parameters cursors: tools for measuring signal valu...
Page 6: Product and Client Care
1–1 read this first! 1 product and client care we recommend you thoroughly inspect the contents of the scope packaging at once. Check all the contents against the packing list/invoice copy shipped with the instrument and the list on page 1–3 of this manual. Unless lecroy is notified promptly of a mi...
Page 7
1–2 read this first! Product assistance help on installation, calibration, and the use of lecroy equipment is available from the lecroy customer service department in your country (see contact numbers following the index). Maintenance agreements we provide a variety of customer support services. Mai...
Page 8
1–3 billed for parts and labor related to the repair work, and for shipping..
Page 9
1–4 read this first! How to return a product contact your country’s customer service department or local field office to find out where to return the product. All returned products should be identified by model and serial number. You should describe the defect or failure, and provide your name and c...
Page 10
2–1 2 instrument architecture general designed capabilities your oscilloscope is the newest version of a series that set the standard for monochrome dsos (digital storage oscilloscopes). Each of the scope’s channels has an 8-bit adc (analog–to–digital converter). On the higher-range models, combinin...
Page 11
2–2 instrument architecture ris repetitive signals can be acquired and stored at a random interleaved sampling (ris) rate of 10 gs/s. Ris is a high- precision digitizing technique that enables measurement of repetitive signals to the instrument's full bandwidth, with an effective sampling interval o...
Page 12
2–3 manual or remote control despite being a truly digital instrument, the scope has a front- panel layout and controls that will be familiar to users of analog oscilloscopes. Rapid instrument response and instant representation of waveforms on the high-resolution screen add to this impression. Four...
Page 13: Block Diagrams
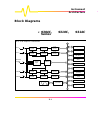
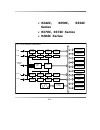
2–4 instrument architecture block diagrams Ø 9304c, 9310c, 9314c series sample & hold trigger logic external trigger ch1 ch2 ch3 ch4 timebase 8-bit flash adc 8-bit flash adc 8-bit flash adc 8-bit flash adc fast memory fast memory fast memory fast memory sample & hold sample & hold sample & hold prog...
Page 14: 9344C, 9350C, 9354C
2–5 Ø 9344c, 9350c, 9354c series Ø 9370c, 9374c series Ø 9384c series sample & hold trigger logic external trigger ch1 ch2 ch3 ch4 timebase 8-bit adc 8-bit adc 8-bit adc 8-bit adc fast memory peak detect peak detect peak detect peak detect fast memory fast memory fast memory sample & hold sample & h...
Page 15
3–1 3 installation and safety installation for safe and efficient operation the oscilloscope will operate to its specifications if the operating environment is maintained within the following parameters: Ø temperature.......................... 5 to 40 ° c (41 to 104 ° f) rated. Ø humidity .............
Page 16
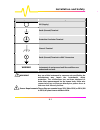
3–2 installation and safety symbol meaning off (supply) earth (ground) terminal protective conductor terminal chassis terminal earth (ground) terminal on bnc connectors warning denotes a hazard. If a warning is indicated on the instrument, do not proceed until its conditions are understood and met. ...
Page 17
3–3 no voltage selection is required, since the instrument automatically adapts to the line voltage present. Fuses the oscilloscope’s power supply is protected against short-circuit and overload by means of two “t”-rated fuses of type according to scope model: Ø 6.3 a/250 v ac 9344c, 9350c, 9354c, 9...
Page 18: Two-Channel Front Panel
4–1 4 introduction to the controls two-channel front panel.
Page 19: Four-Channel Front Panel
4–2 introduction to the controls four-channel front panel.
Page 20: The Main Controls
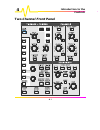
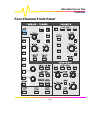
4–3 the main controls the front panel controls are divided into four main groups of buttons and knobs: the system setup and menu controls, channels, timebase + trigger and zoom + math. System setup dark-gray, menu-entry buttons, also represented in the other groups of controls, provide access to the...
Page 21
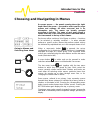
4–4 introduction to the controls choosing and navigating in menus on-screen menus — the panels running down the right- hand side of the screen — are used to select specific scope actions and settings. All other on-screen text is for information only. The menus are broadly grouped according to functi...
Page 22
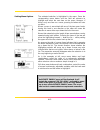
4–5 setting menu options the activated selection is highlighted in the menu. Press the corresponding menu button and the field will advance to highlight and select the next item on the menu. However, if there is only one item on a menu, pressing its button will have no effect. Where a menu is associ...
Page 23
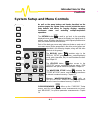
4–6 introduction to the controls system setup and menu controls as well as the menu buttons and knobs described on the previous pages, the system setup controls include the menu- entry buttons and others for copying displays, reporting instrument status and restarting multiple-acquisition operations...
Page 24
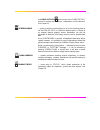
4–7 and panel setups gives access to the “panel setups” menus for saving and recalling a configuration of the instrument. See chapter 13. Screen dump — prints or plots the screen display to an on-line hardcopy device, via the gpib, rs-232-c or centronics interface ports, or directly to an external t...
Page 25: Screen Topography
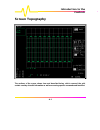
4–8 introduction to the controls screen topography the sections of the screen shown here and described below, which surround the grid, contain a variety of useful information as well as accessing specific commands and functions..
Page 26
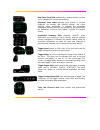
4–9 real-time clock field: powered by a battery-backed real-time clock, it displays the current date and time. Displayed trace label indicates each channel or channel displayed, the time/div and volts/div settings, and cursor readings where appropriate. It indicates the acquisition parameters set wh...
Page 27
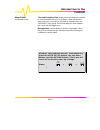
4–10 introduction to the controls other fields (not illustrated here) time and frequency field: displays time and frequency relative to cursors beneath the grid. For example, when the absolute time cursor (the cross-hair) is activated by selection from the “measure” menu group, this field displays t...
Page 28: Channel Controls
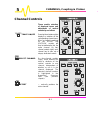
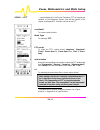
5–1 5 channels, coupling & probes channel controls these enable selection of displayed traces and adjustment of vertical sensitivity and offset. Trace on/off pressing these buttons either displays or switches off the corresponding channel trace. When a channel is switched on, the offset and volts/di...
Page 29
5–2 channels, coupling & probes find — automatically adjusts offset and volts/div to match the active channel’s input signal. Volts/div — selects the verticalsensitivity factor either in a 1–2–5 sequence or continuously (see var, below). The effect of gain changes on the acquisition offset can be ch...
Page 30: Coupling
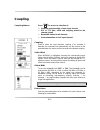
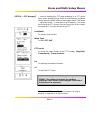
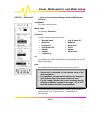
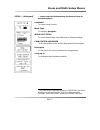
5–3 coupling coupling menus press for access to selection of: Ø coupling and grounding of each input channel Ø ecl or ttl gain, offset and coupling preset for the channel shown Ø bandwidth limiter for all channels Ø probe attenuation of each input channel. Coupling used to select the input channel’s...
Page 31: Probes and Probe Calibration
5–4 channels, coupling & probes probes and probe calibration probe calibration to calibrate the probe supplied, connect it to one of the input channels’ bnc connectors. Connect the probe’s grounding alligator clip to the cal bnc ground and touch the tip to the inner conductor of the cal bnc. The cal...
Page 32
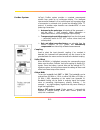
5–5 probus system lecroy’s probus system provides a complete measurement solution from probe tip to oscilloscope display. This intelligent interconnection between lecroy oscilloscopes and a growing range of accessories is achieved via a six-wire bus following philips’ i 2 c protocol. It provides maj...
Page 33: Timebase + Trigger Controls
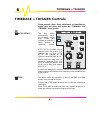
6–1 6 timebase + trigger timebase + trigger controls these controls allow direct adjustment of time/division, trigger level and delay, and access the “timebase” and “trigger” menu groups. Auto setup the blue button automatically scales the timebase, trigger level, offset, and volts/div to provide a ...
Page 34
6–2 timebase + trigger press stop after an ris acquisition has been started (next chapter) and the acquisition will be halted and a partial waveform reconstruction will be performed. Press stop when the acquisition is in roll mode (see next chapter) and the incomplete acquisition data will be shown ...
Page 35
6–3 sngl pressing this button places the scope in single-shot mode, where it waits for a single trigger to occur, then displays the signal and stops acquiring. If no signal occurs, the button can be pressed again to show the signal being observed without a trigger. Press sngl when in ris mode and th...
Page 36
6–4 timebase + trigger timebase setup — menu-entry button that calls up the “timebase” menus described in the next chapter. Trigger setup — menu-entry button that calls up “trigger setup” detailed in chapter 8..
Page 37: Timebase Sampling Modes
7–1 7 timebase modes and setup timebase sampling modes depending on the timebase, any of three sampling modes can be chosen: single-shot, random interleaved sampling (ris) or roll mode. Furthermore, for timebases suitable for either single-shot or roll mode, the acquisition memory can be subdivided ...
Page 38
7–2 timebase modes and setup when using slow timebases, sample-rate decreases and very short events such as glitches can be missed if they occur between two samples. To prevent this, a special circuitry called the peak detect system can be switched on (see “channel use” menu, page 7–5) to capture th...
Page 39
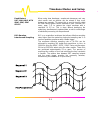
7–3 on average, 104 trigger events are needed to complete an acquisition. But sometimes many more are needed. These segments are interleaved to provide a waveform covering a time interval that is a multiple of the maximum single-shot sampling rate. However, the real-time interval over which the wave...
Page 40
7–4 timebase modes and setup segments of a sequence waveform using the full precision of the acquisition timebase. Trigger-time stamps are given for each of the segments in the “text & times status” menu. Each individual segment can be displayed by zoom, or used as input to the math functions. Seque...
Page 41: Timebase Setup
7–5 timebase setup timebase press to access and choose: Ø single-shot or interleaved (ris) sampling Ø external clock Ø channel pairing (combining) and peak detect .. Ø sequence mode Ø number of segments in sequence mode Ø maximum record length. The “timebase” menus also show the number of points acq...
Page 42
7–6 timebase modes and setup for selecting the maximum number of samples to be acquired, using the associated menu knob. See appendix a for model maximums..
Page 43
7–7 timebase external — appears when an external clock mode is chosen. Sampling this menu is inactive when the external sample clock is being used. Only single-shot acquisition is available (see below). Sample clock for selecting a description of the signal applied to the ext bnc connector for the s...
Page 44
7–8 timebase modes and setup notes for using external clock Ø the time/div is expressed in s/div, to be understood to be samples/div. Ø the trigger delay is also expressed in samples and can be adjusted as normal. Ø no attempt is made to measure the time difference between the trigger and the extern...
Page 45
7–9 timebase — sequence — for operating in sequence mode sampling this menu is inactive when the external sample clock is being used. Only single-shot acquisition is available (see pages 7–7, 7–1). Sample clock for selecting a description of the signal applied to the ext bnc connector for the sample...
Page 46
7–10 timebase modes and setup if the trigger mode is auto and if the time between two consecutive triggers exceeds a time-out that can be selected, the acquisition is restarted from segment 1. The time-out is selected in “special modes” “utilities”. However, when “wrap” is selected, the segments are...
Page 47: Choosing The Right Trigger
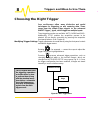
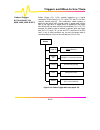
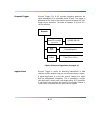
8–1 8 triggers and when to use them choosing the right trigger your oscilloscope offers many distinctive and useful techniques for triggering on and capturing data. These range from the simple edge triggers to the advanced smart trigger types, which trigger on multiple inputs. Three triggering mod...
Page 48: Edge Or Smart
8–2 triggers and when to use them edge or smart a variety of triggers for different applications can be chosen from the two main trigger groups, the edge and smart trigger types. Edge triggers in the edge group of menus trigger conditions are defined by the vertical trigger level, coupling, and slop...
Page 49: Edge Trigger
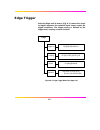
8–3 edge trigger selecting edge and its menus (fig. 8–2) causes the scope to trigger whenever the selected signal source meets the trigger conditions. The trigger source is defined by the trigger level, coupling, slope or hold-off. Figure 8–2. Edge trigger menu (see page 8–9). Edge trigger on coupli...
Page 50
8–4 triggers and when to use them trigger source the trigger source may be: Ø the acquisition channel signal (ch 1, ch 2 or ch 3, ch 4 on four-channel models) conditioned for the overall voltage gain, coupling, and bandwidth. Ø the line voltage that powers the oscilloscope (line). This can be used t...
Page 51
8–5 Ø dc: all the signal's frequency components are coupled to the trigger circuit. This is used in the case of high-frequency bursts, or where the use of ac coupling would shift the effective trigger level. Ø ac: here the signal is capacitively coupled. Dc levels are rejected and frequencies below ...
Page 52
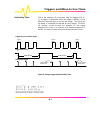
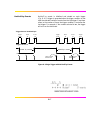
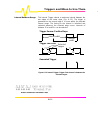
8–6 triggers and when to use them hold-off by time this is the selection ofa minimum time for triggers (fig. 8– 3). A trigger is generated when the trigger condition is met after the selected delay from the last trigger. The timing for the delay is initialized and started on each trigger. The hold- ...
Page 53
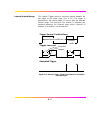
8–7 hold-off by events hold-off by events is initialized and started on each trigger (fig. 8–4). A trigger is generated when the trigger condition is met after the selected number of events from the last trigger. Event here refers to the number of times the trigger condition is met after the last tr...
Page 54
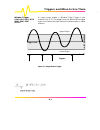
8–8 triggers and when to use them on some scope models a “window” edge trigger is also available (fig. 8–5). Two trigger levels are defined and a trigger event occurs when the signal leaves the window region in either direction. Figure 8–5. Edge window trigger. Window trigger available only with 930...
Page 55: Trigger Setup: Edge
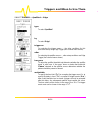
8–9 trigger setup: edge press to access menu selection of: Ø trigger source Ø coupling for each source Ø slope (positive or negative), and Ø hold-off by time or events. Edge/smart to select “edge” trigger on for selecting the edge trigger source (four-channel menu shown). Coupling to select the trig...
Page 56: Smart Trigger
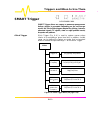
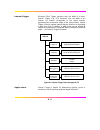
8–10 triggers and when to use them smart trigger smart trigger allows the setting of additional qualifications before a trigger is generated. Depending on the oscilloscope model, this can include triggers adapted for glitches, intervals, abnormal signals, tv signals, state- or edge-qualified events,...
Page 57
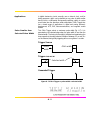
8–11 applications in digital electronics circuits normally use an internal clock, and for testing purposes a glitch can be defined as any pulse of width smaller than the clock- or half-period. But generally speaking a glitch is a pulse much faster than the waveform under observation. Glitch trigger ...
Page 58
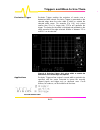
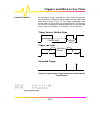
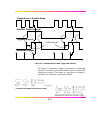
8–12 triggers and when to use them exclusion trigger exclusion trigger enables the exclusion of events over a determined time interval. Exclusion trigger is generated on the selected edge when the pulse width is within or outside the selected width range. For example (fig. 8–8), only pulses smaller ...
Page 59
8–13 interval trigger whereas glitch trigger performs over the width of a pulse, interval trigger (fig. 8–9) performs over the width of an interval. An interval corresponds to the signal duration separating two consecutive edges of the same polarity. Interval trigger is used to capture intervals tha...
Page 60
8–14 triggers and when to use them interval smaller for this interval trigger, generated on a time interval smaller than the one selected, a maximum interval between the two edges of the same slope is chosen (fig. 8–10). The trigger is generated on the second edge if it occurs within the selected in...
Page 61
8–15 interval larger for this interval trigger, generated on an interval larger than the one selected, a minimum interval between the two edges of the same slope is chosen (fig. 8–11). The trigger is generated on the second edge if it occurs after the selected interval. The timing for the interval i...
Page 62
8–16 triggers and when to use them interval between range this interval trigger selects a maximum interval between the two edges of the same slope (fig. 8–12). The trigger is generated on the second edge if it occurs within the selected interval range. The timing for the interval is initialized and ...
Page 63
8–17 interval outside range this interval trigger selects a minimum interval between the two edges of the same slope (fig. 8–13). The trigger is generated on the second edge if it occurs after the selected interval range. The timing for the interval is initialized and restarted whenever the selected...
Page 64
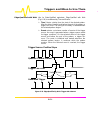
8–18 triggers and when to use them pattern trigger pattern trigger (fig. 8–14) enables triggering on a logical combination of the inputs ch 1, ch 2 (plus ch 3 and ch 4 on four- channels models) and ext. This combination, called a pattern, is defined as the logical and of trigger states. A trigger st...
Page 65
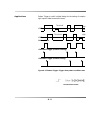
8–19 applications pattern trigger is useful in digital design for the testing of complex logic inputs or data transmission buses. Figure 8–15. Pattern trigger: trigger when pattern conditions met. Ch 1 generated trigger (pattern entering) pattern 1h*2l threshold ch 2 generated trigger (pattern exiti...
Page 66
8–20 triggers and when to use them more about pattern trigger once the pattern is defined, one of two transitions can be used to generate the trigger. When the pattern begins, called entering the pattern, a trigger can be generated. Alternatively, a trigger can be generated when the pattern ends, ex...
Page 67
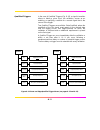
8–21 qualified triggers in the case of qualified triggers (fig. 8–16), a signal’s transition above or below a given level, the validation, serves as an enabling, or qualifying, condition for a second signal that is the source of the trigger. Two qualified triggers are available: state-qualified, whe...
Page 68
8–22 triggers and when to use them qualified triggers offer the choice of generating a trigger either when the selected pattern is present or absent. As with pattern trigger, the pattern is defined as a logical and combination of trigger states that are either high or low: high when a trigger source...
Page 69
8–23 figure 8–17. State-qualified by wait: trigger after timeout. As figure 8–17 illustrates, a trigger is generated on a rising edge whenever the pattern is asserted (pattern present) and the wait timeout has expired. The timeout is, respectively, activated or disabled once the pattern is asserted ...
Page 70
8–24 triggers and when to use them edge-qualified with wait likeitsstate-qualified equivalent, edge-qualified with wait (fig. 8–18) is conditioned by time and events: Ø time selects a delay from the start of the desired pattern. After the delay (timeout) and before the end of the pattern, a trigger ...
Page 71
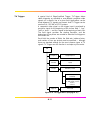
8–25 tv trigger a special kind of edge-qualified trigger, tv trigger allows stable triggering on standard or user-defined composite video signals, on a specific line of a given field. Applications can be found wherever tv signals are present. And tv trigger can be used on pal, secam or ntsc systems....
Page 72
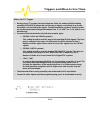
8–26 triggers and when to use them notes for tv trigger Ø because most tv systems have more than two fields, the enhanced field-counting capability (fieldlock) allows the oscilloscope to trigger consistently on a chosen line within a chosen field of the signal. The field-numbering system is relative...
Page 73
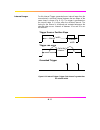
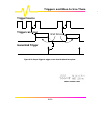
8–27 dropout trigger dropout trigger (fig. 8–20) provides triggering whenever the signal disappears for a selectable period of time. The trigger is generated at the end of the time-out period following the “last” trigger source transition. Time-outs of between 25 ns and 20 s can be selected. Figure ...
Page 74: Generated Trigger
8–28 triggers and when to use them figure 8–21. Dropout trigger: a trigger occurs when the timeout has expired. Generated trigger wait timeout trigger source trigger can occur.
Page 75: Trigger Setup: Smart
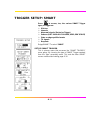
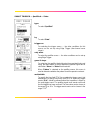
8–29 trigger setup: smart press to access, too, the various smart trigger types, to trigger on: Ø glitches Ø intervals Ø abnormal signals (exclusion trigger) Ø patterns (not available on 9304c, 9310c, 9314c series) Ø state- or edge-qualified events Ø tv signals Ø dropouts. Edge/smart to select “smar...
Page 76
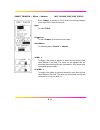
8–30 triggers and when to use them smart trigger — glitch type to select “glitch”. Trigger on for selecting the trigger source (four-channel menu shown). Coupling to select the trigger coupling. At end of to define the test on either “pos”-itive or “neg”-ative pulses. Width ≤ when “on” instructs the...
Page 77
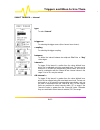
8–31 smart trigger — glitch — pattern (not on 9304c, 9310c, 9314c series) when “pattern” is selected in glitch mode, the instrument triggers on the logic and of up to five sources. Type to select “glitch”. Trigger on to select “pattern” (four-channel menu shown). For pattern for selecting pattern “p...
Page 78
8–32 triggers and when to use them smart trigger — interval type to select “interval”. Trigger on for selecting the trigger source (four-channel menu shown). Coupling for selecting the trigger coupling. Between to define the interval between two adjacent “pos”-itive or “neg” -ative edges. Interval ≤...
Page 79
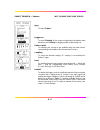
8–33 smart trigger — pattern (not on 9304c, 9310c, 9314c series) type to select “pattern”. Trigger on to select “entering” for the scope to trigger when the pattern starts being true, and “exiting” for triggering when it stops being true. Pattern with for selecting the channel to be modified using t...
Page 80
8–34 triggers and when to use them smart trigger — tv type to select “tv” . Tv signal on for selecting the trigger source (four-channel menu shown). # of fields to define the number of fields — up to eight. Tv type for selecting either “standard” or “custom” tv decoding. As when “standard” is chosen...
Page 81
8–35 smart trigger — qualified — state type to select “qualified”. By to select “state”. Trigger on for selecting the trigger source — the other conditions for this source can be set up using edge trigger (four-channel menu shown). Only after to select the qualifier source — the other conditions can...
Page 82
8–36 triggers and when to use them smart trigger — qualified — edge type to select “qualified”. By to select “edge”. Trigger on for selecting the trigger source — the other conditions for this source are set up using edge trigger (four-channel menu shown). After for selecting the qualifier source — ...
Page 83
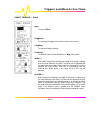
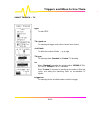
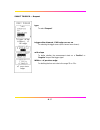
8–37 smart trigger — dropout type to select “dropout”. Trigger after timeout, if no edge occurs on for selecting the trigger source (four-channel menu shown). With slope to define whether the measurement starts on a “positive” or “negative” slope of the trigger signal. Within… of previous edge for d...
Page 84: Zoom + Math Controls
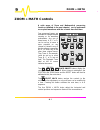
9–1 9 zoom + math zoom + math controls a wide range of zoom and mathematical processing functions (detailed in the next chapter) can be performed on acquired waveforms with the controls described here. Four processed traces are available for straight-forward zooming or for waveform mathematics. Any ...
Page 85
9–2 zoom + math the position knob repositions zoomed traces horizontally. If the source of the expanded waveform is displayed, an intensified region corresponding to the area of expansion is shown. Whereas the vertically repositions the active trace. The zoom knob horizontally expands or contracts t...
Page 86: Zooming For Precise Waveform
10–1 zoom, mathematics and math setup 10 zooming for precise waveform measurements several traces can be zoomed from a single waveform to obtain precise timing measurements. For instance, on a waveform composed of two pulses separated by a long delay, trace a could be made a zoom of the first pulse,...
Page 87
10–2 zoom, mathematics and math setup mathematical function, simply cancel any expansion or position change by pressing reset..
Page 88: Math Functions and Options
10–3 math functions and options a wide range of standard or optional mathematical and waveform processing functions are available. The scope’s standard waveform mathematics functions consist of waveform negation, identity, addition, subtraction, multiplication and division, summed averaging of up to...
Page 89
10–4 zoom, mathematics and math setup the weight of ‘old’ waveforms in the continuous average gradually tends to zero (following an exponential rule) at a rate that decreases as the weight increases. Summed averaging summed averaging is the repeated addition, with equal weight, of successive source ...
Page 90
10–5 whenever the selected maximum number of sweeps is reached, the accumulation stops. The same process may be interrupted by changing the trigger mode from normal to stopped or by turning off the function trace. Accumulation will continue when these actions are reversed. The currently accumulated ...
Page 91: Using Waveform Mathematics
10–6 zoom, mathematics and math setup using waveform mathematics waveform mathematics can be applied to any channel or reference memory. And any trace of a, b, c or d can be set up as a math function, allowing several computations to be made in sequence. For example: trace a could be set up as the d...
Page 93
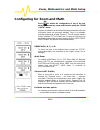
10–8 zoom, mathematics and math setup configuring for zoom and math press to enable the configuration of any of the four traces and execute any zoom, math function using the “zoom + math” menus. Any trace and function can be chained to another trace and function (not all functions shown are necessar...
Page 94
10–9 zoom and math setup menus zoom use math? For toggling between “no” (zoom only) and “yes” (math functions) setup. Trace a, b, c or d is zoom of to select the source trace to be zoomed (four-channel menu shown)..
Page 95
10–10 zoom, mathematics and math setup arithmetic — allows addition, subtraction, multiplication and division, as well as choice of the two operands and the operator. The example on this page shows a setup of trace a as the sum of channels 1 and 2. Use math? To choose a math function. Math type to s...
Page 96
10–11 zoom and math setup menus average — offers summed (linear) or continuous (exponential) averaging. Shown here is an example setup of trace a as a summed average (over 1000 sweeps) of channel 1. See also page 10–3. Use math? To choose a math function. Math type to select, in this case, “average”...
Page 97
10–12 zoom, mathematics and math setup enhanced resolution * — allows the selection of low-pass digital filters that increase the resolution of the displayed signal at the expense of its bandwidth. Appendix b gives a detailed explanation. These digital filters work very much like analog bandwidth-li...
Page 98
10–13 zoom and math setup menus setup extrema † — used for acquiring a trace envelope over many acquisitions (see also page 10–4). Use math? To choose a math function. Math type to select “extrema”. Limits to select either “envelope”, “floor” or “roof”. Floor shows only the lower, and roof only the ...
Page 99
10–14 zoom, mathematics and math setup setup — fft ‡ — used to display the fast fourier transform (fft) of a signal and visualize it in the frequency domain. See the final section of this chapter, and appendix c, for when and how to use fft. Use math? To choose a math function. Math type for selecti...
Page 100
10–15 zoom and math setup menus setup — fft average § — used for displaying the fft power averaging of an fft source trace, power averaging being useful for characterizing broadband noise or periodic signals without a stable trigger signal. Total power — signal and noise — is measured at each freque...
Page 101
10–16 zoom, mathematics and math setup setup — functions ** — gives access to a menu offering a variety of math display functions. Use math? To choose a math function. Math type for selecting “functions”. Function to select a function type from this list: Ø “absolute value” Ø “derivative” Ø “exp (ba...
Page 102
10–17 zoom and math setup menus setup — histogram †† — used to select the histogramming function and set-up for parameter analysis. Use math? To choose a math function. Math type for selecting “histogram”. More hist setup to access the secondary menu offering more histogram settings. Find center and...
Page 103
10–18 zoom, mathematics and math setup setup — rescale — for selecting a waveform and adjusting a, the multiplication factor, and b, the additive constant, in: (a ∗ waveform) + b, where both constants can have values ranging between − 10 15 and + 10 15 . Use math? To choose a math function. Math typ...
Page 104
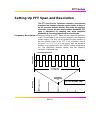
10–19 fft setup setting up fft span and resolution the fft (fast fourier transform) converts a time domain waveform into frequency domain spectra similar to those of an rf spectrum analyzer display. But unlike the analyzer, which has controls for span and resolution bandwidth, fft span is determined...
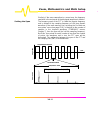
Page 105
10–20 zoom, mathematics and math setup similarly, if the source waveform is a zoom trace, the frequency resolution is the reciprocal of the displayed waveform’s duration. Setting the span the frequency span of the fft is called the nyquist frequency and is related to the sampling frequency of the ti...
Page 106
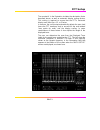
10–21 fft setup the constant k in the illustration includes the decimation factor described above, as well as automatic display scaling factors. This scaling is required to ensure that the fft’s horizontal display scale falls into a 1,2, or 5 factor. In essence, the oscilloscope automatically adjust...
Page 107
10–22 zoom, mathematics and math setup essentially… to achieve a desired fft span, first make sure that the sampling rate is more than twice the span desired. Control the sampling rate using the time/div knob and set the acquisition memory length with the “timebase” menu. The sampling rate can be fu...
Page 108
10–23 fft setup this example, illustrated below, shows how the oscilloscope maintains the display factor. A sampling rate of 25 ms/s would result in a full scale range of 12.5 mhz or 1.25 mhz/div. To maintain a display scale factor of 1,2, or 5 it decimates the acquired waveform by 25 000:1 and calc...
Page 109: Setting Up The Display
11–1 11 display setting up the display display setup press to view the display setup menus (see page 11–6) and select from: Ø standard or xy mode Ø single, dual or quad grids Ø persistence Ø dot join Ø display and grid intensities Ø “more display setup” menus. Standard or xy display? Standard displa...
Page 110
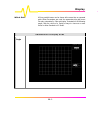
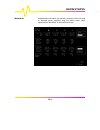
11–2 display which grid? All four possible traces can be shown at the same time on separate grids. When parameters are used, the parameter-style grid comes into play automatically. Other grid styles, illustrated on the following pages, offer the choice of a variety of ways to view one or more traces...
Page 111
11–3 dual quad.
Page 112
11–4 display parameter s xy only.
Page 113
11–5 xy single xy dual.
Page 114
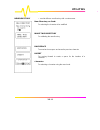
11–6 display display setup — standard with “standard” selected, these menus appear: persistence for activating persistence (see next menu). Dot join to select dot join “on” — connecting the sample points with a line segment — or “off”, when only the sample points are displayed. Grids for selecting t...
Page 115
11–7 display setup — standard — persistence “on” with both “standard” and “persistence” “on” selected, these menus appear: persistence activates persistence. When “on”, this can be cleared and reset by pressing the clear sweeps button or by changing any acquisition condition or waveform processing c...
Page 116
11–8 display persistence these menus appear when “persistence setup” is selected from “display setup”. Persistence to select whether persistence is applied to all or to the top two traces. Persist for for selecting the persistence duration, in seconds. The number of sweeps accumulated — up to 1 mill...
Page 117
11–9 display setup — xy when “xy” is selected from the first menu, these other menus appear. Persistence ativates persistence. When “on”, the other menus here do not change. Dot join to select dot join “on” — connecting the sample points with a line segment — or “off”, when only the sample points ar...
Page 118
12–1 12 utilities printing, storing, using special modes utilities press to access the primary menus for: Ø hardcopy settings Ø time and date settings for the real-time clock Ø gpib and rs-232-c settings Ø mass storage utilities (including copy and format and delete files) Ø special modes of operati...
Page 119: Hardcopy Setup
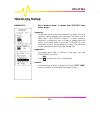
12–2 utilities hardcopy setup hardcopy when “hardcopy setup” is selected from “utilities” these menus appear: output to to select the dev ice to which the instrument is to output. This menu shows the options installed in the instrument. The dev ice can be either a port — gpib, rs232 or centronics — ...
Page 120
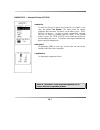
12–3 hardcopy — internal printer (option) output to to select the dev ice to which the instrument is to output: in this case, the optional “int. Printer”. This menu shows the options installed in the instrument. The dev ice can be either a port — gpib, rs232 or centronics — to which a printer is con...
Page 121: Time/date Setup
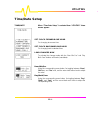
12–4 utilities time/date setup time/date when “time date setup” is selected from “utilities” these menus appear: set clock forward one hour for changing to summer time. Set clock backward one hour for changing back to standard time. Load changes now to activ ate the changes made with the “hour min s...
Page 122: Gpib/rs232 Setup
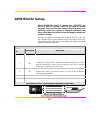
12–5 gpib/rs232 setup when “gpib/rs232 setup” is selected from “utilities” the rs-232-c port on the rear panel can be used for remote operation of the oscilloscope, and for direct interfacing to a hard-copy device for copying of displayed waveforms and other screen data. See below and on next page f...
Page 123
12–6 utilities gpib & rs232 when “gpib/rs232 setup” is selected from “utilities” these menus appear: remote control from for selecting the port for remote control. Rs232 mode to select “7–bit” or “8–bit” mode for rs-232 communication. When “rs-232” is selected, the gpib interface is in “talk only” m...
Page 124: Mass Storage Utilities
12–7 mass storage utilities when “mass storage utilities” is selected from “utilities” the “mass storage” menu group appears (12–11) to give access to the mass-storage file system controls. The system supports storage and retrieval of data files to and from memory cards, floppy disks and removable h...
Page 125
12–8 utilities file-naming conventions as in ms-dos, the file name can take up to eight characters followed by an extension of three characters. A file is treated as: Ø panel setup if its extension is pnl Ø wav eform if its extension is a three-digit number Ø wav eform template if its extension is t...
Page 126
12–9 auto-store waveform file naming the default notation for wav eform files is stt.Nnn for manually stored files and att.Nnn for automatically stored files, the characters s and a representing the two storage methods, respectiv ely. When automatically generating a file name, the system uses the as...
Page 127
12–10 utilities protected” will be displayed on the upper part of the grid whenev er the medium is accessed for writing..
Page 128
12–11 sram card battery the sram memory card contains a button-size battery for preserv ing data. When this needs replacing, the message “bad battery” appears. The battery can and should be changed while the memory card is still in the oscilloscope, in order to prev ent loss of information. To acces...
Page 129
12–12 utilities flpy util these menus appear when “floppy disk utilities” is selected from “mass storage” and Ø a floppy has been newly inserted, or Ø there is no floppy in the driv e. (re–)read drive to read the floppy and display directory contents..
Page 130
12–13 flpy util once the floppy has been read, these menus appear, displaying information on the installed storage media: Ø last “format” date and time Ø media size and av ailable free space Ø date, time and size information of the selected file on the media. Template and formatting to access a seco...
Page 131
12–14 utilities format flpy these menus appear when “template and formatting” is selected from “floppy util”. Perform flpy format to format the floppy, in dos format with an interleav e factor of two, which optimizes throughput to and from the scope. Density this menu appears only in “format floppy”...
Page 132
12–15 format hdd these menus appear when “mass storage” “hard disk utilities” “template and formatting” is selected. Quick format to quickly (15 seconds) clear the portable hard disk driv e. Full format for a complete formatting of the hdd — recommended if the disk is non-readable. Copy template to ...
Page 133
12–16 utilities preferences these menus appear when “mass storage” “mass storage preferences” is selected and are for: Ø selecting the working directory Ø deleting a directory Ø accessing the “file name preferences” menu Ø accessing the “add new directory” menu. On drive for selecting the medium. Fi...
Page 134
12–17 filename pref this menu group appears when “file name preferences” is selected from the preceding menu — for defining custom names for wav eform, setup, or hardcopy files. To be set to: to select the character for modification. Restore default name for restoring the file type selected in the “...
Page 135
12–18 utilities new directory — used to define a new directory with a custom name. New directory on card: for selecting the character to be modified. Make this directory for v alidating the new directory. Backspace to move back one space and erase the prev ious character. Insert for mov ing forward ...
Page 136
12–19 copy files these menus appear when “mass storage” “file transfers” is selected, and copies files from one medium to another. Direction (depending on options installed) to select source (copy from) and destination (copy to). Which files for selecting the type of file for copying. Do copy to exe...
Page 137: Special Modes
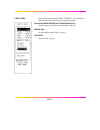
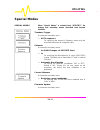
12–20 utilities special modes special modes when “special modes” is selected from “utilities”, the primary and secondary menus described here become available. Timebase trigger accesses the secondary menu: Ø auto sequence for specifying the time-out in sequence mode using the associated menu knob to...
Page 138
12–21 Ø flash update offering the “update from” and “update program” menus (illustrated next page)..
Page 139
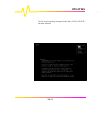
12–22 utilities the full screen warning message shown when “flash update” has been selected..
Page 140: Cal Bnc Setup
12–23 cal bnc setup cal bnc out when “cal bnc setup” is selected from “utilities”, selection can be made of the type of signal put out at the cal bnc connector. The frequency, amplitude and pulse shape of the calibration signal can also be chosen. In addition, the cal bnc connector can be used to pr...
Page 141: Waveform Store
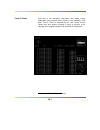
13–1 13 waveform store & recall waveform store store w’forms press waveform to store waveforms to internal memory (m1, m2, m3, or m4) in lecroy’s binary format. And to store waveforms in either binary or ascii format to floppy disk, or memory card or removable hard disk (hdd) with those options inst...
Page 142
13–2 waveform store & recall.
Page 143
13–3 data format for choosing the data format, as described on the previous page. When “ascii” has been selected, the primary “setup ascii format” menu will appear immediately beneath this menu, giving access to the secondary “ascii setup” menu (see next page). When “binary” setup ascii format appea...
Page 144
13–4 waveform store & recall ascii setup data format this secondary menu, accessed through “setup ascii format” offers a choice of ascii formats. (for details on each format, see appendix e)..
Page 145: Waveform Recall
13–5 waveform recall recall w’form press waveform to recall a waveform from internal memory, floppy, or the optional memory card or removable hard disk (hdd). From to select the storage medium from which to recall — in this case, internal “memories”. Do recall to execute recall based on the selectio...
Page 146
13–6 waveform store & recall recall w’form (floppy disk or optional storage device) from select the device or medium on which the file is stored — “hdd”, “card”, or “flpy”. Do recall to execute recall based on the selections made in the “file” and “to” menus (see below). File to select the file on w...
Page 147: Values
14–1 14 cursors/measure & parameters cursors: tools for measuring signal values cursors are basic, important tools for measuring signal values. In standard display mode, amplitude, or voltage, cursors — broken lines or bars running across the screen — are moved up and down the grid pixel by pixel. T...
Page 148
14–2 cursors/measure & parameters cursors in xy display in xy display, absolute-amplitude cursors are horizontal and vertical bars that can be moved both up and down and from side– to–side across the screen. Relative-amplitude cursors are pairs of bars that move in the same way. Absolute- and relati...
Page 149
14–3 measure — cursors press — to access the “measure” setup menus. Off/cursors/parameters to select “cursors”. Mode for selecting “time” (time or frequency cursors) or “amplitude” (voltage or amplitude cursors). Type to toggle between “relative” and “absolute”. The first displays two cursors, refer...
Page 150
14–4 cursors/measure & parameters parameters: automatic measurements the instrument can determine certain signal properties automatically, using signal parameters. The scope’s standard parameters are listed and described in appendix d of this manual. * for common measurements on a lone signal, param...
Page 151
14–5 information the parameter has been determined for several periods (up to 100), and the average of those values has been taken. The parameter has been determined over an integral number of periods. The parameter has been calculated on a histogram. Insufficient data to determine the parameter. Wa...
Page 152
14–6 cursors/measure & parameters measure — parameters — standard voltage this mode measures, for a single trace: Ø peak–to–peak (amplitude between maximum and minimum sample values) Ø mean of all sample values (corrected for periodic signals) Ø standard deviation Ø root mean square of all sample va...
Page 153
14–7 measure — parameters — standard time this mode measures for a single trace: Ø period Ø width (at 50% amplitude) Ø rise time (10–90% of amplitude) Ø fall time (90–10% of amplitude) Ø delay (from trigger to first 50% amplitude point). Off/cursors/parameters to select “parameters”. Mode for select...
Page 154
14–8 cursors/measure & parameters measure — parameters — custom in this mode, up to five parameters can be displayed for various traces. Off/cursors/parameters for selecting “parameters”. Mode to select “custom” parameters. Statistics for turning “on” display of the parameter’s average, lowest, high...
Page 155
14–9 change param — for modifying parameters. On line to select for modification up to five different parameters, “1”, “2”, “3”, “4”, or “5”. Category to specify the category of parameter. When “all” is selected, the “measure” menu (see below) will feature all parameters. However, when a particular ...
Page 156
14–10 cursors/measure & parameters change param parameters can be customized to meet specific needs: on line to select for modification up to five different parameters, “1”, “2”, “3”, “4”, or “5”. Category to specify the category or type of parameter. More ∆t@lv setup calls up the” ∆t@lv”customizati...
Page 157
14–11 setup “ ∆t@lv” — for customizing the ∆ t@lv parameter. Levels are for selecting whether the levels should be set in absolute or percentage of the peak–to–peak signal value. Hysteresis to set the hysteresis division. Hysteresis essentially enables the user to set a voltage band, which a wavefor...
Page 158
14–12 cursors/measure & parameters setup “ ∆c2d+” — for customizing the ∆ c2d+ parameter. Hysteresis to set the hysteresis division. Hysteresis essentially enables the user to set a voltage band, which a waveform peak–trough pair must exceed in order not be considered either noise or a “bump”. This ...
Page 159: Pass/fail Testing
14–13 pass/fail testing parameters can also be used in carrying out pass/fail tests. These tests require a combination of measurements within chosen limits, using an action provoked when the test either passes or fails, depending on which has been specified. Signals can also be pass/fail tested agai...
Page 160
14–14 cursors/measure & parameters measure — parameters — pass/fail off/cursors/parameters to select “parameters”. Mode to select “pass” or “fail”. Testing for turning testing “off” or “on”. Testing is turned off in order to observe only the parameter variations. Change test conditions to access the...
Page 161
14–15 change test on line to select for modification up to five different parameters, “1, 2, 3, 4 or 5” test on to select “param” or, if no test is required, “--- (no test)”. Choose to select “param”. Delete all tests for deleting all tests previously selected. Measure for selecting the new paramete...
Page 162
14–16 cursors/measure & parameters change test — param (changing limits for pass/fail tests on parameters) on line to select for modification up to five different parameters, “1, 2, 3, 4 or 5”. Test on to select “param” or “--- (no test)” if no test required on the selected line (“mask” selection, p...
Page 163
14–17 change test — mask (changing pass/fail test on a mask) on line to select for modification up to five different parameters, “1, 2, 3, 4 or 5” (“action” selection, page 14–20). Test on for setting to “mask” or “--- (no test)” if no test required on the selected line (“param” 14–15). Modify mask ...
Page 164
14–18 cursors/measure & parameters modify mask — w’form (generating a mask from a waveform) from to select “w'form”. Into for selecting “d=m4” if the mask is to be automatically displayed on the screen otherwise select “m1”, “m2”, “m3”, or “m4”. Using “recall w’form” (see previous chapter) memories ...
Page 165
14–19 modify mask (floppy disk or optional storage device) from to select the device. Into for selecting “d=m4” to automatically display the mask on- screen, or “m1”, “m2”, “m3” or “m4”. Invert mask for generating an inverted mask. Do recall to recall the mask. File to select the appropriate mask, u...
Page 166
14–20 cursors/measure & parameters change test — action (setting pass/fail actions) depending on the test result certain actions can be taken. On line for selecting “action”. Delete all actions to delete all previously selected actions. If to determine if the action will be taken on “pass” or “fail”...
Page 167
15–1 15 panel setups saving and recalling panel setups panel setups press to access the menus used for saving or recalling configurations — panel setups — to non-volatile memory or floppy disk, or to memory card or portable hard disk (hdd) depending on options installed. Recall save to choose to sav...
Page 168
15–2 panel setups recall or save to select for saving or recalling a panel setup. When “save” is selected, as shown on the previous page, the “to setup” menus appear. While when “recall” is chosen, as shown here, the “from setup” menus appear. From setup 1 ...2 ...3 or...4 for recalling any of four ...
Page 169
15–3 recall setups from for selecting to recall a setup from floppy, or card or portable hard disk, depending on the options installed and the medium on which the desired setup is stored. Do recall to perform the recall of the setup selected in the “file” menu (see below). File for selecting the sto...
Page 170
16–1 16 show status the complete picture, summarized press to summon the “status” menu and access full-screen summaries of the oscilloscope’s system and other functional status. Acquisition status vertical sensitivity, probe attenuation, offset and coupling for each channel, as well as timebase and ...
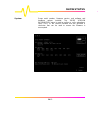
Page 171
16–2 show status system scope serial number, firmware version, and software and hardware options installed. The “more version information” menu is used to perform a cyclic redundancy check (crc) of the internal firmware and will generate a checksum that can be used to ensure the firmware is uncorrup...
Page 172
16–3 text & times user text in the waveform descriptor* and trigger timing information (four-channel menu shown in this example). And when “text & times” is selected the “for” and “select” menus shown here also appear, allowing a trace or memory to be selected and a segment range to be specified for...
Page 173
16–4 show status waveform detailed status information on channels, memories, zoom and math or displayed traces, specified using the bottom menu, which appears when “waveform” is selected from the top..
Page 174
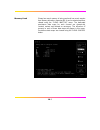
16–5 memory used shows how much memory is being used and how much remains free. Memory allocation: memories m1–4 can be selected and then cleared using the “clear inactive” menu. The dedicated persistence data maps for each channel are dynamically created, resized and deleted as necessary. The alloc...
Page 175: Signal Capture
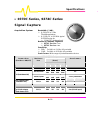
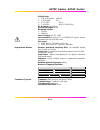
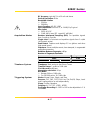
A–1 appendix a: specifications a Ø 9304c series, 9310c series, 9314c series signal capture acquisition system bandwidth ( -3 db): Ø 9304c series Ø @ 50 Ω : dc to 200 mhz Ø @ 1 m Ω : dc to 160 mhz typical at probe tip Ø 9310c/9314c series ): Ø @ 50 Ω : dc to 400 mhz Ø @ 1 m Ω : dc to 230 mhz typical ...
Page 176
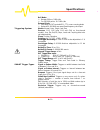
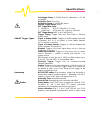
A–2 specifications input impedance: 1 m Ω //15 pf (system capacitance using pp002) or 50 Ω ±1 % max. Input: Ø 50 Ω : ±5 v dc (500 mw) or 5 v rms Ø 1 m Ω : 250 v max (dc + peak ac ≤ 10 khz) acquisition modes random interleaved sampling (ris): for repetitive signals from 1 ns/div to 10 µs/div single s...
Page 177
A–3 9304c series, 9310c series, 9314c series post-trigger delay: 0–10 000 divisions adjustable in 0.1 div increments holdoff by time: 10 ns–20 s holdoff by events: 0–99 999 999 events internal trigger range: ±5 div ext trigger max input: Ø 50 Ω ±1 %: ±5 v dc (500 mw) or 5 v rms Ø 1 m Ω /15 pf: 250 v...
Page 178: Signal Viewing
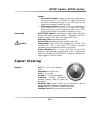
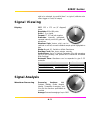
A–4 specifications signal viewing display crt: 12.5 x 17.5 cm (9” diagonal) raster resolution: 810 x 696 points grids: 1, 2, or 4 grids. Formats: yt, xy and both together graticules: internally generated; separate intensity control for grids and waveforms waveform style: vectors, which can be switch...
Page 179
A–5 9304c series, 9310c series, 9314c series extrema: roof, floor or envelope values of from 1 to 10 6 waveforms with optional wp01 advanced waveform math package.
Page 180
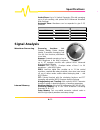
A–6 specifications eres: low-pass digital filter provides up to 11 bits vertical resolution; sampled data always available, even when trace turned off; any of above modes usable without destroying data — with wp01 option fft: spectral analysis with five windowing functions and fft averaging, with op...
Page 181
A–7 9304c series, 9310c series, 9314c series quietjet, laserjet, paintjet, and epson printers; hp 7400 and 7500 series, or hpgl compatible plotters Ø optional internal, high-resolution graphics printer output formats: binary, or ascii waveform output compatible with spreadsheets, matlab , mathcad ge...
Page 183: Signal Capture
A–9 9344c series, 9350c series, 9354c series Ø 9344c series, 9350c series, 9354c series signal capture acquisition system bandwidth ( -3 db): Ø 9344c series Ø @ 50 Ω : dc to 500 mhz Ø 100 mv/div: 400 mhz Ø 50 mv/div and below: 350 mhz Ø @ 1 m Ω : dc to 500 mhz typical at tip of optional fet probe ap...
Page 184
A–10 specifications 9350c/9354c series m emory per c hannel ( in p oints ) per m odel c hannels u sed (p eak d etect on/off) m ax s ample r ate c cm cl a ctive c hannels all (peak detect off) 500 ms/s 50k 250k 2m all 100 ms/s data 25k data 100k data 1m data all all (peak detect on) 400 ms/s peak 25k...
Page 185
A–11 9344c series, 9350c series, 9354c series input impedance: 50 Ω ±1 % or 1 m Ω //15 pf (system capacitance using pp002) max. Input: Ø 50 Ω : ±5 v dc (500 mw) or 5 v rms Ø 1 m Ω : 250 v max (dc + peak ac ≤ 10 khz) acquisition modes random interleaved sampling (ris): for repetitive signals from 1 n...
Page 186
A–12 specifications triggering system modes: normal, auto, single, and stop sources: ch1, ch2 (plus ch3 and ch4 on four-channel models), line, ext, ext/10; slope, level and coupling able to be set independently slope: positive, negative coupling: ac, dc, hf (up to 500 mhz), lfrej, hfrej pre-trigger ...
Page 187
A–13 9344c series, 9350c series, 9354c series where each source can be defined as high, low or don’t know and the trigger as the pattern’s beginning or end.
Page 188: Signal Viewing
A–14 specifications autosetup autosetup button: sets timebase, trigger and sensitivity to display wide range of repetitive signals — amplitude 2 mv to 40 v; frequency above 50 hz; duty cycle greater than 0.1% autosetup time: around two seconds vertical find: automatically sets sensitivity and offset...
Page 189
A–15 9344c series, 9350c series, 9354c series 9354ctm 50 000x 9344cl 9350cl 9354cl 100 000x.
Page 190: Signal Analysis
A–16 specifications signal analysis waveform processing processing functions: add, subtract, multiply, divide, negate, identity, summation averaging, and sine x/x; four functions performable at one time average: summed averaging of up to 1000 waveforms in the basic instrument; up to 10 6 averages po...
Page 191
A–17 9344c series, 9350c series, 9354c series interfacing remote control: by gpib and rs-232-c for all front-panel controls, internal functions rs-232-c port: asynchronous up to 115.2 kb/s for computer or terminal control, or printer or plotter connection gpib port: (ieee-488.1) configurable as talk...
Page 192: 9370C Series, 9374C Series
A–18 specifications Ø 9370c series, 9374c series signal capture acquisition system bandwidth ( -3 db): Ø @ 50 Ω : dc to 1 ghz 10 mv/div and above Ø @ 1 m Ω : dc to 500 mhz typical at pp005 probe tip Ø 1 ghz fet probe optional number of channels, digitizers: Ø 9374c series: four Ø 9370c series: two s...
Page 193
A–19 9370c series, 9374c series offset range: Ø 2.00–4.99 mv/div: ±400 mv Ø 5–99 mv/div: ±1 v Ø 0.1–1 v/div: ±10 v Ø 1–10 v/div: ±100 v (1 m Ω only) dc accuracy: typically 1% vertical resolution: 8 bits bandwidth limiter: Ø 25 mhz Ø 200 mhz input coupling: ac, dc, gnd input impedance: 50 Ω ±1 %, or ...
Page 194
A–20 specifications roll mode: Ø ranges 500 ms–1000 s/div Ø for >50 000 points: 10–1000 s/div external clock: Ø =100 mhz on ext input with ecl, ttl or zero crossing levels Ø optional 50–500 mhz rear panel fixed frequency clock input triggering system modes: normal, auto, single, and stop sources: ch...
Page 195: Signal Viewing
A–21 9370c series, 9374c series pattern: Ø two-channel models: triggers on the logic combination of the three inputs ch 1, ch 2 and ext trigger, where each source can be defined as high, low or don’t know and the trigger as the pattern’s beginning or end Ø four-channel models: triggers on the logic ...
Page 196: Signal Analysis
A–22 specifications vertical zoom: up to 5x vertical expansion (50x with averaging, up to 40 µv sensitivity, with optional wp01 advanced waveform math package) horizontal zoom: waveforms can be expanded to give 2–2.5 points/div. Model zoom factor 9370c 9374c 2000x 9370cm 9374cm 10 000x 9374ctm 50 00...
Page 197
A–23 9370c series, 9374c series cursor measurements relative time: arrow cursors measure time and voltage differences relative to each other relative voltage: horizontal bars measure voltage differences up to ±0.2% full-scale in single-grid mode absolute time: cross-hair marker measures time relativ...
Page 198
A–24 specifications safety: designed to comply with en 61010-1; ul and cul listed, file e 170588: protection category i, installation (over- voltage) category ii, pollution degree 2 see declaration of conformity for further details..
Page 199: 9384C Series
A–25 9384c series Ø 9384c series signal capture acquisition system bandwidth ( -3 db): Ø @ 50 Ω : dc to 1 ghz 10 mv/div and above Ø @ 1 m Ω : dc to 500 mhz typical at pp005 probe tip Ø 1 ghz fet probe optional number of channels: f o u r number of digitizers: f o u r sensitivity: Ø 50 Ω : 2 mv/div t...
Page 200
A–26 specifications four channels combined by pp094 adapter (peak detect off) 4 gs/s 400k 2m 8m one (pp094 input).
Page 201
A–27 9384c series dc accuracy: typically 1% at 10 mv and above vertical resolution: 8 bits bandwidth limiter: Ø 25 mhz Ø 200 mhz input coupling: ac, dc, gnd input impedance: 50 Ω ±1 %, or 1 m Ω //11 pf typical max. Input: Ø 50 Ω : ±5 v dc Ø 1 m Ω : 400 v max (dc + peak ac ≤ 10 khz) acquisition modes...
Page 202
A–28 specifications post-trigger delay: 0–10 000 divisions adjustable in 0.1 div increments holdoff by time: 10 ns–20 s holdoff by events: 0–99 999 999 events internal trigger range: ±5 div ext trigger max input: Ø 50 Ω ±1 %: ±5 v dc (500 mw) or 5 v rms Ø 1 m Ω /15 pf: 400 v max. (dc + peak ac ≤ 10 ...
Page 203: Signal Viewing
A–29 9384c series able to be selected, rise and fall time 1 ns typical (calibrator also offers trigger or pass/fail output) signal viewing display crt: 12.5 x 17.5 cm (9” diagonal) raster resolution: 810 x 696 points grids: 1, 2, or 4 grids. Formats: yt, xy and both together graticules: internally g...
Page 204
A–30 specifications waveforms in the basic instrument; up to 10 6 averages possible with optional wp01 advanced waveform math package.
Page 205
A–31 9384c series extrema: roof, floor or envelope values of from 1 to 10 6 waveforms — with wp01 option eres: low-pass digital filter provides up to 11 bits vertical resolution; sampled data always available, even when trace turned off; any of above modes usable without destroying data — with wp01 ...
Page 206
A–32 specifications publishing programs; printers and plotters: hp deskjet, hp thinkjet, quietjet, laserjet, paintjet, and epson printers; hp 7400 and 7500 series, or hpgl compatible plotters Ø optional internal, high-resolution graphics printer output formats: binary, or ascii waveform output compa...
Page 207
B–1 b appendix b: enhanced resolution enhanced resolution filtering the available sampling rate of lecroy oscilloscopes is often higher than that required for the analyzed signal’s bandwidth. Oversampling, particularly pronounced in the long-memory models, can be used to increase the displayed trace...
Page 208
B–2 appendix b fir enhanced-resolution-filter parameters resolution increase (enhancement) –3 db bandwidth ( × nyquist) filter length (samples) 0.5 0.5 2 1.0 0.241 5 1.5 0.121 10 2.0 0.058 24 2.5 0.029 51 3.0 0.016 117 with low-pass filters, the actual snr increase obtained in any particular situati...
Page 209
B–3 enhanced resolution of the overflowed data — the filter impulse response length — would be incorrect. This is because in some circumstances an overflow may be a spike of only one or two samples, and the energy in this spike may not be enough to significantly affect the results. It would then not...
Page 210: Examples
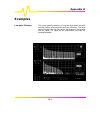
B–4 appendix b examples low-pass filtering this screen shows the spectrum of a square signal before (top grid) and after (bottom grid) enhanced resolution processing. The result clearly illustrates how the filter rejects high-frequency components from the signal. The higher the bit enhancement, the ...
Page 211
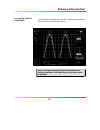
B–5 enhanced resolution increasing vertical resolution in this example the bottom trace has been significantly enhanced by a three-bit enhanced resolution function. Note: the original signal being highly oversampled, the resulting bandwidth is still high enough for the signal not to be distorted..
Page 212
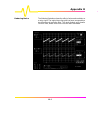
B–6 appendix b reducing noise the following illustration shows the effect of enhanced resolution on a noisy signal. The original trace (top grid) has been processed by a two-bit enhanced resolution filter. The result (bottom grid) shows a “smooth” trace, where most of the noise has been eliminated..
Page 213
B–7 enhanced resolution cautionary notes Ø the enhanced resolution function can only improve the resolution of a trace; it cannot improve the accuracy or linearity of the original quantization by the eight-bit adc. Ø the constraint of good temporal response excludes the use of maximally-flat filters...
Page 214: When and How to Use Fft
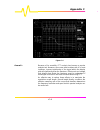
C–1 appendix c: fast fourier transform (fft) c when and how to use fft the wp02 spectral analysis package, with fft (fast fourier transform), reveals signal characteristics not visible in the time domain and adds the power of frequency domain analysis to your oscilloscope. Fft converts a time domain...
Page 215
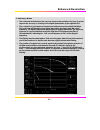
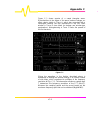
C–2 appendix c figure c–1 shows spectra of a swept triangular wave. Discontinuities at the edges of the wave produce leakage, an effect clearly visible in trace a, which was computed with a rectangular window, but less pronounced in the von hann window in trace b (see below for leakage and window-ty...
Page 216
C–3 using fft figure c–2 an fft operation on an n point time-domain signal may thus be compared to passing the signal through a comb filter consisting of a bank of n/2 filters. All the filters have the same shape and width and are centered at n/2 discrete frequencies. Each filter collects the signal...
Page 217
C–4 appendix c representation of choice for signals containing isolated peaks — periodic signals, for instance. The power density spectrum (v 2 /hz) is the power spectrum divided by the equivalent noise bandwidth of the filter in hz associated with the fft calculation. This is best employed for char...
Page 218
C–5 using fft if a signal contains a frequency component above nyquist, the spectrum will be aliased, meaning that the frequencies will be folded back and spurious. Spotting aliased frequencies is often difficult, as the aliases may ride on top of real harmonics. A simple way of checking is to modif...
Page 219
C–6 appendix c rectangular windows provide the highest frequency resolution and are thus useful for estimating the type of harmonics present in the signal. Because the rectangular window decays as a sinx/x function in the spectral domain, slight attenuation will be induced. Alternative functions wit...
Page 220
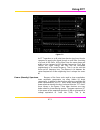
C–7 using fft spectral power averaging is the technique of choice when determining the frequency response of passive networks such as filters. Figures 3 and 4 show the transfer functions of a low pass filter with a 3 db cutoff o1 11 mhz obtained by exciting the filter with a white noise source (fig....
Page 221
C–8 appendix c figure c–4 overall… because of its versatility, fft analysis has become a popular analysis tool. However, some care must be taken with it. In most instances, incorrect positioning of the signal within the display grid will significantly alter the spectrum. Effects such as leakage and ...
Page 222: Using Fft Functions
C–9 using fft using fft functions select “fft” from the “math type” menu (see chapter 10 for a full description of math and waveform processing menus). Spectra displayed with a linear frequency axis running from zero to the nyquist frequency are shown at the right-hand edge of the trace. The frequen...
Page 223
C–10 appendix c the following selections can be made using the “fft result” menu. Phase measured with respect to a cosine whose maximum occurs at the left-hand edge of the screen, at which point it has 0 ° . Similarly, a positive-going sine starting at the left-hand edge of the screen has a –90 ° ph...
Page 224
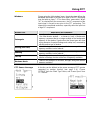
C–11 using fft windows chosen using the “with window” menu, the window type defines the bandwidth and shape of the filter to be used in the fft processing (see the table on page c–17 for these filters’ parameters). When “ac” is selected from the same menu, the dc component of the input signal is for...
Page 225
C–12 appendix c additional processing other waveform processing functions, such as averaging and arithmetic, can be applied to waveforms before fft processing is performed. Time-domain averaging prior to fft, for example, can be used if a stable trigger is available to reduce random noise in the sig...
Page 226
C–13 using fft error messages one of these fft-related error messages may be displayed at the top of the screen. Error messages message meaning “incompatible input record type” fft power average is defined only on a function defined as fft. “horizontal units don't match” fft of a frequency-domain wa...
Page 227: Fft Algorithms
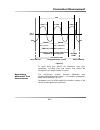
C–14 appendix c fft algorithms a summary of the algorithms used in the oscilloscope's fft computation is given here in the form of seven steps: 1. If the maximum number of points is smaller than the source number of points, the source waveform data are decimated prior to the fft. These decimated dat...
Page 228
C–15 fft algorithms the energy of the signal at a frequency n is distributed equally between the first and the second halves of the spectrum; the energy at frequency 0 is completely contained in the 0 term. The first half of the spectrum (re, im), from 0 to the nyquist frequency is kept for further ...
Page 229
C–16 appendix c where m min is the minimum magnitude, fixed at about 0.001 of the full scale at any gain setting, below which the angle is not well defined. Thedbm power spectrum: dbm ps m m m m n ref n ref = × = × 10 20 10 2 2 10 log log where m ref = 0.316 v (that is, 0 dbm is defined as a sine...
Page 230: Glossary
C–17 fft glossary glossary defines the terms frequently used in fft spectrum analysis and relates them to the oscilloscope. Aliasing if the input signal to a sampling acquisition system contains components whose frequency is greater than the nyquist frequency (half the sampling frequency), there wil...
Page 231
C–18 appendix c enbw equivalent noise bandwidth (enbw) is the bandwidth of a rectangular filter (same gain at the center frequency), equivalent to a filter associated with each frequency bin, which would collect the same power from a white noise signal. In the table on the previous page, the enbw is...
Page 232
C–19 fft glossary frequency resolution in a simple sense, the frequency resolution is equal to the bin width ∆ f. That is, if the input signal changes its frequency by ∆ f, the corresponding spectrum peak will be displaced by ∆ f. For smaller changes of frequency, only the shape of the peak will cha...
Page 233
C–20 appendix c the highest point in the power spectrum can be 3.92 db lower (1.57 times) when the source frequency is halfway between two discrete bin frequencies. This variation of the spectrum magnitude is called the picket fence effect (the loss is called the scallop loss). All window functions ...
Page 234
C–21 fft glossary the following table lists the coefficients a m . The window functions seen in the time domain are symmetric around the point k = n/2. Coefficients of window functions window type a0 a1 a2 rectangular 1.0 0.0 0.0 von hann 0.5 –0.5 0.0 hamming 0.54 –0.46 0.0 flat-top 0.281 –0.521 0.1...
Page 235: Parameters and How They Work
D–1 d appendix d: parameter measurement parameters and how they work in this appendix, a general explanation of how the instrument’s standard parameters are computed (see below) is followed by a table listing, defining and describing those parameters (page d–5). Proper determination of the top and b...
Page 236
D–2 appendix d determining time parameters once top and base are estimated, calculation of the rise and fall times is easily done (fig.1). The 90 % and 10 % threshold levels are automatically determined by the oscilloscope, using the amplitude (ampl) parameter. Threshold levels for rise or fall time...
Page 237
D–3 parameter measurement determining differential time measurements figure d–2 to avoid these bias effects, the instrument uses cyclic parameters, including crms and cmean, that restrict the calculation to an integer number of cycles. The oscilloscope enables accurate differential time measurements...
Page 238
D–4 appendix d figure d–3 moreover, a hysteresis range may be specified to ignore any spurious transition that does not exceed the boundaries of the hysteresis interval. In figure 3, ∆ c2d− (1, 2) measures the time interval separating the rising edge of the clock (trigger) from the first negative tr...
Page 239
D–5 parameter measurement p a r a m e t e r a n d w h a t i t d o e s definition notes a m p l amplitude: measures difference between upper and lower levels in two-level signals. Differs from pkpk in that noise, overshoot, undershoot, and ringing do not affect measurement. Top - base (see fig. D–1) ...
Page 240
D–6 appendix d p a r a m e t e r a n d w h a t i t d o e s definition notes csdev cyclic standard deviation:standard deviation of data values from mean value over integral number of periods. Contrary to sdev, calculation performed over integral number of cycles, eliminating bias caused by fractional...
Page 241
D–7 parameter measurement p a r a m e t e r a n d w h a t i t d o e s definition notes dur for single sweep waveforms, dur is 0; for sequence waveforms: time from first to last segment’s trigger; for single segments of sequence waveforms: time from previous segment’s to current segment’s trigger; fo...
Page 242
D–8 appendix d p a r a m e t e r a n d w h a t i t d o e s definition notes threshold arguments specify two vertical values on each edge used to compute fall time. Formulas for upper and lower values: lower value lower threshold = × + amp base 100 upper value upper threshold = × + amp base 100 first...
Page 243
D–9 parameter measurement p a r a m e t e r a n d w h a t i t d o e s definition notes maximu m measures highest point in waveform. Unlike top, does not assume waveform has two levels. Highest value in waveform between cursors (see fig. D–1) gives similar result when applied to time domain waveform ...
Page 244
D–10 appendix d p a r a m e t e r a n d w h a t i t d o e s definition notes p e r i o d period of a cyclic signal measured as time between every other pair of 50 % crossings. Starting with first transition after left cursor, period is measured for each transition pair, with values averaged to give ...
Page 245
D–11 parameter measurement p a r a m e t e r a n d w h a t i t d o e s definition notes arguments threshold remote lower limit upper limit default lower low 1 % 45 % 10 % upper high 55 % 99 % 90 % threshold arguments specify two vertical values on each edge used to compute rise time. Formulas for up...
Page 246
D–12 appendix d p a r a m e t e r a n d w h a t i t d o e s definition notes top higher of two most probable states, the lower being base. This is characteristic of rectangular waveforms and represents the higher most probable state determined from the statistical distribution of data point values i...
Page 247: Using Ascii-Stored Files
E–1 appendix e: ascii waveform export e using ascii-stored files the ascii waveform storage feature allows waveforms to be stored to a mass-memory device in any of three ascii formats: spreadsheet, mathcad and matlab. Each format is tailored for a commonly used analysis package. The user-interface c...
Page 248
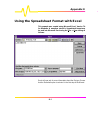
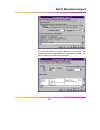
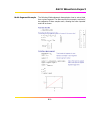
E–2 appendix e using the spreadsheet format with excel this example was created using microsoft excel, version 7.0 for windows. A waveform stored in spreadsheet format may be read into microsoft excel using the file -> open dialog as follows: excel will now ask for more information about the file ty...
Page 249
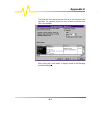
E–3 ascii waveform export the next step allows the specific delimiter to be specified. The spreadsheet format generated by the scope uses a comma (,) to delimit columns. Ensure that this is selected..
Page 250
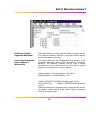
E–4 appendix e the third and final step allows the format of the columns to be specified. The ‘general’ format for each column should be used (this is the default). After clicking the finish button, a display similar to that following should be displayed..
Page 251
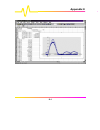
E–5 ascii waveform export plotting the data from a single-segment waveform requires the use of a scatter plot based on the data in the first two columns with the first column used as the x values. The header created for the spreadsheet format contains all the information required to extract various ...
Page 252
E–6 appendix e.
Page 253: Using Mathcad
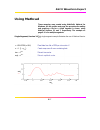
E–7 ascii waveform export using mathcad these examples were created using mathsoft’s mathcad for windows. On this and the next page, the procedure for reading and graphing a file for a single segment is shown, using mathcad versions 3.1 and 7, respectively. The example on page e–9 is for multiple se...
Page 254
E–8 appendix e single-segment, version 7 this single-segment example is valid for more recent versions of mathcad: a readprn file ( ) k last a 0 a submatrix a 2 , k , 0 , 1 , ( ) t a 0 v a 1 k last t ( ) k 0 k 1 .. V k t k 0.001 0 0.001 0.002 0.003 0.004 1 0 1.
Page 255
E–9 ascii waveform export multi-segment example the following mathcadexample demonstrates how to extract data from a given segment. The data used for this example consisted of two segments of three samples each, allowing the entire imported matrix to be shown..
Page 256: Using Matlab
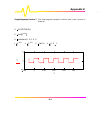
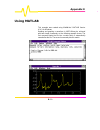
E–10 appendix e using matlab this example was created using mathworks’ matlab version 4.2c.1 for windows. Reading and graphing a waveform in matlabmay be achieved with two simple commands, as the following example shows. The first command loads the file into a matrix which is automatically named aft...
Page 257
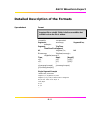
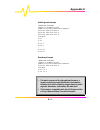
E–11 ascii waveform export detailed description of the formats spreadsheet format note: fields in bold type are constants that are present in the output file as shown. Fields in italic are variables that are filled in when the file is written. , segments, numseg>, segmentsize, numpts> segment, trigt...
Page 258
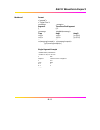
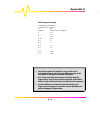
E–12 appendix e multi-segment example lecroy9354,935412345 segments,3,segmentsize,502 segment,trig time,timesincefirstsegment #1,21 mar 1990 9:37:08,0.0 #2,21 mar 1990 9:37:13,5.0 #3,21 mar 1990 9:37:15,7.0 time,ampl 0.0,1 0.1,2 ... 0.0,1.1 0.0,2.1 ... 0.0,1.05 0.0,2.05 dual-array example lecroy9354...
Page 259
E–13 ascii waveform export mathcad format segment timesincefirstsegment 1 0.0 ... ... Numseg)> time ampl ampl1 [] [] ... ... [] single-segment example “lecroy9354,935412345” “23-march-90,12:44:23” 1 502 segment timesincefirstsegment 1 0.0 time ampl 0.0 1 0.1 2 ......
Page 260
E–14 appendix e multi-segment example “lecroy9354,935412345” “23-march-90,12:44:23” 3 502 segment timesincefirstsegment 1 0.0 2 5.0 3 7.0 time ampl 0.0 1 0.1 2 ..... 0.0 1.1 0.1 2.1 ..... 0.0 1.05 0.1 2.05 note: Ø the format created for mathcad is very similar to the spreadsheet format, but with som...
Page 261
E–15 ascii waveform export matlab files format y(0) y(1) ... Y(numseg*numpts) single segment example 1.0 1.1 1.2 ... 4.5 notes Ø the matlab format is simple, without header information and having amplitude values only. Ø multiple segments will be appended without a separator. Ø only one value from t...
Page 262
Index a ac, 8–5, c–15, 7–8 acquisition memory, 7–1, c–4 9304c/9310c/9314c series, a–1 9344c/9350c/9354c series, a–7 9370c/9374c series, a–14 9384c series, a–21 acquisition modes, 6–2, 7–5 9304c/9310c/9314c series, a–2 9344c/9350c/9354c series, a–9 9370c/9374c series, a–15 9384c series, a–22 acquisit...
Page 263
Index bmp, 12–2, 12–8, a–5, a–13, a– 19, a–26 boolean and, 8–22 c cabling pc, 12–6 printer, 12–5 cal bnc setup, 12–1, 12–21 cal/bnc, 14–13 calibration, 2–2, 5–4, 12–19, 12– 21 9304c/9310c/9314c series, a–6 9344c/9350c/9354c series, a–13 9370c/9374c series, a–19 9384c series, a–26 capture information...
Page 264
Cyclic median, d–5 cyclic parameters, d–3 cyclic root mean square, d–5 cyclic standard deviation, d–6 d data, d–6 data density, d–1 data edge, 14–12 data format, 13–3 data maps, 12–12 dc, 8–5, c–15 dc accuracy 9344c/9350c/9354c series, a–8 9370c/9374c series, a–15 9384c series, a–22 dc offset compen...
Page 265
Index edge trigger with hold-off by time, 8–6 edge-qualified trigger, 8–21, 8– 25, 8–36 edge-qualified trigger with wait, 8–24 electricity, 3–3 enbw, c–17 enhanced resolution, 10–10 enhanced resolution filtering, b– 1, b–2, b–3, b–4, b–5, b–6, c– 6 enhanced resolution setup, 10– 10 envelope, 10–11 e...
Page 266
Also waveform processing (frequency) frequency bins, c–18 frequency range, c–18 9304c/9310c/9314c series, a–1 9344c/9350c/9354c series, a–7 9370c/9374c series, a–14 9384c series, a–21 frequency resolution, 10–17, c– 2, c–8, c–11, c–19 frequency span, 10–18, 10–19, c–8 front-panel controls, 4–3 fuses...
Page 267
Index i input coupling 9304c/9310c/9314c series, a–2 9344c/9350c/9354c series, a–8 9370c/9374c series, a–15 9384c series, a–22 input impedance, 5–4 9304c/9310c/9314c series, a–2 9344c/9350c/9354c series, a–9 9370c/9374c series, a–15 interfacing 9304c/9310c/9314c series, a–5 9344c/9350c/9354c series,...
Page 268
Memories, 2–1, 13–1, 13–4, 13–5, 15–1, 15–2 memory, c–4, c–12 memory card, 12–7, 12–10, 12– 15, 13–1, 13–2, 13–5, 14–19, 15–1, 15–2 memory used/available summary, 16–5 menu buttons and knobs, 4–3 menu options, 4–5 menu-entry buttons, 4–4, 4–6, 4– 7, 9–2, 11–1, 12–1, 13–1, 13–4, 14–3 menus moving thr...
Page 269
Index 9304c/9310c/9314c series, a–5 9344c/9350c/9354c series, a–13 9370c/9374c series, a–19 9384c series, a–25 pcmcia. See utilities:memory card peak detect, 7–2, 7–5 9344c/9350c/9354c series, a–9 9370c/9374c series, a–15 9384c series, a–22 peak–to–peak, 14–6, d–9 period, d–9 periodic signals, c–6 p...
Page 270
9304c/9310c/9314c series, a–3 9344c/9350c/9354c series, a–10 9370c/9374c series, a–16 9384c series, a–23 qualifier. See qualified triggers r real time clock field, 4–9 real, real + imaginary, imaginary fft, c–10 recall w’form, 13–4, 13–5 recalling setups, 15–2, 15–3 record, 7–6 record length maximis...
Page 271
Index 9384c series, a–21 scaling, 6–1 in fft, 10–19 scallop loss, c–4, c–17, c–20 screen dump, 4–7, 12–2 screen intensity grid, 11–6, 11–7, 11–9 waveform and text, 11–6, 11–7, 11–9 segments, 6–2, 7–1, 7–3, 7–5, 7– 6, 7–8, 10–3, 10–6 9304c/9310c/9314c series, a–2 select abcd, 9–1 select channel, 5–1 ...
Page 272
State-qualified trigger with wait, 8–22 statistics, 14–4, 14–6, 14–7, 14–8 stop, 6–1, 7–8, 10–3 stop bits, 12–6 storage copy files, 12–18 storage availability, 12–9 store w’forms, 13–1, 13–2 summary, 16–1 summed averaging, 10–3, 10–9 system setup, 4–6 system summary, 16–2 t temperature, 3–1 9304c/93...
Page 273
Index 9370c/9374c series, a–16 9384c series, a–22 trigger delay, 4–9, 6–3, 7–1, 8–6, 8–27, 8–36, 14–7 9304c/9310c/9314c series, a–3 9344c/9350c/9354c series, a–10 9370c/9374c series, a–16 9384c series, a–23 trigger events, 8–9, 8–35 trigger holdoff, 8–33 9344c/9350c/9354c series, a–10 9370c/9374c se...
Page 274
9370c/9374c series, a–16 9384c series, a–22 tv trigger, 8–25, 8–34 9304c/9310c/9314c series, a–3 9344c/9350c/9354c series, a–10 9370c/9374c series, a–16 9384c series, a–23 tv type, 8–34 u utilities, 4–6, 7–9, 12–1 file transfers, 12–10 floppy disk, 12–7, 12–12, 12–13 gpib port, 12–5 hard disk, 12–7,...
Page 275
Index 9370c/9374c series, a–18 9384c series, a–24 zoom menu, 10–7 zoom of math functions, 10–1.

