Quest Engineering 1800 Instructions manual

Manual is about: Precision Integrating Sound Level Meter

Summary of 1800

  • Page 1

    Model 1800 precision integrating sound level meter and model ob-100 octave band filter and model ob-300 1/1 - 1/3 octave band filter instructions for note : due to the new atex directive in europe, all references in this document to "ex" or "eex" for intrinsic safety approvals should be disregarded ...

  • Page 2

    1 viii. About the filter . . . . . . . . . . . . . . . . . . . . . . . . 29 a. Filter controls . . . . . . . . . . . . . . . . . . . . . . . . 29 power switch . . . . . . . . . . . . . . . . . . . . . . . . 29 start buttons . . . . . . . . . . . . . . . . . . . . . . . . 29 -20 db button . . . . . ....
  • Page 3

    3 stored in its protective box when not in use for long periods of time. To attach the microphone to the preamplifier, screw the microphone onto the threaded end of the preamp. Attach the preamp to the meter by placing the connector ends together and rotating the preamp until it drops onto the meter...

  • Page 4

    5 battery button pressing the battery button will indicate relative battery strength in the bar portion of the display. This button may be pressed at any time without affecting the meter signal processing. (see iii. A., battery check for more information.) response switch the response switch control...

  • Page 5

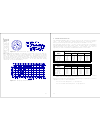
    7 figure 2. Output jack connections d. Output jacks all output jacks use a 3.5 mm stereo plug. (see figure 2) the following describes each output function: print - pressing the print button causes serial ascii data to be transmitted from the print jack at appropriate rs-232 levels. This data may be ...

  • Page 6

    9 figure 4. Battery compartment internal switches. D i s p l a y t i m e - t h e reces s e d d i p switc h contr o l s t h e r a t e a t which t h e displ a y updat e s . T h e options are 1.0 second or 0.25 second. G. Printout the sound level meter produces a hard-copy of the information accumulate...

  • Page 7

    11 iii. Checking the meter integrity a. Battery check at any time (except during print), the battery push button can be pressed to get an indication of battery strength. The weaker of the two 9 volt batteries is shown on the bar indicator of the model 1800's display. Good batteries will be indicated...

  • Page 8

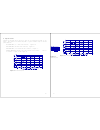
    13 figure 6. Effect of background on measurement measuremen t. 14 figure 7. Acoustic effect of windscreens c. Wind screen effects to prevent erroneous measurement of sound levels caused by wind blowing across the microphone, the use of a windscreen is recommended. The wind screen will reduce wind ef...

  • Page 9

    15 d. Chart recording the model 1800 has a dc output that is linearly related to the 60 db lcd analog bar movement as follows: analog bar (db) 0 10 20 30 40 50 60 dc output (v) .00 .17 .33 .50 .67 .83 1.00 this output, capable of driving up to 100 feet of shielded or twisted pair cable, is intended ...

  • Page 10

    17 the remainder of the internal switch settings are set the same as they would be for a micro-15. Consult the nl-15 manual for complete instructions. The nl-15 will accumulate data when it is connected to the meter data output jack if the following two conditions are met: 1. The led on the nl-15 is...

  • Page 11

    19 figure 10. Typical frequency response - model qe4146 microphone b. Microphone the model 1800 is designed to accept either a half-inch or one-inch microphone of either prepolarized (electret) or condenser type. The prepolarized (electret) microphone does not require a polarization voltage. If a co...

  • Page 12

    21 figure 13. Microphone output attenuation caused by input capacitance of preamp d . Microphone p r e a m p extension cables t h e microphone p r e a m p c o n v e r t s the high o u t p u t impedance o f t h e microphone to a low o u t p u t impedance. An extension cable of up to 100 feet in lengt...

  • Page 13

    23 figure 15. Meter electrical input (direct) figure 16. Weighting characteristics f . Weighting characteri stics t h e weighting characteri s t i c s (frequency response) for a, b, c , a n d linear are shown in figure 16. The "a" weighting response emulates the response of the human ear and is used...

  • Page 14

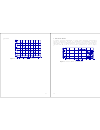
    25 figure 18. Slow response h. Response charts figures 18 through 22 are plots for each of the response settings of the meter. They show how the meter responds to a given sinewave input of varied pulse duration. Slow response (1000 msec time constant) figure 18. Fast response (125 msec time constant...

  • Page 15

    27 figure 21. Impulse response figure 22. Impulse response to repeated impulses 28 vi. Specifications standards: meets or exceeds ansi s1.4-1983, type 1 and relevant sections of iec 651-1979, type 1(i) and iec 804-1985. Display: 3 1/2 digit liquid crystal display with an additional quasi-analogue 60...

  • Page 16

    29 meter input: the input impedance is 1 megohm in series with 0.1 mfd. The maximum sinusoidal input voltage is 10v rms. Ac output: 3.16 v rms at full scale (60 db). (3.8 v rms maximum) the output impedance is 3.2k ohms. Connected equipment should be at least 10k ohms. The output can be shorted with...

  • Page 17

    31 vii. Introduction to the model ob-100. The quest model ob-100 octave filter is a plug-in module containing a selectable set of filters. The ob-100 meets the most stringent requirements of ansi s1.11-1986 and iec r225-1966 for octave band filters. The unit contains ten selectable filter ranges fro...

  • Page 18

    33 1. Read the calibrator 1 khz output level. Set the meter db range switch so that the calibrator level will indicate within the upper 20 db of the meter display. Set the response switch to fast, weighting switch to lin and mode switch to spl. Turn the power switch to on. 2. Set the ob-100 power sw...

  • Page 19

    35 c. Reviewing the data to review the data, the meter must be in the pause mode. Use the up/down buttons on the filter to review the frequencies that were measured. Each frequency has the following information in memory: spl, max, min, sel, time and leq. If an overload occurred during any frequency...

  • Page 20

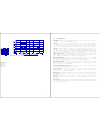
    37 figure 25. Block diagram model ob-100 octave filter 38 xii. Introduction to the model ob-300 the quest model ob-300 1/3 - 1/1 octave filter is a plug-in module containing a selectable set of filters. The ob-300 meets the most stringent requirements of ansi s1.11-1986 and iec r225-1966 for octave ...

  • Page 21

    39 figure 26. Ob-300 external filter connector (located on top of filter) mode switch selects either the 1/3 octave filter set (33 frequencies) or the 1/1 octave filter set (11 frequencies). Time a screwdriver adjustment to control the automatic cycle time of each filter frequency from approximately...

  • Page 22

    41 note: note that the filter response can be in series with either a, b, c, or lin. This is the operator's choice. However, lin is generally used when taking octave band measurements. 3. Turn the ob-300 power switch to manual to activate the filter. "-- -" will appear in the display with the meter ...

  • Page 23

    43 figure 27. Typical ob-300 filter response x v i . Specificat ions stand ards: a n s i s1.11 -1986 , order 3 , t y p e 2 , sub-t ype c a n d i e c r225- 1966. Center frequencies: (1/3 mode) 33 frequencies from 12.5 hz to 20 khz. (1/1 mode) 11 frequencies from 16 hz to 16 khz. Frequency selection: ...

  • Page 24

    45 xvii. Addendum for the model 1800-5 the model 1800-5 integrating sound level meter is a special purpose integrating meter with an exchange rate of 5db. This instruction manual is written for an exchange rate of 3db. This addendum lists the changes in this instruction manual to make it compatible ...

  • Page 25

    47 b. Downloading using windows tm there is a variety of commercially available software that can easily accept data from the meter. These software packages are usually termed "communications software". Microsoft ® windows tm has a communications program under the accessories icon called terminal. I...