Racelogic PerformanceBox Manual
Racelogic Ltd
Introduction
02/05/2014
Page 1
CONGRATULATIONS ON PURCHASING A RACELOGIC PERFORMANCEBOX!
PerformanceBox is based on the Racelogic VBOX, which is used by the majority of Car
Manufacturers, Tyre Manufacturers and car magazines around the world to assess performance.
You can be sure that in PerformanceBox you have a product which will prove to be invaluable in all
your motorsport applications.
Performance
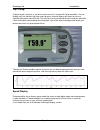
With PerformanceBox it is very easy to measure acceleration
times, braking distances, quarter mile times and many more.
There are a number of configurable screens that show specific
test results such as 0-60, 0-100, 0-100-0, ½ mile and ¼ mile
etc.
Because it is very easy to edit the test ranges,
PerformanceBox is a very powerful tool for use in many
different kinds of vehicle testing. Vehicle modification can be
readily assessed and given specific improvement parameters
– the perfect tool for any tuning enthusiast.
Because it is very easy to edit the test ranges,
PerformanceBox is a very powerful tool for use in many
different kinds of vehicle testing.
Summary of PerformanceBox
Page 1
Racelogic ltd introduction 02/05/2014 page 1 congratulations on purchasing a racelogic performancebox! Performancebox is based on the racelogic vbox, which is used by the majority of car manufacturers, tyre manufacturers and car magazines around the world to assess performance. You can be sure that ...
Page 2
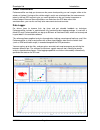
Racelogic ltd introduction 02/05/2014 page 2 lap timing displaying your lap times as you drive around a circuit is simple with performancebox. You can display your last and best lap times and lap count, and also display split times for up to six specified split points around the lap. The split files...
Page 3
Racelogic ltd introduction 02/05/2014 page 3 power calculations performancebox can help you to meas ure the power developed by your car’s engine, either at the wheels or flywheel. Having set the vehicle weight, results are calculated from the measurements taken by the fast gps engine to give you use...
Page 4: Contents
Racelogic ltd contents 02/05/2014 page 4 contents q uick s tart g uide ..................................................................................................................... 7 i ntroduction ..................................................................................................
Page 5
Racelogic ltd contents 02/05/2014 page 5 c alculating l osses ................................................................................................................ 28 input module screen .........................................................................................................
Page 6
Racelogic ltd contents 02/05/2014 page 6 show split info on graph chart ............................................................................................. 50 gate width ...........................................................................................................................
Page 7: Quick Start Guide
Racelogic ltd quick start guide 02/05/2014 page 7 quick start guide introduction performancebox is a self-contained gps data logger and performance meter. A 10hz fully calibrated gps engine is used to provide accuracy and precision and the data can be stored on a removable sd flash card. Real time r...
Page 8
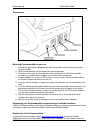
Racelogic ltd quick start guide 02/05/2014 page 8 connections mounting performancebox in your car 1. Connect the cigar lighter adaptor power cable to the power socket on the back of your performancebox. 2. Slide performancebox into the windscreen mounting bracket. 3. Using the suction cups of the wi...
Page 9
Racelogic ltd quick start guide 02/05/2014 page 9 the serial number is displayed when you first switch on, or alternatively you can note it from the underside of the performancebox hardware itself (the serial number will begin with 501.) once you have entered your details you will be emailed an acti...
Page 10: Using Performancebox
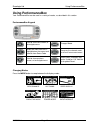
Racelogic ltd using performancebox 02/05/2014 page 10 using performancebox your performancebox can be used in a variety of modes, as described in this section. Performancebox keypad used to show next screen, or to navigate menu. Changes mode. Select the menu item that is highlighted on the screen an...
Page 11
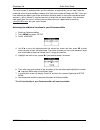
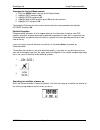
Racelogic ltd using performancebox 02/05/2014 page 11 changing the units of measurement 1. Press the menu button from any of the display modes. 2. Highlight units and press ok. 3. Highlight speed and press ok. 4. Highlight kmh or mph and then press ok to tick that selection. 5. Highlight exit and pr...
Page 12: Performance Mode
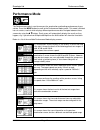
Racelogic ltd performance mode 02/05/2014 page 12 performance mode the performance mode is used to measure the acceleration and braking performance of your vehicle. Press the mode button to scroll to the performance mode screen. This mode is divided into six screens, each of which displays different...
Page 13
Racelogic ltd performance mode 02/05/2014 page 13 this screen shows the time and end velocity of two user- configurable distances, i.E. 0-100m. If the units are changed to feet then the two test ranges default to 60’ and 330’, but can be changed to the desired distance. Start speed is also configura...
Page 14
Racelogic ltd performance mode 02/05/2014 page 14 8. After doing a number of runs you can view your best 0-60 time by scrolling to the best screen. 9. If you have your sd card inserted then your run data will be stored. Please note, to record a results file, you must accelerate over at least 30 km/h...
Page 15
Racelogic ltd performance mode 02/05/2014 page 15 1 foot rollout the performancebox normally takes the start of a performance run at the point at which the vehicle moves, but at drag strips the vehicle starts 1 foot behind the timing start line. You can make the performancebox start all timing runs ...
Page 16
Racelogic ltd performance mode 02/05/2014 page 16 example resultxx.Txt file: --------------- run 0001 --------------- time 13:09 date 31/03/2014 accel results speed(mph) time(s) 0-60 05.3 0-100 11.7 accel distance results distance(m) time(s) @speed(mph) 0-20 02.6 32.0 0-0 00.0 00.5 0-0 00.0 00.5 0-0...
Page 17
Racelogic ltd performance mode 02/05/2014 page 17 speed buzzer the speed buzzer can be used in such tests as 0-100-0, as an audible warning when a certain speed has been reached. This means that during such testing the driver will not need to watch the display and can listen for the buzzer instead. ...
Page 18: Laptiming Mode
Racelogic ltd lap timing mode 02/05/2014 page 18 laptiming mode performancebox can be used to measure lap times by storing the position of a virtual gate and using this to trigger the start and end of a lap. Further locations can be added to represent split and dedicated finish lines. Start/finish l...
Page 19
Racelogic ltd lap timing mode 02/05/2014 page 19 lap count a count of the number of completed laps is displayed in the top left corner of the lap timing screen. To reset the lap count and the best lap time, press the reset button. Lap timing including split points this method allows for the setting ...
Page 20
Racelogic ltd lap timing mode 02/05/2014 page 20 split to split time there are two different ways of measuring split times. The default is from the start of the lap to the split, the other method is from one split to another. To change between these options, tick or un- tick the option ‘split to spl...
Page 21
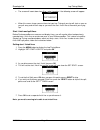
Racelogic ltd lap timing mode 02/05/2014 page 21 the screen will count down from 5 to 1 after it reaches 1 the following screen will appear: when this screen shows you can then start your lap. Timing of your lap will start as soon as you pull away and will then stop as you cross the start / finish l...
Page 22
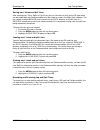
Racelogic ltd lap timing mode 02/05/2014 page 22 saving start / finish and split lines after creating start / finish, splits or finish lines you can save them to a file on the sd card which can be loaded back into performancebox at a later stage, or used in the vbox tools software. The file created ...
Page 23
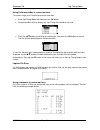
Racelogic ltd lap timing mode 02/05/2014 page 23 using performancebox to review lap times to review a ‘laps-xx.Txt’ file with lap and split time data: enter lap timing mode and then press the ok button. Performancebox will then display any lap timing files stored on the card: press the ▲▼ buttons to...
Page 24: Predictive Mode
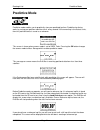
Racelogic ltd predictive mode 02/05/2014 page 24 predictive mode predictive mode enables you to graphically view your predicted lap time. Predictive lap timing works by saving your position around a circuit, every second. If the current lap is the fastest so far, then this positional data is saved a...
Page 25
Racelogic ltd predictive mode 02/05/2014 page 25 once a valid reference lap has been created or loaded, the drift box will begin predicting. The prediction is shown in text and graph format which is a graphical representation of the amount of time gained or lost around the lap. When a lap has been c...
Page 26: Speed Display Mode
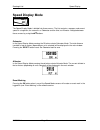
Racelogic ltd speed display 02/05/2014 page 26 speed display mode the speed display mode is divided into three screens. The first contains a compass and current speed in a large font, the second is an odometer and the third, an altimeter. Navigate between these screens by using the ▲▼ buttons. Odome...
Page 27: Power Mode
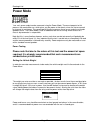
Racelogic ltd power mode 02/05/2014 page 27 power mode your car’s power output can be measured using the power mode. There are two parts to this process: the acceleration run, which gives you the power at the wheels minus the losses caused by tyre and air resistance. The second part of the test meas...
Page 28
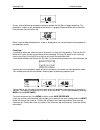
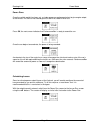
Racelogic ltd power mode 02/05/2014 page 28 power runs once the vehicle weight has been set, a simple power run can be carried out to give engine output at the wheels. Put the car into second gear at a low rpm, 2000 rpm or less. Press ok, the next screen indicates that performancebox is ready to rec...
Page 29
Racelogic ltd power mode 02/05/2014 page 29 begin to accelerate, and press ok. Continue to accelerate to the top of the engine rev range. At the top of the rev range, disengage the clutch and put the gearbox into neutral. Once deceleration has begun the screen will display the recording information:...
Page 30: Input Module Screen
Racelogic ltd power mode 02/05/2014 page 30 input module screen the input module screen provides the ability to configure the input and output channels of a connected micro input module and view the data on each of the input module channels. Nb: this mode requires the rs232 chip upgrade in order to ...
Page 31: Data Logging
Racelogic ltd data logging 02/05/2014 page 31 data logging providing that you have registered your performancebox (see quick start guide) then it will be capable of logging data to an sd card. Using the sd card the performance box will only work with sd and sdhc hardware. Files logged by performance...
Page 32: Setup Menu
Racelogic ltd setup menu 02/05/2014 page 32 setup menu there is a single setup menu that is accessible in all of the performancebox’s modes. To access the setup menu, press the menu button in any mode and select the ‘setup’ option and press ok the setup menu contains the following options: setup men...
Page 33
Racelogic ltd coldstart 02/05/2014 page 33 cold start a cold start completely re- initialises the performancebox’s gps engine. Gps coldstarts clear the gps engine’s list of satellite positions and configures the gps engine for normal performancebox operation. For this reason, coldstarts should be pe...
Page 34: Troubleshooting
Racelogic ltd troubleshooting 02/05/2014 page 34 troubleshooting my performancebox does not pick up or lock onto satellites. Some modern cars are fitted with a special windscreen that cuts down the amount of uv (ultra violet) rays that will be transferred through the windscreen which help cut down o...
Page 35: Performancetools Software
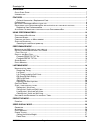
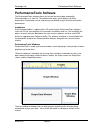
Racelogic ltd performancetools software 02/05/2014 page 35 performancetools software the performancetools software allows you to view the driving data recorded by performancebox in a ‘.Dbn’ file. The software also allows you to display lap times, acceleration, deceleration results, and to carry out ...
Page 36
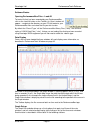
Racelogic ltd performancetools software 02/05/2014 page 36 graph window in the graph window different channels can be plotted, either against time or against distance, and up to four ‘.Dbn’ files can be overlaid on the graph. The graph window can display large amounts of data at once, with the addit...
Page 37
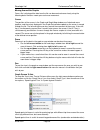
Racelogic ltd performancetools software 02/05/2014 page 37 software basics opening performancebox files – load all to load a file that has been recorded by your performancebox, click on the load all button on the toolbar. An ‘open’ window will appear – navigate to the directory on your pc that conta...
Page 38
Racelogic ltd performancetools software 02/05/2014 page 38 moving around the graphs once a file is displayed the data from the file can be examined more closely using the following basic functions: zoom, pan and cursor movement. Cursor the position of the cursors in the graph and graph:map windows a...
Page 39
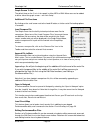
Racelogic ltd performancetools software 02/05/2014 page 39 graph screen y axis the default view on the y axis is for speed, in either mph or kmh. More axes can be added to either side of the graph screen – see ‘axis setup’. Additional file functions by clicking on the small arrow next to the load al...
Page 40
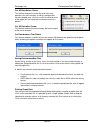
Racelogic ltd performancetools software 02/05/2014 page 40 cut all data before cursor this feature removes the entire file up to the cursor position in the main memory (ie not any compare files currently loaded) only. You can use this to select an area of the graph you are interested in and then sav...
Page 41
Racelogic ltd performancetools software 02/05/2014 page 41 exporting graph data it is possible to export the graph or map as a picture file, which can either be saved or copied onto the co mputer’s clipboard for use with other software. Simply click the ‘export’ icon and then choose the image to exp...
Page 42
Racelogic ltd performancetools software 02/05/2014 page 42 selecting channels all channels logged by performancebox appear in the data window; all except speed are initially greyed out, but the data can still be seen. To enable a particular channel and make it visible in the graph window, click in t...
Page 43
Racelogic ltd performancetools software 02/05/2014 page 43.
Page 44
Racelogic ltd performancetools software 02/05/2014 page 44 channel and axis setup for each channel there are a number of attributes that can be configured, including those relating to the y-axis. These are configured in the channel set-up and axis set-up screens, which are accessed by double-clickin...
Page 45
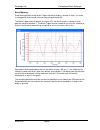
Racelogic ltd performancetools software 02/05/2014 page 45 the example on the right shows the lateral acceleration channel with a smoothing level of 2. This example shows the lateral acceleration channel with a smoothing level of 25 – note how the individual peaks and troughs are no longer present, ...
Page 46
Racelogic ltd performancetools software 02/05/2014 page 46 axis displays the axis with which the channel is associated. To change the associated axis, click the mouse in the right hand end of the axis box once the channel has been made visible. A common application for this is to display both the lo...
Page 47
Racelogic ltd performancetools software 02/05/2014 page 47 column descriptions: visible each tick box in this column switches an individual axis on or off in the graph window . Axis title shows the title of each available axis. The axis title is edited by clicking on the box and entering a new name....
Page 48
Racelogic ltd performancetools software 02/05/2014 page 48 analysing your data in performancetools performancebox tools has three main features which will allow you gather results from data you have logged. Many of these results are available to view on the performancebox itself, but the software al...
Page 49
Racelogic ltd performancetools software 02/05/2014 page 49 start / finish lines and splits before you can carry out any lap time analysis you must set a start / finish line in the file you have loaded. The information pertaining to these points can be saved to start / finish files for later use with...
Page 50
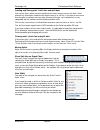
Racelogic ltd performancetools software 02/05/2014 page 50 loading and saving start / finish line and split data click on the ‘save’ option from the start/finish drop down menu to save to the start / finish and split line information created in the graph screen to a ‘.Dsf’ file. If you want to save ...
Page 51
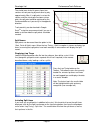
Racelogic ltd performancetools software 02/05/2014 page 51 the circled area circled in green shows two sections of track passing by each other by only approximately 20m. If a split point is set on this section, and the virtual gate has been set too wide, the split point could be registered by the pe...
Page 52
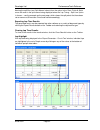
Racelogic ltd performancetools software 02/05/2014 page 52 naming the split files (see ‘split names’ above) from the option in the ‘start, finish & splits’ menu will result in the split names being displayed when the ‘lap timing – split line’ option is chosen – see the example on the next page, whic...
Page 53
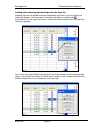
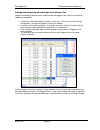
Racelogic ltd performancetools software 02/05/2014 page 53 loading and comparing individual laps from the same file individual laps from the loaded file can be compared to each other in the main graph and graph:map windows. Each lap shown in the lap timing table has a graph icon associated with it i...
Page 54
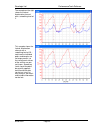
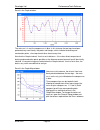
Racelogic ltd performancetools software 02/05/2014 page 54 result in the graph window: the main run is in red, the compare run in blue. In this instance the two laps have been performed very consistently: the peaks and troughs, which indicate the braking and acceleration points, sit on top of each o...
Page 55
Racelogic ltd performancetools software 02/05/2014 page 55 loading and comparing individual laps from different files lap data created by individual users, and therefore not logged in one .Dbn file, can also be loaded and compared: load the first file containing the lap data, set the start / finish ...
Page 56
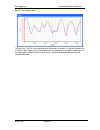
Racelogic ltd performancetools software 02/05/2014 page 56 result in the graph window: the main run (1:30.70 – the fastest lap from the previous example) is in red, the compare run (1:26.10) in blue. Note in this instance how there are differences in the peaks and troughs of the speed plots, indicat...
Page 57
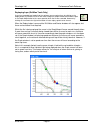
Racelogic ltd performancetools software 02/05/2014 page 57 replaying laps (driftbox tools only) if you have recorded laps loaded into the software you can replay them, by clicking on the replay button. By default the cursor will move through the graph window and round the path in the graph:map windo...
Page 58
Racelogic ltd performancetools software 02/05/2014 page 58 set position cursor type the cursors themselves are configurable: right click on any of the main windows (graph, data or map) to bring up the context menu (or click on the graph setup button on the toolbar.) select ‘set position cursor type’...
Page 59
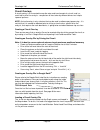
Racelogic ltd performancetools software 02/05/2014 page 59 circuit overlays a circuit overlay is a file created to map the outer and inner bounds of a circuit, and is a useful aid in drive-line analysis - comparison of lines taken by different drivers can help to improve lap times. Note: a circuit o...
Page 60
Racelogic ltd performancetools software 02/05/2014 page 60 if you want to load a .Cir file into performancebox tools on its own, click load all and then type *.* in the file name field: you can then select the .Cir file and it will load like a normal .Dbn file. A library of circuit overlay files is ...
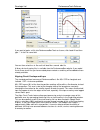
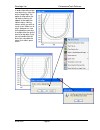
Page 61
Racelogic ltd performancetools software 02/05/2014 page 61 in order to be able to view truer drive lines, right-click on the graph map - the option to align either the lap data or overlay will appear at the top of the context menu. Having chosen which you wish to move in the “select run to align” di...
Page 62
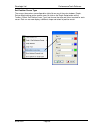
Racelogic ltd performancetools software 02/05/2014 page 62 importing a background image in to the graph map you can import any image of your choosing into the graph map by right-clicking on either the graph:data, graph:map, or graph windows and selecting the graph: map background image>load option: ...
Page 63
Racelogic ltd performancetools software 02/05/2014 page 63 performance results acceleration and deceleration results can be easily extracted from your logged data by using the various performance results tools. These are available by clicking on t he ‘accel results’ and ‘decel results’ buttons on th...
Page 64
Racelogic ltd performancetools software 02/05/2014 page 64 creating a custom acceleration test 1. Click on the custom option in the accel test drop down list. This will then open the following window: 2. Enter the speed of the start condition. 3. Set the end condition option, speed or distance. 4. E...
Page 65
Racelogic ltd performancetools software 02/05/2014 page 65 additional data analysis features the software has additional features to aid in data analysis, explained in this section. Many of these features can be used as a part of the analysis whilst producing performance results. The g-circle pressi...
Page 66
Racelogic ltd performancetools software 02/05/2014 page 66 graph measure tool this tool can be used to highlight a section of data in the graph window and produce a table that summarises the data captured in the window: hold shift down whilst clicking and dragging to use the measure tool the area of...
Page 67
Racelogic ltd performancetools software 02/05/2014 page 67 event marking event marking allows for the brake trigger channel to display a change in state – an ‘event’ in a logged file which can be useful for measuring distances etc. The brake trigger channel defaults to a value of 0, until the an eve...
Page 68
Racelogic ltd performancetools software 02/05/2014 page 68 tools clicking on the ‘tools’ icon on the toolbar will reveal a drop-down list containing a number of useful features, such as file repair and the exporting data to mapping software facility. Arrange windows the use of different screen resol...
Page 69
Racelogic ltd performancetools software 02/05/2014 page 69 importing the mapping file into autoroute or streets & trips open autoroute or street & trips. Click on ‘data’ and then select ‘import data wizard’. When prompted, browse for the ‘.Txt’ file you have just created with performancebox tools an...
Page 70
Racelogic ltd performancetools software 02/05/2014 page 70 radius of turn set-up click this option to open the radius of turn setup window, in which the smoothing level and maximum radius value can be set. When smoothing is applied to data, the value of an individual sample point is affected by samp...
Page 71: Firmware Upgrades
Racelogic ltd firmware upgrades 02/05/2014 page 71 firmware upgrades firmware refers to the operating software inside performancebox. The firmware is responsible for all of the functions within performancebox and from time to time, firmware updates will be released by racelogic to improve or enhance...
Page 72: Specification
Racelogic ltd specification and contact 02/05/2014 page 72 specification gps velocity distance accuracy 0.2 km/h accuracy 0.05% ( units km/h or mph units metres / feet update rate 10 hz update rate 10 hz maximum velocity 1000 mph resolution 1 cm minimum velocity 0.1 km/h height accuracy 10 metres 95...

