- DL manuals
- Velodyne
- Accessories
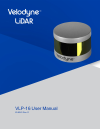
- VLP-16
- User Manual
Velodyne VLP-16 User Manual - Chapter 1 •
Chapter 1 •
About This Manual
1.1 Manual Scope
This manual provides descriptions and procedures supporting the installation, verification, operation, and diagnostic eval-
uation of the VLP-16, Puck LITE and Puck Hi-Res sensors.
For readability, all products in the VLP-16 LiDAR sensor family are referred to as “VLP-16” in this manual, except
where noted.
1.2 Prerequisite Knowledge
This manual is written with the premise that the user has some basic engineering experience and general understanding
of LiDAR technology. In addition, some familiarity with the configuration and operation of networking applications and
equipment is recommended.
It is recommended that prior to installation or other procedures covered in this manual, the user fully reads and com-
prehends all information within this manual.
1.3 Audience
The user mentioned occasionally in this document is typically an engineer tasked with sensor integration for a project, a
tech tasked with sensor upkeep, or data scientist looking to understand sensor output data.
1.4 Document Conventions
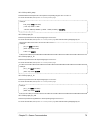
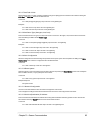
This document uses the following typographic conventions:
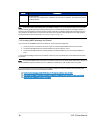
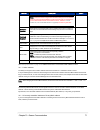
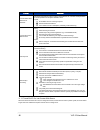
Convention
Description
Bold
Indicates text on a window, other than the window title, including menus, menu options, buttons,
fields, and labels. Example: Click OK.
Italic
Indicates a variable, which is a placeholder for actual text provided by the user or system. Example:
copy
source-file target-file Note: Angled brackets (< >) are also used to indicate variables.
screen/code
Indicates text that is displayed on screen or entered by the user. Example:
# pairdisplay -g oradb
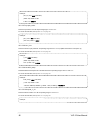
[ ] square
brackets
Indicates optional values. Example: [ a | b ] indicates that you can choose a, b, or nothing.
{ } braces
Indicates required or expected values. Example: { a | b } indicates that you must choose either a or
b.
| vertical bar
Indicates that you have a choice between two or more options or arguments. Examples: [ a | b ]
indicates that you can choose a, b, or nothing. { a | b } indicates that you must choose either a or b.
Table 1-1 Document Conventions
16
VLP-16 User Manual
Summary of VLP-16
Page 1
Vlp-16 user manual 63-9243 rev. D.
Page 2
Copyright 2018 velodyne lidar, inc. All rights reserved. Trademarks velodyne™, hdl-32e™, hdl-64e™, vlp-16™, vlp-32™, puck™, puck lite™, puck hi-res™, and ultra puck™ are trade- marks of velodyne lidar, inc. All other trademarks, service marks, and company names in this document or website are proper...
Page 3
Revision history sensor firmware release date release notes vlp-16 3.0.37.0 2017-12-12 • changed: phase lock offset setting now expects integer degrees instead of hundredths of degrees. • improved: removed 'update calibration' from system tab. • improved: sun noise filter. • added: ability to change...
Page 4
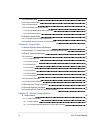
Table of contents chapter 1 • about this manual 1.1 manual scope 16 1.2 prerequisite knowledge 16 1.3 audience 16 1.4 document conventions 16 chapter 2 • vlp-16 overview 2.1 overview 18 2.2 product models 19 2.3 time of flight 19 2.4 data interpretation requirements 19 chapter 3 • safety precautions...
Page 5
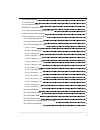
5.4 connections 30 5.4.1 integrated cable and interface box 31 5.4.2 operation without an interface box 31 5.4.3 power 31 chapter 6 • key features 6.1 calibrated reflectivity 32 6.2 laser return modes 32 6.2.1 single return modes: strongest, last 32 6.2.2 multiple returns 33 6.2.3 dual return mode 3...
Page 6
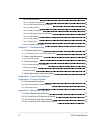
8.2.1 data packet rate 49 8.2.2 position packet rate 50 8.2.3 total packet rate 50 8.2.4 laser measurements per second 50 8.2.4.1 single return mode (strongest, last) 50 8.2.4.2 dual return mode 50 8.3 rotation speed (rpm) 50 8.3.1 horizontal angular (azimuth) resolution 50 8.3.2 rotation speed fluc...
Page 7
10.1.2 system screen 72 10.1.3 info screen 73 10.1.4 diagnostics screen 75 10.2 sensor control with curl 76 10.2.1 using curl with velodyne lidar sensors 76 10.2.2 curl command parameters 76 10.2.3 command line curl examples 77 10.2.3.1 get diagnostic data 77 10.2.3.2 conversion formulas 78 10.2.3.3...
Page 8
10.2.3.10 reset system 83 10.2.3.11 network configuration 83 10.2.3.12 set host (destination) ip address 83 10.2.3.13 set data port 84 10.2.3.14 set telemetry port 84 10.2.3.15 set network (sensor) ip address 84 10.2.3.16 set netmask 84 10.2.3.17 set gateway 84 10.2.3.18 set dhcp 84 10.2.4 curl exam...
Page 9
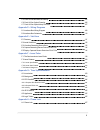
C.5 puck hi-res mechanical drawing 105 c.6 puck hi-res optical drawing 106 c.7 puck hi-res optical keep out zone 107 appendix d • wiring diagrams d.1 interface box wiring diagram 109 d.2 interface box schematic 110 appendix e • veloview e.1 features 111 e.2 install veloview 112 e.3 visualize streami...
Page 10
H.1.1 setting the phase lock 127 h.1.2 application scenarios 128 h.2 field of view 130 appendix i • sensor care i.1 cleaning the sensor 131 i.1.1 required materials 131 i.1.2 determine method of cleaning 132 i.1.3 method one 132 i.1.4 method two 132 i.1.5 method three 132 i.1.6 method four 133 appen...
Page 11
List of tables table 1-1 document conventions 16 table 2-1 3d sensing system components 19 table 7-1 interface box signals 40 table 7-2 pre-nmea version 2.3 message format 47 table 7-3 post-nmea version 2.3 message format 47 table 8-1 rotation speed vs resolution 51 table 9-1 vertical angles (ω) by ...
Page 12
List of figures figure 2-1 example 3d sensing system 18 figure 3-1 class 1 laser 21 figure 4-1 sensor network settings 24 figure 4-2 interface box (power and data connections) 25 figure 4-3 sample web interface main configuration screen 26 figure 4-4 veloview open sensor stream 27 figure 4-5 velovie...
Page 13
Figure 9-9 single return mode timing offsets (in µs) 64 figure 9-10 dual return mode timing offsets (in µs) 65 figure 10-1 vlp-16 configuration screen 69 figure 10-2 vlp-16 system screen 72 figure 10-3 vlp-16 info screen 73 figure 10-4 vlp-16 diagnostics screen 75 figure b-1 velodyne downloads page ...
Page 14
Figure g-1 web interface pps and gps qualifier option selections 123 figure g-2 top of hour counters 124 figure g-3 sub-second counter behavior 125 figure g-4 minutes and seconds counter behavior 126 figure h-1 direction of laser firing 127 figure h-2 configuration screen - phase lock 128 figure h-3...
Page 15
List of equations equation 8-1 azimuth resolution at 600 rpm 50 equation 10-1 standard voltage conversion 78 equation 10-2 standard current conversion 78 equation 10-3 standard temperature conversion 78 equation f-1 gap between scan lines 121 equation h-1 arc of shadow 130 15.
Page 16: Chapter 1 •
Chapter 1 • about this manual 1.1 manual scope this manual provides descriptions and procedures supporting the installation, verification, operation, and diagnostic eval- uation of the vlp-16, puck lite and puck hi-res sensors. For readability, all products in the vlp-16 lidar sensor family are refe...
Page 17
Note: notes such as this indicate important information. They call attention to an operating procedure or practice which may enhance user interaction with the product. Notes may also be used to prevent information loss or product damage. Chapter 1 • about this manual 17.
Page 18: Chapter 2 •
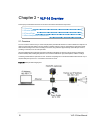
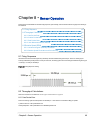
Chapter 2 • vlp-16 overview this chapter provides basic information on the sensor's hardware and software components. 2.1 overview 18 2.2 product models 19 2.3 time of flight 19 2.4 data interpretation requirements 19 2.1 overview the vlp-16 sensor uses an array of 16 infra-red (ir) lasers paired wi...
Page 19
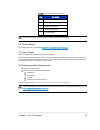
Item description 1 desktop/laptop computer 2 ins/gps antenna/interface (optional) 3 velodyne interface box 4 velodyne lidar sensor 5 dc power supply table 2-1 3d sensing system components note: optional - not included unless ordered: garmin gps receiver (p/n: 80-gps18lvc). 2.2 product models for ord...
Page 20: Chapter 3 •
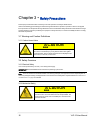
Chapter 3 • safety precautions this chapter provides information necessary for the safe operation of velodyne lidar sensors. Observe the following general safety precautions during all lidar sensor phases of operation. Failure to comply with these precautions or with specific warnings elsewhere in t...
Page 21
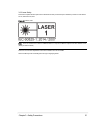
3.2.3 laser safety this device complies with fda performance standards for laser products except for deviations pursuant to laser notice no. 50, dated june 24, 2007. Figure 3-1 class 1 laser note: the vlp-16 sensor is a class 1 laser product. The product fulfills the requirements of iec 60825-1:2014...
Page 22: Chapter 4 •
Chapter 4 • unboxing & verification this chapter provides the procedure to test and verify that your sensor is operating properly. Do this to check out a new sensor before permanently mounting it somewhere. 4.1 what’s in the box? 22 4.1.1 variants 22 4.2 verification procedure 22 4.2.1 network setup...
Page 23
Note: due to the large volume of data produced by the sensor when scanning, users are cautioned against connecting it to a corporate network. 1. Unpack the sensor and its accessories, and place them on a workbench or desk. Ensure the sensor is upright with clear space around it. 2. Create a simple n...
Page 24
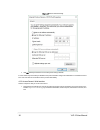
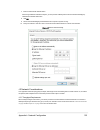
Figure 4-1 sensor network settings 7. Click ok. Gateway and dns are not necessary when testing in isolation. In some cases it may be necessary to disable the computer’s firewall or configure it to allow udp i/o on that ethernet inter- face. How to do this is not covered here as the process varies wi...
Page 25
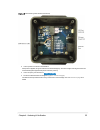
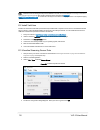
Figure 4-2 interface box (power and data connections) 2. Connect power to the sensor’s interface box. When power is applied, two green leds in the interface box light up. The sensor begins scanning its environment and transmitting data approximately 30 seconds after power up. 3. On the computer, poi...
Page 26
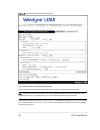
Figure 4-3 sample web interface main configuration screen 4.2.3 visualize live sensor data with veloview now that the computer can access the sensor’s web interface, it’s time to get a first look at the sensor’s data. Note: veloview is an open source visualization and recording application tailored ...
Page 27
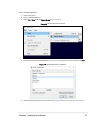
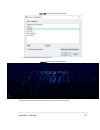
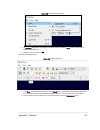
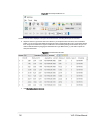
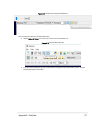
4.2.3.1 veloview operation 1. Power-up the sensor. 2. Start the veloview application. 3. Click on file->open and select sensor stream ( figure 4-4 below ). Figure 4-4 veloview open sensor stream 4. The sensor configuration dialog will appear ( figure 4-5 below ). Select the correct sensor type then ...
Page 28
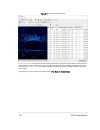
Figure 4-6 veloview sensor stream display above is an example of a veloview screen in an office, workbench or lab scenario. 28 vlp-16 user manual.
Page 29: Chapter 5 •
Chapter 5 • installation & integration this chapter provides important information for integrating the vlp-16 sensor into your application environment. 5.1 overview 29 5.2 mounting 29 5.3 encapsulation, solar hats, and ventilation 30 5.4 connections 30 5.4.1 integrated cable and interface box 31 5.4...
Page 30
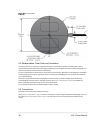
Figure 5-1 mounting details 5.3 encapsulation, solar hats, and ventilation for various reasons, you may wish to encapsulate the sensor, either wholly or partially. The working field of view, if covered with transparent material, should be highly transmissive of near-ir light at and near the 903 nm w...
Page 31
Note: do not twist or otherwise adjust the strain relief gland nut where the interface cable enters the sensor. Adjusting the position of the gland nut may damage the vlp-16 sensor internally. 5.4.1 integrated cable and interface box the standard vlp-16 sensor comes with an integrated cable that is ...
Page 32: Chapter 6 •
Chapter 6 • key features 6.1 calibrated reflectivity 32 6.2 laser return modes 32 6.2.1 single return modes: strongest, last 32 6.2.2 multiple returns 33 6.2.3 dual return mode 33 6.3 phase locking multiple sensors 37 6.1 calibrated reflectivity the vlp-16 measures reflectivity of an object independ...
Page 33
Figure 6-1 a single return 6.2.2 multiple returns multiple laser returns are possible from any single laser shot because of beam divergence. When a laser pulse leaves the sensor it slowly, gradually grows larger. A pulse can be big enough to hit multiple objects producing multiple reflections. Usual...
Page 34
Figure 6-2 dual return with last and strongest returns as shown in figure 6-3 on the facing page , in the event the strongest return is the last return, the second-strongest return is reported. The majority of the beam hits the far wall and is (in this case) the strongest return. It's entirely possi...
Page 35
Figure 6-3 dual return with second strongest return it's also possible that a small portion of the beam clips a retro-reflector and returns more energy than the majority of the beam, as in figure 6-4 on the next page . Chapter 6 • key features 35.
Page 36
Figure 6-4 dual return with far retro-reflector the dual return function is often used in forestry applications where measurement of the height of trees is desired. Figure 6-5 on the facing page indicates a sample response when the laser pulse initially hits the upper canopy, penetrates it, and even...
Page 37
Figure 6-5 forestry application multiple returns note: in dual return mode, the data rate of the sensor doubles. 6.3 phase locking multiple sensors when using multiple velodyne lidar sensors in proximity to one another, users may observe interference between them due to one sensor picking up a refle...
Page 38
Figure 6-6 phase locking example the red arrows shown in figure 6-6 above indicate the firing direction of the sensor's laser at the moment it receives the rising edge of the pps signal. Additional information for phase locking multiple sensors is located in phase lock on page 127 . 38 vlp-16 user m...
Page 39: Chapter 7 •
Chapter 7 • sensor inputs this chapter covers sensor input requirements and functionality, including power, pps, and ethernet. It also covers scen- arios for obtaining gps input. 7.1 power requirements 39 7.2 interface box signals 40 7.3 ethernet interface 41 7.4 gps, pulse per second (pps) and nmea...
Page 40
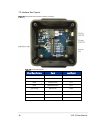
7.2 interface box signals figure 7-1 interface box (sensor power and data connections) signal specifications signal input/output black ground input red power input yellow gps sync pulse input white gps serial receive input light orange ethernet tx+ output orange ethernet tx- output light blue ethern...
Page 41
7.3 ethernet interface your sensor's primary interface is its ethernet interface. All command and control occurs over it, and all sensor data is transmitted over it. The rj45 ethernet connector on the interface box connects to any standard 100 mbps ethernet nic or switch with mdi or auto mdix capabi...
Page 42
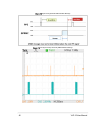
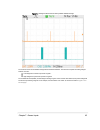
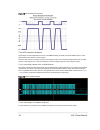
Figure 7-2 synchronizing pps with nmea gprmc message figure 7-3 pps signal closely followed by nmea gprmc message 42 vlp-16 user manual.
Page 43
Figure 7-4 pps signal followed 600 ms later by nmea gprmc message the serial connection for the nmea message follows the rs232 standard. The interface is capable of handling voltages between ±15 vdc. Low voltages are marks and represent a logical 1. High voltages are spaces and represent a logical 0...
Page 44
Figure 7-5 rs-232 example transmission 7.4.4 gps connection scenarios depending on the user’s application, the source of the nmea message (and pps) can be a gps/ins receiver or a sub- stitute device such as a laptop or microcomputer. There are three common connection scenarios: connecting to a senso...
Page 45
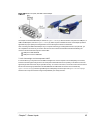
Figure 7-7 db9 pin-outs (dte) and usb-to-serial adapter an example of a standard db9 serial port is shown in figure 7-7 above (a). Because modern computers use usb ports, a usb to serial adapter, as shown in figure 7-7 above (b), will be required. The db9 connector on the adapter provides a signal w...
Page 46
Figure 7-8 signal directly from uart (incorrect polarity) figure 7-9 inverted signal from uart (correct polarity) 7.4.5 nmea message formats gpgga may be substituted in place of gprmc. The sensor accepts both pre- and post-nmea version 2.3 sentence structures. The difference is that in version 2.3 a...
Page 47
$gprmc,123519,a,4807.038,n,01131.000,e,022.4,084.4,230394,003.1,w*6a value description $gprmc recommended minimum sentence 123519 fix taken at 12:35:19 utc a receiver status: a = active, v = void 4807.038,n latitude 48 deg 07.038' n 01131.000,e longitude 11 deg 31.000' e 022.4 speed over the ground ...
Page 48
Value description a fix mode indicator: a = autonomous, d = differential, e = estimated, n = not valid, s = simulator. Sometimes there can be a null value as well. *6a * followed by 2-byte checksum note: the receiver status (aka validity) field in the gprmc message ('a' or 'v') should be checked to ...
Page 49: Chapter 8 •
Chapter 8 • sensor operation this chapter provides details on the laser firing sequence, point density, and how to determine throughput rate and angu- lar resolution. 8.1 firing sequence 49 8.2 throughput calculations 49 8.2.1 data packet rate 49 8.2.2 position packet rate 50 8.2.3 total packet rate...
Page 50
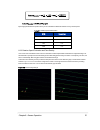
8.2.2 position packet rate position packets arrive at approximately 1/14th the rate of data packets. 554 bytes/packet * 753.5 packets/second / 14 = 29817 bytes/second 8.2.3 total packet rate summing yields 970185 bytes/second for single return mode. Dual return mode doubles the data rate but not the...
Page 51
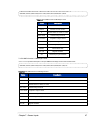
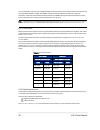
By changing the rpm in the equation above you can calculate the azimuthal resolution for any rotation speed. Rpm resolution 300 0.1° 600 0.2° 900 0.3° 1200 0.4° table 8-1 rotation speed vs resolution 8.3.2 rotation speed fluctuation and point density your sensor uses a feedback control function to m...
Page 52: Chapter 9 •
Chapter 9 • sensor data this chapter provides detailed information about sensor data characteristics. 9.1 sensor origin and frame of reference 52 9.2 calculating x,y,z coordinates from collected spherical data 52 9.3 packet types and definitions 54 9.3.1 definitions 54 9.3.2 data packet structure 56...
Page 53
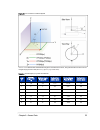
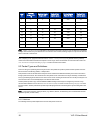
Figure 9-1 vlp-16 sensor coordinate system table 9-1 below lists the fixed vertical/elevation angles for each laser in the sensor, along with vertical corrections. The set of angles vary by sensor model (see factory bytes on page 56 for more). Laser id vertical angle vlp- 16 vertical angle puck lite...
Page 54
Laser id vertical angle vlp- 16 vertical angle puck lite vertical cor- rection (mm) vertical angle puck hi-res vertical cor- rection (mm) 7 7° 7° -5.1 4.67° -3.7 8 -7° -7° 5.1 -4.67° 3.7 9 9° 9° -6.6 6.00° -4.6 10 -5° -5° 3.7 -3.33° 2.7 11 11° 11° -8.1 7.33° -5.5 12 -3° -3° 2.2 -2.00° 1.8 13 13° 13°...
Page 55
9.3.1.1 firing sequence a firing sequence occurs when all the lasers in a sensor are fired. They are fired in a sequence specific to a given product line. Laser recharge time is included. A firing sequence is sometimes referred to as a firing group. It takes 55.296 μs to fire all 16 lasers in a vlp-...
Page 56
Utc synchronization requires a user-supplied gps/ins receiver generating a synchronizing pulse per second (pps) sig- nal and an nmea gprmc message. The gprmc message provides minutes and seconds in utc. Upon syn- chronization, the sensor reads the minutes and seconds from the gprmc message and uses ...
Page 57
The packet data structure for single return mode is shown in figure 9-2 below . The packet data structure for dual return mode is shown in figure 9-3 on the next page . There are several key differences between the packet structures. First, in dual return mode the sensor sends a pair of data blocks ...
Page 58
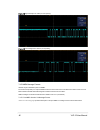
Figure 9-3 vlp-16 dual return mode data structure the figures below show a wireshark trace of a single packet in single return mode. Figure 9-4 on the facing page shows the beginning of the packet and figure 9-5 on the facing page shows packet end. The location/offset of the data relative to the ini...
Page 59
Figure 9-4 single return mode packet data trace (packet start) figure 9-5 single return mode packet data trace (ending) chapter 9 • sensor data 59.
Page 60
9.3.3 position packet structure the position packet provides an echo of the nmea sentence received from an external time source as well as the pulse per second status and a time stamp representing when the position packet was assembled. The position packet is a 554 byte udp packet received on port 8...
Page 61
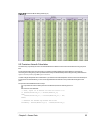
Figure 9-6 wireshark position packet trace legend: light blue: ethernet+ip+udp packet header (42 bytes) orange: timestamp (4 bytes) red: pps status (1 byte) green: nmea gprmc sentence (length varies) 9.4 discreet point timing calculation for the purpose of geo-referencing lidar data, it is helpful t...
Page 62
All sixteen lasers are fired and recharged every 55.296 μs. The cycle time between firings is 2.304 μs. There are 16 firings (16 × 2.304 μs) followed by a recharge period of 18.43 μs. Therefore, the timing cycle to fire and recharge all 16 lasers is given by (16 × 2.304 μs) + 18.43 μs = 55.296 μs. F...
Page 63
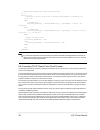
Timing_offsets = make_table(false) # false : single return mode print(''.Join([', '.Join(['{:8.3f}'.Format(value) for value in row]) for row in timing_offsets])) example: calculate the exact firing time of the last firing in a packet if the timestamp value is 45,231,878 µs. Timestamp = 45,231,878 ...
Page 64
Figure 9-9 single return mode timing offsets (in µs) 64 vlp-16 user manual.
Page 65
Figure 9-10 dual return mode timing offsets (in µs) 9.5 precision azimuth calculation the azimuth (α) reported by the sensor in each data block is the azimuth at the moment the first laser in a firing sequence fires. To get better precision when geo-referencing, it’s useful to precisely calculate th...
Page 66
// perform the interpolation using the timing firing k = 0; while (k // determine if you’re in the first or second firing sequence of the data block if (k then // interpolate precision_azimuth[k] := azimuth[datablock_n] + (azimuthgap * 2.304 μs * k) / 55.296 μs); else // interpolate precision_azimut...
Page 67
Slam is a technique used by robots to analyze and navigate their environment. Slam software automatically identifies sta- tionary objects in the lidar data. The algorithm then uses the location of the stationary objects to mathematically back-out the movement of the lidar and translate the data into...
Page 68: Chapter 10 •
Chapter 10 • sensor communication this section provides detailed information about sensor communication methods. 10.1 web interface 68 10.1.1 configuration screen 69 10.1.2 system screen 72 10.1.3 info screen 73 10.1.4 diagnostics screen 75 10.2 sensor control with curl 76 10.2.1 using curl with vel...
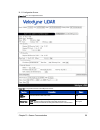
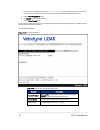
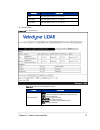
Page 69
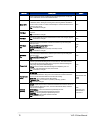
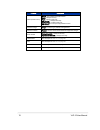
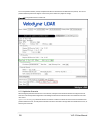
10.1.1 configuration screen figure 10-1 vlp-16 configuration screen function description default laser on/off turns the sensor's laser on or off. On return type strongest — sensor provides only the strongest detected return. Last — sensor provides only the last (temporally) detected return. Dual — s...
Page 70
Function description default the strongest, the sensor provides the second-strongest return. If only one return is detected, the two values will be identical. Motor rpm sets the sensor’s internal spin rate. Valid values include the range from 300 to 1200 rpm, and 0. Setting it to 0 during active sca...
Page 71
Function description default note: take care when turning dhcp on. Before doing so, ensure a dhcp server on the network is available to provide the sensor with an ip address. If you turn dhcp on and lose contact with the sensor, follow the turned dhcp on, lost contact with sensor on page 88 procedur...
Page 72
1. On the sensor's configuration screen, enter 00-00-00-00-00-00 in the mac address field. The '-' characters must be present and the six octet values must be expressed as two hexadecimal digits each, all zeroes. 2. Click the save configuration button. 3. Click system to view the system screen. 4. C...
Page 73
Function description pps see description in table 10-1 on page 69 . Motor state see description in table 10-1 on page 69 . Laser state see description in table 10-1 on page 69 . 10.1.3 info screen figure 10-3 vlp-16 info screen function description fpga (top board) board — top or bottom board inform...
Page 74
Function description fpga (bottom board) board — top or bottom board information. Mode – velodyne use only. Type — velodyne use only. Hw version — velodyne use only. Sopc sysid — velodyne use only. Sw version — current operating firmware version. Firmware image image — firmware type (failsafe and ap...
Page 75
10.1.4 diagnostics screen figure 10-4 vlp-16 diagnostics screen function description top board (scaled) hv — velodyne use only. A/d td — velodyne use only. Temp — circuit board temperature. 5v — internal voltage status. 2.5v — internal voltage status. 3.3v — internal voltage status. 5v (raw) — inter...
Page 76
Function description v in — internal voltage status. 1.25v — n/a. Gps position see description in table 10-1 on page 69 . Pps see description in table 10-1 on page 69 . Motor state see description in table 10-1 on page 69 . Laser state see description in table 10-1 on page 69 . 10.2 sensor control w...
Page 78
10.2.3.2 conversion formulas equation 10-1 standard voltage conversion equation 10-2 standard current conversion equation 10-3 standard temperature conversion 10.2.3.3 interpret diagnostic data use the formulas above to convert raw diagnostic data fields below to usable values. Some fields are scale...
Page 79
10.2.3.3.2 top:lm20_temp this field indicates the temperature of the top board. Its operating range is -25.0° c to 94.0° c. To convert the raw value, use equation 10-3 on the previous page . Example: lm20_temp = 1105 (raw value) (1105 * 5.0) / 4096 = 1.3489 -1481.96 + sqrt(2.1962e6 + ((1.8639 – 1.34...
Page 80
Example: pwr_5v_raw = 2263 (raw value) (2263 * 5.0) / 4096 = 2.762 2.762 * 2.0 = 5.525 v 10.2.3.3.7 top:pwr_vccint this is the top board's 1.2 v rail. Its operating range is 1.0 v to 1.4 v. To convert the raw value, use equation 10-1 on page 78 . Example: pwr_vccint = 977 (raw value) (977 * 5.0) / 4...
Page 81
Pwr_1_2v = 992 (raw value) (992 * 5.0) / 4096 = 1.211 v 10.2.3.3.11 bot:pwr_1_25v this is the bottom board's 1.25 v rail. Its operating range is 1.0 v to 1.4 v. To convert the raw value, use equation 10-1 on page 78 . Example: pwr_1_25v = 1 (raw value) (1 * 5.0) / 4096 = 0.001 v 10.2.3.3.12 bot:pwr_...
Page 82
To convert the raw value, use equation 10-1 on page 78 then scale the result by multiplying it by 11.0. Example: pwr_v_in = 910 (raw value) (910 * 5.0) / 4096 = 1.111 1.111 * 11.0 = 12.219 v 10.2.3.4 get snapshot downloads sensor snapshot data to an hdl file. This has the same effect as clicking on ...
Page 84
10.2.3.13 set data port this command sets the sensor’s data port (default: 2368). It has the same effect as setting the web interface’s data port field to the given number. Command: curl --data "dport=2368" http://192.168.1.201/cgi/setting/host 10.2.3.14 set telemetry port this command sets the sens...
Page 85
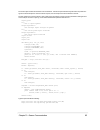
The sensor object contains the interface to the actual sensor. A buffer is required because pycurl does not provide stor- age for the network response. After each sensor request, the http response code is checked for success. The first operation is to reset the sensor. After a delay, the script chan...
Page 86
Http://192.168.1.201/cgi/setting laser=on: 204 (ok) sensor laser is on, motor rpm is 301 86 vlp-16 user manual.
Page 87: Chapter 11 •
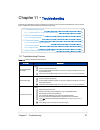
Chapter 11 • troubleshooting this section provides detail on how to troubleshoot your sensor, how to request technical assistance, how to have the sensor repaired, and how to replace the fuse in the interface box. 11.1 troubleshooting process 87 11.1.1 turned dhcp on, lost contact with sensor 88 11....
Page 88
Problem resolution can see data in wire- shark but not veloview wireshark sniffs packets promiscuously but veloview does not. Veloview needs permission to receive packets from the system firewall, if active. Check: no firewall is active on receiving computer. Sensor's destination address. Port numbe...
Page 89
Because no dhcp server is present, the sensor performs automatic private ip addressing (apipa) and self-assigns a class b ip address that looks like 169.254.X.X. Your computer's ip address will likely be very different (not on the same logical network) resulting in a failure to communicate with the ...
Page 90
1. Unplug/disconnect power from the interface box. 2. Remove the interface box cover with a small phillips screwdriver, retaining all four screws. 3. Carefully remove the fuse. 4. Replace it with an identical, fresh fuse. 5. Replace the interface box’s cover and restore power. 11.3 technical support...
Page 91: Appendix A •
Appendix a • sensor specifications sensor specifications (including environmental and regulatory specifications) have been moved to product data sheets found on the velodyne lidar web site at this address: http://www.Velodynelidar.Com/downloads.Html#datasheets . For additional information, contact v...
Page 92: Appendix B •
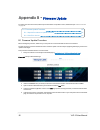
Appendix b • firmware update to update your sensor’s firmware, follow the procedure below. If a problem occurs, follow the steps in if an error occurs on page 99 . B.1 firmware update procedure 92 b.1.1 special procedure to update firmware 98 b.1.2 if an error occurs 99 b.1 firmware update procedure...
Page 93
Figure b-2 compare firmware versions note: the firmware image labeled “failsafe” is the original image programmed into the sensor when it was man- ufactured. It cannot be updated. 6. When updating vlp-16 firmware specifically from 3.0.29.X to 3.0.37.X, or downgrading it from 3.0.37.X to 3.0.29.X, a ...
Page 94
Figure b-3 select new firmware image 8. Click the system button. 9. Click the choose file button under update firmware. 10. Using the dialog, locate the new firmware file on your computer and select it. 11. Verify that the correct file for your sensor model has been selected. It must have the ‘.Flas...
Page 95
Figure b-4 upload new firmware image 13. As shown in the figure above, a progress bar indicating the percentage of update completion is displayed. 14. When this first stage of the update is complete, the firmware update complete screen (below) is displayed. But wait, there's more. Internally, you've...
Page 96
Figure b-5 firmware update complete page 15. Now click the process firmware update button to initiate the second stage of the procedure. The firmware image that you just uploaded is being prepared for use by the sensor. 16. A second progress bar is shown. Note: this step should take approximately 70...
Page 97
Figure b-6 finalize firmware update 17. When processing completes, press the reset system button to finalize the update. The sensor will perform a warm boot. 18. The configuration screen will be shown when the sensor finishes rebooting. 19. Return to the info page. Appendix b • firmware update 97.
Page 98
Figure b-7 verify firmware versions 20. Verify that the firmware application version (red box) matches the version of the firmware downloaded and installed. Also verify that the same version appears in the sw version column for both the top and bottom boards (green box). If everything matches, the p...
Page 99
From the normal procedure.* 7. Instead, reset the sensor, either by pressing the reset system button or cycling power to the sensor. 8. The sensor boots up. At this point, you do not have to run the update process for the bottom board again. Go to the system tab and click on the update button associ...
Page 100: Appendix C •
Appendix c • mechanical diagrams this appendix provides technical drawings and diagrams of mechanical assemblies. High resolution versions may be accessed on the velodyne lidar web site. C.1 interface box mechanical drawing 101 c.2 vlp-16 and puck lite mechanical drawing 102 c.3 vlp-16 and puck lite...
Page 101
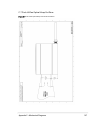
C.1 interface box mechanical drawing figure c-1 interface box mechanical drawing 50-6001 rev a appendix c • mechanical diagrams 101.
Page 102
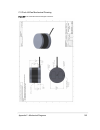
C.2 vlp-16 and puck lite mechanical drawing figure c-2 vlp-16 and puck lite mechanical drawing 86-0101 rev b1 102 vlp-16 user manual.
Page 103
C.3 vlp-16 and puck lite optical drawing figure c-3 vlp-16 and puck lite optical drawing 86-0101 rev b1 appendix c • mechanical diagrams 103.
Page 104
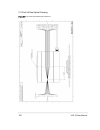
C.4 vlp-16 and puck lite optical keep out zone figure c-4 vlp-16 and puck lite optical keep out zone 86-0101 rev b1 104 vlp-16 user manual.
Page 105
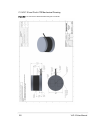
C.5 puck hi-res mechanical drawing figure c-5 puck hi-res mechanical drawing 86-0129 rev a appendix c • mechanical diagrams 105.
Page 106
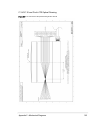
C.6 puck hi-res optical drawing figure c-6 puck hi-res optical drawing 86-0129 rev a 106 vlp-16 user manual.
Page 107
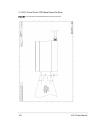
C.7 puck hi-res optical keep out zone figure c-7 puck hi-res optical keep out zone 86-0129 rev a appendix c • mechanical diagrams 107.
Page 108: Appendix D •
Appendix d • wiring diagrams this appendix provides technical wiring and schematic drawings and diagrams. High resolution versions may be accessed on the velodyne lidar web site. D.1 interface box wiring diagram 109 d.2 interface box schematic 110 108 vlp-16 user manual.
Page 109
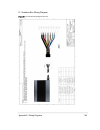
D.1 interface box wiring diagram figure d-1 interface box wiring diagram 86-0107a appendix d • wiring diagrams 109.
Page 110
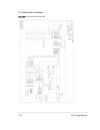
D.2 interface box schematic figure d-2 interface box schematic 69-8230a 110 vlp-16 user manual.
Page 111: Appendix E •
Appendix e • veloview this appendix gets you started with veloview. It shows you how to use the application to acquire, visualize, save, and replay sensor data. You can examine sensor data with other free tools, such as wireshark (available from wireshark.Org ) or tcpdump. But to visualize the 3d da...
Page 112
Note: veloview is not intended to generate point cloud files in las, xyz, or ply formats (see converting pcap files to point cloud formats on page 66 ). See the list of velodyne system integrators at http://velo- dynelidar.Com/integrators.Php for vendors who can sell you more advanced imaging softwa...
Page 113
Figure e-2 veloview select sensor calibration 5. Veloview begins displaying the sensor data stream. Figure e-3 veloview sensor stream display the stream can be paused by pressing the play button. Press it again to resume streaming. Appendix e • veloview 113.
Page 114
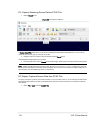
E.4 capture streaming sensor data to pcap file 1. Click the record button. Figure e-4 veloview record button a choose output file dialog will pop up with the file name field pre-loaded with something like 2016-12-22-16-25-50_ velodyne-vlp-16-data.Pcap. You may alter it if you like. 2. Navigate to wh...
Page 115
Figure e-5 veloview open capture file 2. An open file dialog will pop up. Navigate to a pcap file, select it, and click the open button. The sensor con- figuration dialog will pop-up. 3. Select your sensor type and click ok. Veloview should display frame 0. Figure e-6 veloview play button 4. Press p...
Page 116
Figure e-7 veloview spreadsheet tool a sidebar of tabular data is displayed to the right of the rendered frame, containing all data points in the frame. 6. Adjust the columns to get a better view of the numbers. If you’ve adjusted columns in excel, some of this will be familiar. You can change colum...
Page 117
Figure e-9 veloview show only selected elements since no points are selected yet, the table will be empty. 8. Click the select all points tool. This turns your mouse into a point selection tool. Figure e-10 veloview select all points 9. In the 3d rendered data pane use your mouse to draw a rectangle...
Page 118
Figure e-11 veloview list selected points in figure e-11 above , 14 data points were selected with a small selection rectangle. The points appear in pink. Their attrib- utes are listed on the right. In this example, most of their intensity values exceed 100, indicating something retro-reflective is ...
Page 119: Appendix F •
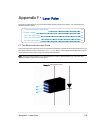
Appendix f • laser pulse this section provides details on your sensor’s laser diodes, the laser pulse and scan patterns, and certain beam char- acteristics of the laser pulses. F.1 the semiconductor laser diode 119 f.2 laser patterns 120 f.2.1 laser spot pattern 120 f.2.2 laser scan pattern 120 f.2....
Page 120
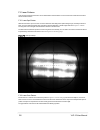
F.2 laser patterns laser firings produced by the sensor can be viewed with an infrared viewer or camera. Photos in this section were taken with an infrared camera. F.2.1 laser spot pattern while the terms laser “spot” and “dot” are often used when describing a laser pulse hitting a target, in realit...
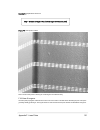
Page 121
Equation f-1 gap between scan lines figure f-3 laser spots on a wall photo of sensor laser pattern reflecting off of a flat target a short distance away. F.2.3 beam divergence as a laser pulse propagates outward from the sensor the cross-section of the laser beam describing the path of the pulse gra...
Page 122
Vlp-16 beam divergence on the horizontal axis (i.E. Along the direction of the laser scan) differs from beam divergence on the vertical axis (transverse to the scan) by roughly a factor of two. Horizontal beam divergence vertical beam divergence 3.0 mrad (0.18 deg) 1.5 mrad (0.09 deg) table f-1 vlp-...
Page 123: Appendix G •
Appendix g • time synchronization this section provides a detailed discussion of the gps qualifier and pps qualifier functions. These features were intro- duced with firmware release 3.0.34.0 (vlp-16). G.1 introduction 123 g.2 background 123 g.3 pps qualifier 124 g.3.1 require gps receiver valid 124...
Page 124
Figure g-2 top of hour counters the combined value represents the number of microseconds since the top of the hour. It ranges from 0 to 3,599,999,999 μs -- there are 3.6 × 10 9 μs in one hour. The sub-second counter range alone spans 0 to 999,999 μs. The sensor continuously monitors the pps input as...
Page 125
If require pps lock is set to on the sensor utilizes the value in the delay field to determine the validity of a pps signal prior to synchronizing its internal sub-second counter to the rising edge of a pps signal. If require pps lock is set to off the sensor ignores the value in the delay field and...
Page 126
Figure g-4 minutes and seconds counter behavior note: if no nmea sentence is provided, the minutes and seconds counter is driven by the rollover of the sub-seconds counter. 126 vlp-16 user manual.
Page 127: Appendix H •
Appendix h • phase lock when using multiple sensors close to one another (e.G. Mounted on top of a vehicle), occasional interference patterns may appear in the sensor data. Velodyne provides firing controls to minimize this interference by controlling where data is gathered. The sensors can then be ...
Page 128
The current phase lock status (on/off) and phase lock offset can be viewed on the web interface (red box). The current phase lock offset is presented in degrees. The accuracy of the offset is ±5° (subject to change). Figure h-2 configuration screen - phase lock h.1.2 application scenarios when setti...
Page 129
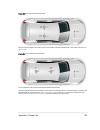
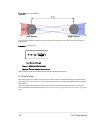
Figure h-3 right and left sensor phase offset when sensors are placed on the roof in the fore and aft positions, the phase offsets are set to 180° and 0° as shown in fig- ure h-4 below . Figure h-4 fore and aft sensor phase offset in both scenarios the two sensors create data shadows behind each oth...
Page 130
Figure h-5 sensor data shadows the angle subtended by the shadow of a sensor in range but at some distance from another sensor is given by the fol- lowing formula: equation h-1 arc of shadow data reported at the azimuths included within the subtended angle should be ignored. H.2 field of view altern...
Page 131: Appendix I •
Appendix i • sensor care to accurately sense its environment, the vlp-16 sensor should be kept clean, especially its ring lens. This section lists various approved cleaning methods, but it is important to use the correct method. Start with determine method of cleaning on the next page . I.1 cleaning...
Page 132
I.1.2 determine method of cleaning the first five characters of the sensor’s serial number represent the year (ae = 2015) and day of manufacture (031 = janu- ary 31st) of the device. If the first five characters of the serial number are between ae001 and ae229, clean the sensor using method 1 below....
Page 133
1. Spray nacl precision optics cleaner solution onto a clean, dry microfiber cloth. 2. Gently wipe the vlp-16’s ring lens along the curve of the sensor, not top-to-bottom. I.1.6 method four use a diluted mixture (50/50) of simple green and distilled water to remove particulates on the lens with a ri...
Page 134: Appendix J •
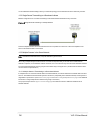
Appendix j • network configuration your sensor generates lots of data which it transmits via ethernet. This section covers various aspects of this interface and how to connect and configure it. It also touches on the situation where you have more than one sensor on the same net- work. J.1 ethernet a...
Page 135
7. Enter the subnet mask: 255.255.255.0 when using a windows os based computer, you can press the tab key and the subnet mask automatically pop- ulates with the 255.255.255.0 value. 8. Click ok. 9. We recommend disabling any firewall software the computer may have running. 10. Point your browser to ...
Page 136
You should assess network loading to see if your network’s topology can accommodate the sensor data rate you select. J.2.2 single sensor transmitting to a broadcast address below is a single sensor on a network transmitting to a broadcast address works without any contention. Figure j-2 single senso...
Page 137
Figure j-3 multiple sensors - improper network setup j.2.3.2 multiple sensors transmitting to a specific address the solution is to configure each sensor on such a network to transmit their data to a non-broadcast address. If every sensor in the same network transmits packets to a specific, non-broa...
Page 138
Corporate headquarters: velodyne lidar, inc. 5521 hellyer ave san jose, ca 95138 u.S.A. Www.Velodynelidar.Com phone +1 408-465-2800 fax +1 408-779-9227 email lidar@velodyne.Com vlp-16 user manual 63-9243 rev. D.

