- DL manuals
- ABB
- Server
- COM600F ANSI
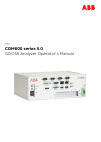
- Operator's Manual
ABB COM600F ANSI Operator's Manual - 2.3.
•
COM600F is a dedicated distribution automation controller unit that runs dis-
tributed grid and feeder applications for ANSI power networks and inherits all
core features of the COM600 series.
Overview of GOOSE Analyzer
2.3.
The GOOSE Analyzer functionality in COM600 can be used throughout the whole life
cycle of the IEC 61850 substation automation system. It supports the commissioning,
maintenance and upgrade phases of the IEC 61850 system by means of communication
diagnosis enabling features, communication status follow-up and storing of GOOSE
events for auditing purposes.
GOOSE Analyzer consists of a server and a WebHMI. The GOOSE Analyzer server
includes a real-time analysis engine to diagnose live GOOSE packets (messages) over
the connected subnetwork and output GOOSE events and GOOSE diagnostic events to
the historical database.
With the GOOSE Analyzer WebHMI, you can view the GOOSE connection diagram
with a real-time diagnosis and event list, query historical events, build GOOSE test cases,
view reports and plot specific network load trend graphs.
10
1MRS757546
COM600 series 5.0
GOOSE Analyzer Operator's Manual
Summary of COM600F ANSI
Page 1
— com600 series 5.0 goose analyzer operator's manual.
Page 3
Contents: 1. About this manual .................................................................................. 5 1.1. Copyrights ...................................................................................... 5 1.2. Trademarks ..................................................................
Page 4
5.3. Using historical events ................................................................ 25 6. Goose tester manager ....................................................................... 27 6.1. Using goose tester manager .................................................... 27 6.2. Creating an...
Page 5: About This Manual
About this manual 1. Copyrights 1.1. The information in this document is subject to change without notice and should not be construed as a commitment by abb oy. Abb oy assumes no responsibility for any errors that may appear in this document. In no event shall abb oy be liable for direct, indirect, ...
Page 6: Use Of Symbols
• lowercase letters are used for the name of a keyboard key that is not labeled on the keyboard. For example, the space bar, comma key, and so on. • press ctrl+c indicates that you must hold down the ctrl key while pressing the c key (to copy a selected object in this case). • press esc e c indicate...
Page 7: Terminology
The information icon alerts the reader to relevant facts and conditions. The tip icon indicates advice on, for example, how to design your project or how to use a certain function. Terminology 1.6. The following is a list of terms associated with com600 that you should be familiar with. The list con...
Page 8: Related Documents
Description abbreviation goose control block gocb generic object oriented substation event goose web human machine interface webhmi international electrotechnical commission iec intelligent electronic device ied network control center ncc substation configuration description scd substation configura...
Page 9: Introduction
Introduction 2. General information about the com600 series 2.1. The com600 product series are versatile substation management units that help realize smart substation and grid automation solutions in industrial and utility distribution net- works. They get deployed together with protection and cont...
Page 10: 2.3.
• com600f is a dedicated distribution automation controller unit that runs dis- tributed grid and feeder applications for ansi power networks and inherits all core features of the com600 series. Overview of goose analyzer 2.3. The goose analyzer functionality in com600 can be used throughout the who...
Page 11: 3.1.
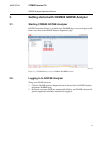
Getting started with com600 goose analyzer 3. Starting com600 goose analyzer 3.1. Goose connection viewer is available in the webhmi page, user can navigate to dif- ferent views here in the goose analyzer diagnostics page. Gathmi.Png figure 3.1-1 goose analyzer tab on com600 webhmi menu bar logging ...
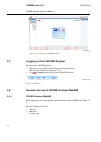
Page 12: 3.3.
Gatclickonce.Png figure 3.2-1 logging in to goose analyzer logging out from goose analyzer 3.3. To log out from goose analyzer: 1. Move the cursor to the top of the screen to show the title bar. The title bar is displayed (see figure 3.3-1). 2. Click or logout on the title bar to exit goose analyzer...
Page 13
Title bar 3.4.2. By default, the title bar is hidden in the main screen. To show the title bar, move the cursor to the top of the screen (see figure 3.3-1 and figure 3.3-1). • to exit goose analyzer, click or logout on the title bar. • to access general information about goose analyzer, click about ...
Page 14: Goose Connection Viewer
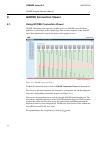
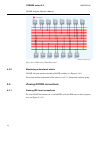
Goose connection viewer 4. Using goose connection viewer 4.1. Goose connection viewer presents graphical views of goose signal flow from publishers to subscribers on the content page. The real-time diagnosis of the goose signal flow dynamically controls the display of the graphical views. Gooseconne...
Page 15: Viewing Subnetworks
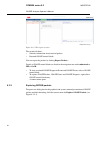
Viewing subnetworks 4.2. Viewing subnetwork level connections 4.2.1. To see goose connections for a chosen subnetwork, select the name of the subnetwork in the navigation tree. In figure 4.1-1, each goose publisher connects to a horizontal bar (later referred to as goose bus) with an outward arrow e...
Page 16
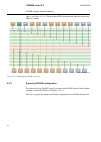
Colors (see figure 4.2.2-1). The publishing ied is differentiated from the subscribing ieds by coloring. Highlightconnection.Png figure 4.2.2-1 highlighting goose connection exploring goose configuration 4.2.3. To explore the sets of goose signals associated with goose control blocks, double- click ...
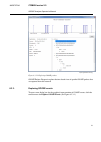
Page 17
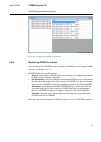
Exploringgooseconfiguration.Png figure 4.2.3-1 exploring goose configuration monitoring goose bus status 4.2.4. You can analyze the goose bus status and mark it with different colors using goose analyzer (see figure 4.2.4-1). Goose bus has four possible statuses: • normal: transmission of goose pack...
Page 18: Viewing Goose Connections
Goose_bus_diagnosis.Png figure 4.2.4-1 monitoring goose bus status monitoring subnetwork status 4.2.5. Goose analyzer monitors intruding goose conflicts (see figure 4.2.4-1). For a more detailed explanation of the statuses, see 9.2.1, subnetwork analyzer group. Viewing goose connections 4.3. Viewing...
Page 19: 4.4.
Goosedetail.Png figure 4.3.1-1 ied level goose connection view as shown in figure 4.3.1-1, the selected ied is positioned in the middle. The arrows on the left side of the selected ied indicate the subscribed goose signals from other publishers, and the arrows on the right side indicate its publishe...
Page 20: Exporting Views
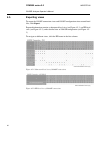
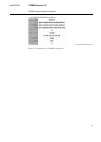
Exporting views 4.5. To export the goose connection views and goose configurations into external html files, click export. Exported information contains a subnetwork level view (see figure 4.5-1), an ied level view (see figure 4.5-2), and a detailed view of goose configuration (see figure 4.5- 3). T...
Page 21
Gooseconfigurationdetailedview.Png figure 4.5-3 detailed view of goose configuration 21 com600 series 5.0 1mrs757546 goose analyzer operator's manual.
Page 22: Monitoring Of Events
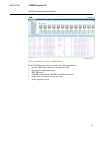
Monitoring of events 5. Monitoring events 5.1. Goose provides fast and reliable system-wide distribution of substation events over the switched networks. Goose analyzer enables you to monitor these substation events transmitted over the subnetwork. Goose analyzer monitors the transmission reliabilit...
Page 23
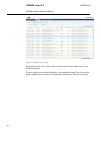
Realtimeevents.Png figure 5.2-2 real-time event list – goose events each goose diagnosis event record has the following properties: • detected time: date and time of a diagnostic event • subnetwork: subnetwork name • ied: ied name • goose control block: goose control block reference • object text: d...
Page 24
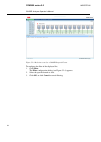
Realtimegatevents.Png figure 5.2-3 real-time event list – goose diagnosis events to configure the filter of the displayed list: 1. Click filter. The filter configuration dialog (see figure 5.2-4) appears. 2. Select the specific branch to view. 3. Click ok, or click cancel to cancel filtering. 24 1mr...
Page 25: Using Historical Events
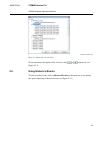
Realtimeeventlistfilter.Png figure 5.2-4 real-time event list filter to freeze/unfreeze the display of the event list, click or respectively (see figure 5.2-2). Using historical events 5.3. To view historical events, click on historical events on the menu bar. A new dialog box opens displaying all h...
Page 26
Gooseevents.Png figure 5.3-1 historical event list the historical event list is similar to the real-time event list but its data source is the historical database. To query specific events from the database, use conditional settings. You can reset the query conditions for new queries and export the ...
Page 27: Goose Tester Manager
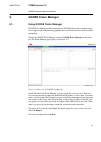
Goose tester manager 6. Using goose tester manager 6.1. Goose tester manager enables capturing raw goose packets and associated events into a single record, and presenting graphical and system-oriented views of the recorded information. To start the goose tester manager, click on goose tester manage...
Page 28: 6.2.
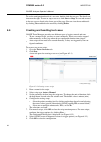
To see the configuration details of a test case, double-click the test case. The details are shown on the right. To start or stop a test case, click start or stop. Test records created in the test case are listed at the lower part of the page. You can view the record details by clicking view and del...
Page 29: Exploring Test Record
The newly created tester script is added to the test overview list (see figure 6.1- 1). Addnewtriggeroptions.Png figure 6.2-2 configuring trigger options for auto tester scripts handling tester scripts: • to view existing scripts in com600, click (refresh). • to activate the execution of a script, s...
Page 30
Testreportoverview.Png figure 6.3.1-1 test report overview the record tab shows: • statistics information about received packets • detected goose control blocks you can export the packets by clicking export packets.... Details of goose control blocks are listed in the navigation tree under subnetwor...
Page 31
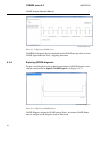
Exploringgoosepackets.Png figure 6.3.2-1 exploring goose packets goose packets diagnosis explore the time based view of specific goose packets that are captured from the network. Exploring goose events 6.3.3. To open a new dialog box for the graphical representation of goose events, click the contex...
Page 32
Exploringgooseevents.Png figure 6.3.3-1 exploring goose events goose event diagnosis discover and plot the trend of goose message values of certain goose signal within the tester’s triggering time frame. Exploring goose diagnosis 6.3.4. To open a new dialog box for the graphical representation of go...
Page 33: Network Statistics
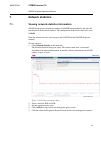
Network statistics 7. Viewing network statistics information 7.1. Goose analyzer can calculate the amount of goose load periodically and store the calculations in the historical database. The configuration of the statistic interval is set in sab600. From the network statistics you can query the goos...
Page 34
Diagnosticstatistictab.Png figure 7.1-2 diagnostic events statistic to view a statistic trend, click an entry in the network statistic tab to plot the correspond- ing trend. Graphpanel.Png figure 7.1-3 network statistic trend you can compare different trends on the plotting area by clicking a simila...
Page 35: Webhmi
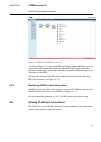
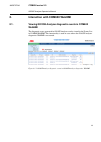
Interaction with com600 webhmi 8. Viewing goose analyzer diagnostic events in com600 webhmi 8.1. The diagnostic events generated in goose analyzer can be viewed in the events list in com600 webhmi. This functionality is used in cases where the goose analyzer diagnostics webhmi is not started. Gatfig...
Page 36
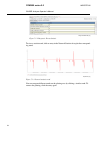
Gatfigure 1.1-2.Png figure 8.1-2 corresponding goose analyzer diagnostic events in com600 webhmi note that only diagnostic events can be viewed in com600 webhmi. These can be used to verify the health of goose. 36 1mrs757546 com600 series 5.0 goose analyzer operator's manual.
Page 37: Goose Analyzer Engine
Goose analyzer engine 9. Using goose analyzer engine 9.1. Goose analyzer engine provides means to verify and validate goose signals against goose configurations in the substation configuration description (scd). The engine continuously analyzes the decoded goose packets and monitors the availability...
Page 38: Ied Analyzers
For each interval, the analyzer sums up: • received network packets • received network bytes • received goose packets • received goose bytes • received goose events for users ied analyzers 9.3. Ied analyzer group 9.3.1. The ied analyzer group is designed to analyze ied wide goose with comparison to ...
Page 39: 9.4.
Goose control block analyzers 9.4. Goose control block analyzer group 9.4.1. This group is designed to analyze gocb wide goose with comparison to the corres- ponding configurations in the scd. The following analyzers belong to this group: • destination mac address analyzer • application identifier (...
Page 40
The reserved value range for goose type 1 is 0x0000 to 0x3fff. For goose type 1a (trip), the reserved value range is 0x8000 to 0xbfff. If no appid is configured, the default value is 0x0000. This default value indicates the lack of configuration. It is recommended to use a unique, source-orientated ...
Page 41
Vlan tag analyzer 9.4.6. Vlan tag analyzer allows users to check the existence of a vlan tag in the goose frames, in case a vlan tag is not supported and removed by ethernet switches. When a vlan tag is missing from the goose frames, the analyzer issues a specific event to warn users of the status t...
Page 42
The counter is incremented when the configuration changes. At configuration time, the configuration tool is responsible for incrementing/maintaining the confrev value. When configuration changes occur due to setgocbvalues, the ied is responsible for incre- menting the value of confrev. If the value ...
Page 43
Stnum and sqnum are integers ranging from 1 to 4 294 967 295. If counter sqnum overruns, it has to be set to 1. The disorder analyzer verifies stnum and sqnum contained in the received goose message (packet) for each goose control block. If counters for stnum and sqnum do not behave serially as stat...
Page 44
44.
Page 48
— abb oy medium voltage products p.O. Box 699 fi-65101 vaasa, finland tel. +358 10 22 11 fax. +358 10 224 1094 abb inc. Medium voltage products 655 century point lake mary, fl 32746, usa tel: +1 407 732 2000 fax: +1 407 732 2335 www.Abb.Com/medium-voltage 1mrs757546 d/24.5.2017 © copyright 2017 abb....

