- DL manuals
- Anritsu
- Tablet
- MT1000A
- Operation Manual
Anritsu MT1000A Operation Manual
MT1000A
MT1000A
MU100010A
MU100010A
Network Master Pro
Network Master Pro
Operation Manual
Operation Manual
13th Edition
13th Edition
For safety and warning information, please read this
For safety and warning information, please read this
manual
manual before attempting to use the equipment.
before attempting to use the equipment.
Keep this manual with the equipment.
Keep this manual with the equipment.
ANRITSU CORPORATION
ANRITSU CORPORATION
Document No. M-W3682AE-13.0
Summary of MT1000A
Page 1
Mt1000a mt1000a mu100010a mu100010a network master pro network master pro operation manual operation manual 13th edition 13th edition for safety and warning information, please read this for safety and warning information, please read this manual manual before attempting to use the equipment. Before...
Page 2
Mt1000a mu100010a network master pro operation manual 25 june 2014 (first edition) 21 october 2016 (13th edition) copyright © 2014-2016, anritsu corporation. All rights reserved. No part of this manual may be reproduced without the prior written permission of the publisher. The contents of this manu...
Page 3
About this manual about this manual the documentation for mt1000a network master pro applies to the instrument with the mu100010a 10gig multirate module installed. This operation manual describes both the basic operation of the instrument as well as the operations available via interface options and...
Page 4
4 4 11 11 12 12 13 13 13 13 14 14 14 14 14 14 15 16 16 16 16 18 19 20 20 20 20 21 21 23 23 23 25 25 26 26 26 26 28 28 28 29 29 29 30 30 30 31 31 31 32 32 32 32 36 36 37 37 37 38 41 41 42 42 43 43 43 45 45 46 46 46 46 48 50 50 table of contents table of contents 0 0 table of contents table of content...
Page 5
50 50 51 52 53 54 54 54 56 56 57 57 58 58 58 58 60 60 60 60 61 62 62 63 63 64 64 64 65 66 73 75 76 76 77 77 77 88 94 94 94 94 95 95 96 97 97 98 98 98 103 105 111 113 113 113 118 120 122 123 123 123 129 134 140 142 142 142 147 150 3.5.1 installation of control software 3.5.2 connection and setup 3.5....
Page 6
153 154 154 154 156 158 159 160 160 160 164 166 169 170 170 170 172 173 174 175 175 175 175 176 180 180 180 180 185 196 196 196 196 197 199 199 200 200 200 203 253 265 269 269 269 269 280 290 290 290 292 292 292 292 293 296 296 296 296 301 306 306 306 306 307 309 309 309 309 310 312 312 5.4.4 errors...
Page 7
312 313 314 315 315 315 315 326 331 333 333 333 333 338 343 343 343 343 352 356 356 356 356 357 359 359 361 361 364 371 371 372 372 372 386 391 397 401 401 401 401 402 405 405 405 405 409 414 414 414 414 415 417 417 418 418 419 420 421 424 426 426 426 426 429 433 433 433 433 433 6.8.1 ports setup an...
Page 8
435 435 436 436 437 437 440 442 444 444 444 444 449 454 454 454 454 455 459 459 460 460 460 462 464 464 464 464 467 467 468 468 468 468 469 470 472 472 473 473 474 474 474 475 475 476 476 477 477 477 478 481 482 483 483 483 483 484 484 484 485 485 485 497 507 512 513 515 515 517 517 518 518 518 9 9 ...
Page 9
518 518 520 520 521 521 522 522 522 522 523 523 523 523 523 524 524 524 524 524 525 525 525 525 526 526 526 527 527 531 531 533 533 533 533 533 534 535 536 536 536 536 537 537 537 538 539 540 540 540 540 541 541 542 542 542 543 543 543 543 543 544 544 544 544 544 545 12.1.2 cleaning 12.1.3 storage 1...
Page 10
Table of contents table of contents 10 10
Page 11
1 1 introduction introduction this chapter provides a general introduction to the mt1000a network master pro, and explains the symbols and conventions used in this manual. 11 11.
Page 12
1 1..1 1 mainframe mainframe the mt1000a network master pro (hereafter called the network master and sometimes the instrument ) is a battery-powered multipurpose telecommunications test instrument for field use. It is a tool for a wide range of applications from fast first-aid troubleshooting to com...
Page 13
1 1..2 2 10g multirate module 10g multirate module the 10g multirate module (mu100010a) allows the network master to test a large variety of interfaces and systems up to 10 gbps, like otn interfaces, ethernet interfaces, sdh/sonet interfaces, fibre channel interfaces and pdh/dsn interfaces. The mu10...
Page 14
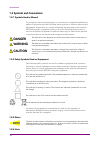
1 1..4 4 symbols and conventions symbols and conventions 1 1..4 4..1 1 symbols used in manual symbols used in manual to prevent the risk of personal injury or loss related to equipment malfunction, anritsu corporation uses the following safety symbols to indicate safety-related information. Ensure t...
Page 15
The hint symbol indicates information that should be treated as hints, suggestions, recommendations etc. Hint text is written in italics to separate the information from the other text elements on a page. 1 1..4 4..5 5 option option the option symbol indicates that the information described covers a...
Page 16
1 1..5 5 for safety for safety this section contains warnings which should be followed to avoid personal injury, product damage, as well as damage to the environment. 1 1..5 5..1 1 dangers dangers danger danger replacing battery replacing battery when replacing the battery, use the specified battery...
Page 17
Calibration calibration the performance-guarantee seal verifies the integrity of the equipment. To ensure the continued integrity of the equipment, only anritsu service personnel, or service personnel of an anritsu sales representative, should break this seal to repair or calibrate the equipment. Be...
Page 18
1 1..5 5..3 3 cautions cautions caution caution replacing memory replacing memory back-up battery back-up battery this equipment uses a poly-carbomonofluoride lithium battery to back up the memory. This battery must be replaced by service personnel when it has reached the end of its useful life; con...
Page 19
1 1..5 5..4 4 cautions against computer virus infection cautions against computer virus infection copying files and data copying files and data only files that have been provided directly from anritsu or generated using anritsu equipment should be copied to the instrument. All other required files s...
Page 20
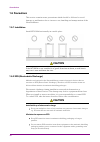
1 1..6 6 precautions precautions this section contains some precautions which should be followed to avoid damage or malfunction due to incorrect use, handling and transportation of the network master. 1 1..6 6..1 1 installation installation install mt1000a horizontally in a stable place. Caution cau...
Page 21
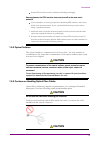
Return esd sensitive items to antistatic shielding packaging. Keep equipment, the esd sensitive items and yourself at the same static keep equipment, the esd sensitive items and yourself at the same static potential potential if your workplace is already prepared for handling esd sensitive items, th...
Page 22
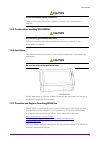
Do not excessively bend, fold, or pinch an optical fiber cable. Do not excessively bend, fold, or pinch an optical fiber cable. Doing so may break the optical fiber inside the cable. Keep the bend radius of an optical fiber cable at 30 mm or more. If the radius is less, optical fiber cable loss will...
Page 23
Caution caution do not disassemble optical connectors. Do not disassemble optical connectors. Doing so may cause rubidium oscillator to break or the performance to degrade. 1 1..6 6..5 5 caution when handling mu100090a caution when handling mu100090a caution caution be sure not to give vibration and...
Page 24
Introduction introduction 24 24.
Page 25
2 2 configuration configuration this chapter contains information about the included accessories as well as guidelines for connecting the mains adapter, for charging the battery, and for attaching the carrying strap. 25 25.
Page 26
2 2..1 1 delivered accessories delivered accessories the instrument is delivered in a shipment container together with various accessories depending on the order. When unpacking the first time, it is recommended to check these accessories against the list(s) below. 2 2..1 1..1 1 standard accessories...
Page 27
Mu100090a high performance gps disciplined oscillator b0691a hard case b0691b hard case b0720a rear cover b0729a screw 1u b0730a screw 2u b0731a screw 3u b0732a screw kit b0733a hard case g0306b video inspection probe g0324a battery charger g0325a gps receiver j1569a car 12 vdc adapter j1667a gpib-u...
Page 28
2 2..2 2 mains power adapter mains power adapter the network master can be powered from the supplied ac mains adapter. Caution caution always use ac mains adapter delivered from anritsu. Anritsu part no. G0309a. Always use ac mains adapter delivered from anritsu. Anritsu part no. G0309a. 2 2..2 2..1...
Page 29
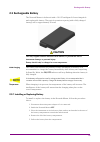
Initial charging initial charging temperature temperature 2 2..3 3 rechargeable battery rechargeable battery the network master is delivered with a 10.8 v intelligent li-ion rechargeable and replaceable battery. The typical operation capacity (with a fully charged battery) will be approximately 4 ho...
Page 30
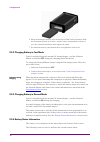
Indication during indication during charging charging 6. When installing the battery, note the direction of the battery terminals. With the instrument placed on its back - and the battery compartment in front of you - the terminals should be in the upper left corner. 7. Re-install the battery compar...
Page 31
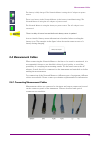
The battery is fully charged. The network master is using the ac adapter as power source. There is no battery in the network master (or the battery is malfunctioning). The network master is using the ac adapter as power source. The network master is using the battery as power source. The ac adapter ...
Page 32
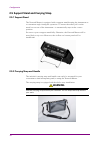
2 2..5 5 support stand and carrying strap support stand and carrying strap 2 2..5 5..1 1 support stand support stand the network master is equipped with a support stand keeping the instrument at a convenient angle during the operation. To extract the stand: pull out the metal bar on rear of the inst...
Page 33
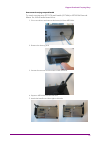
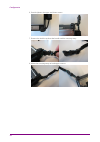
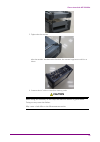
How to attach carrying strap and handle how to attach carrying strap and handle to attach carrying strap (z1747a) and handle (z1748a) to mt1000a network master pro, follow instructions below. 1. Use screw driver and remove the battery lid from mt1000a. 2. Remove the battery pack. 3. Loosen four scre...
Page 34
6. Detailed photos for upper and lower corner. 7. Remove the buckle cap from the handle and the carrying strap. 8. Mount the carrying strap on both upper corners. Configuration configuration 34 34.
Page 35
9. Attach mt1000a and mu100010a , insert the battery pack and mount the battery lid with the reverse sequence at the beginning. Support stand and carrying strap support stand and carrying strap 35 35.
Page 36
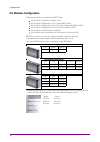
2 2..6 6 modules configuration modules configuration following modules are available for mt1000a. Mu100010a 10g multirate module (10g) mu100020a otdr module 1310/1550nm smf (otdr) mu100021a otdr module 1310/1550/850/1300nm smf/mmf (otdr) mu100022a otdr module 1310/1550/1625nm smf (otdr) mu100040a cp...
Page 37
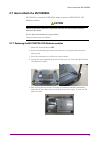
2 2..7 7 how to attach the mu100090a how to attach the mu100090a mu100090a is attached to mt1000a with rear panel or mu100010a 10g multirate module. Cation cation replacing modules operation should be done on the table where antistatic measures are taken. Do not drop the modules or give a shock. Doi...
Page 38
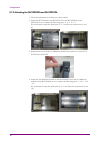
2 2..7 7..2 2 attaching the mu100090a and mu100010a attaching the mu100090a and mu100010a 1. Place the instrument on its front on a plain surface. 2. Attach the mu100090a to the mt1000a. Place the mu100090a on the mt1000a so as to connect the following pairs: 1 - 4, 2 - 5, 3 - 6. Be careful not to b...
Page 39
5. Tighten the four screws. After the module attachment has finished, the external appearance will be as below. 6. Connect the ac cable or install the battery packs. Caution caution when using mu100090a, do not drop the network master or give a shock. Doing so may cause the failure. May cause a bad ...
Page 40
Configuration configuration 40 40
Page 41
3 3 human-machine-interface human-machine-interface human-machine-interface (hmi) covers the relation between the user and the instrument - in other words: the information you get from the instrument combined with the action you add to the instrument. The informative part is the tft display, and the...
Page 42
3 3..1 1 touch screen display touch screen display the 9 inch active tft display with wvga resolution (800x480 pixels) is used for setups and for presentation of results (that is, for all interaction with the instrument). As the display includes touch screen functionality, it is possible to navigate...
Page 43
3 3..2 2 key operation key operation the only physical operator key (the power button) is described in this section. 3 3..2 2..1 1 power button power button the power button on the front panel of the instrument is used to switch power on and off. In addition, the menu used for power-off also contain...
Page 44
Ac operation ac operation after you shut the network master down, the network master goes back to stand by or charging state. The network master stays stand by or charging state until you disconnect the mains power adapter. Battery operation battery operation after you shut the network master down, ...
Page 45
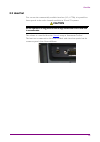
3 3..3 3 head set head set you can use the commercially available head set (3.5 φ ctia), it is possible to listen speech in the audio channels available in e1 and t1 systems. Caution caution do not operate for a long period of do not operate for a long period of time at high volume level or at a lev...
Page 46
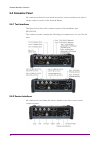
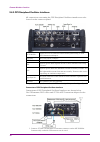
3 3..4 4 connector panel connector panel all connections (both for test interfaces and for service interfaces ) are placed on the connector panel of the network master. 3 3..4 4..1 1 test interfaces test interfaces the figure below shows the connector panel of the mainframe and mu100010a. The connec...
Page 47
Audio the audio connector is used for connecting to an optional head set. Aux the aux connector is used for optional g0325a gps receiver. Ext clock input the ext clock input connector is used for reference clock input. Usb b the three usb connectors (two connectors type a and one connector type b mi...
Page 48
3 3..4 4..3 3 gps disciplined oscillator interfaces gps disciplined oscillator interfaces all connections concerning the gps disciplined oscillator interfaces are also located on the connector panel: aux dsub9 connects to aux connector on mt1000a panel using j1705a aux conversion adaptor. 1pps out t...
Page 49
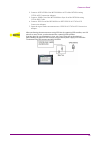
2. Connect aux dsub9 of the mu100090a to aux of the mt1000a using j1705a aux conversion adaptor. 3. Connect 10mhz out of the mu100090a to sync in of the mt1000a using j1710a bnc cable. 4. Connect 1pps out of the mu100090a to ref 1pps in of j1705a aux conversion adaptor. 5. Input the signal under mea...
Page 50
3 3..5 5 remote operation remote operation with the mx100001a mt1000a/mt1100a control software (hereafter, "control software") application installed, your pc is capable of supporting remote access to the network master. Control software simulates the panel operation of the network master, allowing y...
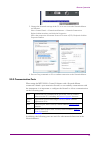
Page 51
5. Change the network settings of the pc, so it can access the network master via ethernet. Select control panel -> network and internet -> network connection. Right-click the interface and click the properties. Select the properties of internet protocol version 4 (tcp/ipv4) and click the properties...
Page 52
56001 (default) scpi server port, user configurable. Used by remote scpi clients. Refer to remote control section for details how to setup. 5900 (default) vnc (tcp), user configurable. Used by remote vnc clients. 5800 (default) vnc over http, user configurable. Used by remote vnc over http tunnel cl...
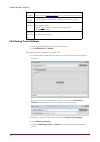
Page 53
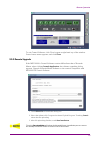
To exit control software, click close button at right hand top of the window. Power button menu appears, and click close close. 3 3..5 5..5 5 remote upgrade remote upgrade if the mx100001a control software version differs from that of network master, when clicking launch application launch applicati...
Page 54
3 3..5 5..6 6 remote wake up remote wake up if network master is in stand-by mode, it is possible to remotely get the unit into the operation state. 1. Click start start > all programs > anritsu > mx100001a folder. 2. Click mx100001a-v*.**-remote mx100001a-v*.**-remote. 3. On the control software st...
Page 55
3. Set configuration of network master by clicking options in select controller select controller, and add module(s) add module(s). To save the configuration, click save configuration save configuration. 4. Click ok ok. After a while, the gui of the selected network master configuration appears. 5. ...
Page 56
3 3..6 6 command-based remote control command-based remote control using command-based scripts makes the network master a fully automated measurement instrument. The network master remote control communication functions support the built-in ethernet service interface. Software specifications are in ...
Page 57
3 3..7 7 file access via usb interface file access via usb interface you can access the mass storage of the network master by connecting the usb cable. This function is useful to copy the files to pc, or confirm the test results. 1. Close all applications by touching close close icon on the applicat...
Page 58
3 3..8 8 file access via ethernet interface file access via ethernet interface 3 3..8 8..1 1 accessing files in network master from the pc accessing files in network master from the pc the mass storage of the network master can be shared with your pc via ethernet interface. 1. Connect an ethernet ne...
Page 59
4. Connect an ethernet network cable to the lan connector on your network master and link this to a local area network. 5. Assign an ip address to the network master. This is done in the ethernet ethernet available in the network screen as described in the graphical user interface chapter. 6. Select...
Page 60
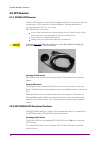
3 3..9 9 gps receiver gps receiver 3 3..9 9..1 1 g0325a gps receiver g0325a gps receiver g0325a gps receiver contains gps antenna and gps receiver and is used by connecting to aux connector of network master. The synchronization accuracy against utc is ±1 μs or less. The gps receiver is used for: pr...
Page 61
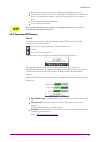
Warm up three hours or more after turning the mu100090a power on. Synchronize rubidium oscillator by capturing gps satellites for 30 minutes or more or by inputting the signal to 1pps sync in connector for 30 minutes or more. Keep ambient temperature constant. Avoid vibration and shock. After removi...
Page 62
3 3..10 10 remote control via gpib remote control via gpib using a j1667a gpib-usb converter, an optional accessory, allows users to control network master via gpib. Gpib address of network master can be set in the remote control . Command-based remote control is available via gpib control. Mx100001...
Page 63
4 4 graphical user interface graphical user interface this chapter provides a general introduction to the graphical user interface (gui). The descriptions of the screens, sub-screens and major dialog boxes related to specific technologies and applications are placed in separate chapters. 63 63.
Page 64
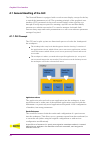
4 4..1 1 general handling of the gui general handling of the gui the network master is equipped with a touch screen display, except for the key to switch the instrument on/off. The operating principle of the graphical user interface (gui) presented on the touch screen display is that it guides you t...
Page 65
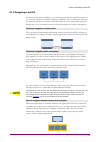
4 4..1 1..2 2 navigating in the gui navigating in the gui as shown in the previous figure, you can navigate from the application selector to a specific application in the workspace vertically. You can navigate between the application selector and the result file browser in the desktop horizontally. ...
Page 66
Startup splash screen startup splash screen status icons status icons from a setup screen you can return to the application selector using the tab at the top of the screen. Test result screens contain a tab at the top which returns you to the result file browser. 4 4..1 1..3 3 layout of the gui scre...
Page 67
Application selector application selector battery status refer to "battery status information" . Link status of ethernet service interface wlan (when the option is installed.) bluetooth (when the option is installed.) vnc (virtual network computing) controlled by the remote command connection status...
Page 68
A favorite application is basically an application with an associated set of port resources and specific settings. When launching a favorite application, the associated port resources are automatically allocated and the associated settings are subsequently loaded. Favorites require a specific number...
Page 69
Renaming favorites renaming favorites 1. Touch and hold an icon in favorites screen until a pop-up menu appears. 2. Touch rename favorite rename favorite. 3. Input a new name on the opening dialog box. Importing favorites importing favorites settings files (.Cfg) can be registered to favorites by us...
Page 70
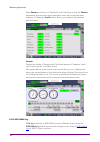
Result file browser result file browser applications switcher applications switcher the result file browser result file browser screen is the other entry point after startup of the network master. From here you can access the results of previous tests to view the statistics directly, to generate pdf...
Page 71
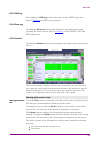
Ports setup screen ports setup screen the running applications appear in the applications switcher. Touching the button switches the application on the screen. 4 4..1 1..3 3..3 3 operating the application operating the application the ports setup ports setup screen is the first screen in the workspa...
Page 72
Test setup screen test setup screen test results screen test results screen the status area (to the right of the setup area) shows status information for the currently selected port and layer. You can access more detailed status information from here by touching the status summary boxes and buttons....
Page 73
In addition to the results, whose presentation varies from application to application, the test results test results screen also contains the application toolbar and the navigation tabs for horizontal and vertical navigation. 4 4..1 1..4 4 lamp indication of alarm/error status lamp indication of ala...
Page 74
4 4..1 1..4 4..1 1 test status summary test status summary in the status bar, an icon indicates the summarized test status of every running test application (not viewers or utilities). It is possible to show/hide the summarized test status, refer to miscellaneous in "instrument toolbar" section. The...
Page 75
4 4..1 1..5 5 keypads for entering text in fields keypads for entering text in fields alphanumerical or purely numerical keypads are used to enter text in fields. By touching the field you launch the related keypad. The layout (i.E. Type) of a specific keypad will depend on which type of text is req...
Page 76
4 4..1 1..6 6 user pattern editor user pattern editor the 32-bits and 2048-bits user patterns are specified using the pattern editor pattern editor. You can view the pattern in either hexadecimal, binary or ascii format and use either a numpad, an ascii table or a keyboard to set it up. You use the ...
Page 77
You can switch whether displaying the confirm dependencies dialog box. Refer to miscellaneous in "instrument toolbar" section. 4 4..2 2 toolbars toolbars two toolbars are available on the right-hand side of the screen: the desktop toolbar (called the instrument toolbar ) and the expandable workspace...
Page 78
The following information is presented on the screen: system information controller information module(s) information software information battery information self test results to save the instrument information in an html file, touch the save to file save to file button. This launches another dialo...
Page 79
General general configuration configuration the configuration icon launches the global configuration screen. From this screen, it is possible to configure both the general instrument settings (such as date/time, password etc.) and various network settings. The general general screen contains the fol...
Page 80
This icon indicates that the speaker is on. This icon indicates that the speaker is off. Auto save auto save allows you to specify saving method of the measurement results. Prompt prompt: confirms saving results or not after a test. On on: saves results to the file automatically without notification...
Page 81
Date/time date/time allows you to change the system date and time. Select a part in new time new time or new date new date field and touch the up/down button. If touching ok ok, the dialog box confirming the reboot appears. Touch yes yes. At the battery operation, network master does not reboot. Dat...
Page 82
Network network save the measurement results or settings of the running applications before executing the self test. Otherwise, the unsaved measurement data will be lost when network master reboots. When operating with the battery, network master does not reboot. Erase writable partitions erase writ...
Page 83
1. Touch the wlan wlan button. Wlan setup dialog box appears. 2. Touch the scan scan button. Scan results are displayed. 3. Select the network from scan results and touch the view view button. 4. Touch the add network add network button. Specify relevant items of network, touch the add add button. 5...
Page 84
Enable bluetooth enable bluetooth: enables using the bluetooth. Make visible make visible: allows to discover network master from other bluetooth devices. Share files using ftp share files using ftp: allows to share files stored in network master via bluetooth. Login account and password are not req...
Page 85
Ip address ip address: the ip address of the networked pc domain domain: the domain name of the networked pc user user: the username (account) of the networked pc password password: the password for account folder name folder name: the name of the shared folder on the networked pc after entering par...
Page 86
Appears on the remote control application screen only. Displays the local folder of the control pc. Appears on the remote control application screen only. Displays the folder of the network master. Sets the current folder to the home folder. Moves to the home folder. Creates a new folder. Edits the ...
Page 87
Moves to the help list topic. Back forward shows/hides the search box and buttons at bottom. Searches backward. Searches forward. When case sensitive case sensitive is selected, searches distinguishing the upper case and the lower case. Resource monitoring resource monitoring the resource monitoring...
Page 88
Each application is associated with up to two views, only one view can have control at a time. Having control gives user full access to all application functions, including modification of setting parameters, load and save functions, and running the test. Without control, users are only allowed to b...
Page 89
This icon appears in case of applications having traffic generation. Touch the traffic traffic start start icon to start sending traffic of all ports under test. The icon changes to the traffic stop traffic stop icon shown below. Traffic stop traffic stop this icon appears in case of applications ha...
Page 90
Moves to the topic when touching the help icon. Back forward shows/hides the search box and buttons at bottom. Searches backward. Searches forward. If case sensitive case sensitive is selected, searches distinguishing the upper case and the lower case. Report report touch this icon to create a repor...
Page 91
6. Select check boxes of items outputting to the report. Touching customize customize button launches the dialog box selecting items of statistics. 7. Touching generate generate button starts the report generation. Adobe® reader® is recommended as a pdf viewer to open or print out the report. "inclu...
Page 92
Touch this icon to close the application. Expanded application toolbar expanded application toolbar the application toolbar is expanded/collapsed by touching the tab placed above the left-most column. The column displayed in the expanded toolbar contains the following functions: restart testing rest...
Page 93
The setup options vary depending on the stimulus mode (i.E. The signal type). Common functions for all stimulus modes are the port selection and stimulus type drop-down menus. Touching the clear all stimuli clear all stimuli button clears/resets the current stimulus settings. In case of applications...
Page 94
4 4..3 3 startup and switch-off sequences startup and switch-off sequences this section describes what takes place when you switch the network master on and off as well as when you start up and close down an application. 4 4..3 3..1 1 instrument startup instrument startup when you switch on the inst...
Page 95
4 4..3 3..3 3 accessing previous tests and test results accessing previous tests and test results when you select test result files on the report file browser screen, you can choose to create either a report from the results or a workspace containing the test setup data and its results. Creating a w...
Page 96
4 4..3 3..5 5 switching off the instrument switching off the instrument when you press the power button on the instrument, the power-off menu is displayed. The menu contains the menu item shut down shut down, and when you select that, you are prompted to confirm that you really want to switch off th...
Page 97
5 5 sdh/sonet/pdh/dsn sdh/sonet/pdh/dsn applications applications this chapter describes the graphical user interface (i.E. Screens, sub-screens and major dialogs) related to sdh/sonet/pdh/dsn applications. Sub- screens and dialogs are described under the main screen from which they are activated/la...
Page 98
5 5..1 1 sdh setup and status sdh setup and status an stm-xx stm-xx button in the navigation area of the ports setup ports setup screen gives you access to the sdh setup for the transmitter and/or receiver of the currently selected port. Refer to sdh/sonet switching for switching to sdh. Synchronous...
Page 99
Clock configuration clock configuration transceiver transceiver use the transmitter transmitter drop-down menus to select to the transmitter. Mode mode use the mode mode drop-down menus to select to the behavior of the transmitter. Oh overwrite position oh overwrite position only enabled when the oh...
Page 100
Follows follows tcm tcm sdh/sonet sdh/sonet switching switching soh editor soh editor the general principle in setting up the sdh frame is to select the relevant values for the various containers in the multiplexing structure. This is done either via a drop-down menu or via a launched dialog box, by...
Page 101
Poh editor poh editor the setup principle is the same in this editor dialog as in the sdh structure. Touching a button or opening a drop-down menu will open for new editor dialog boxes, new value selections etc. S1 s1: synchronization status j0 j0: regenerator section trace idle char is an ascii cod...
Page 102
Bulk pattern bulk pattern j1 j1: path trace idle char is an ascii code used for the padding. B3 b3: path bip-8 this byte cannot be set. C2 c2: signal label g1 g1: (bit 1 to 4) rei (bit 5) rdi (bit 6 and 7) reserved (bit 8) spare f2,f3 f2,f3: path user channels h4 h4: multiframe indicator k3 k3: (bit...
Page 103
Receiver receiver user [32] bit user [32] bit, user [2048] bit user [2048] bit: 32 bits or 2048 bits length pattern. The field which shows bit length is enabled. Touch the field to launch the dialog box to define the bit pattern. Refer to the user pattern editor . Prbs9 prbs9 to prbs31 prbs31: pseud...
Page 104
Receiver gain receiver gain transceiver transceiver follows follows tcm tcm sdh/sonet sdh/sonet switching switching sfp/sfp+ sfp/sfp+: optical interface electrical electrical: electrical interface (bnc connector) only relevant for electrical receivers. Select the attenuation and impedance mode from ...
Page 105
Physical status physical status alarm/error status alarm/error status capture/monitor capture/monitor status status 5 5..1 1..3 3 status information status information this section describes the status information available for the sdh layer in the status area of the ports setup ports setup screen. ...
Page 106
The physical status information consists of the following parameters. When receiver is set to off, 'n/a's are displayed. Rx signal level rx signal level signal level (optical) shows the optical signal level in dbm. Signal level (electrical) shows the electrical signal level in db. 'nan' is displayed...
Page 107
This screen contains detailed alarm and error information related to the sdh interface. Status is indicated by the use of colored lamp icons . Alarms los los: loss of signal lof lof: loss of frame oof oof: out of frame ms-ais ms-ais: multiplex section alarm indication signal ms-rdi ms-rdi: multiplex...
Page 108
Refreshing refreshing information information displaying detailed displaying detailed information information tu-negative tu-negative: tributary unit negative stuffing 5 5..1 1..3 3..4 4 oh capture oh capture touching the oh capture oh capture button in the status area of the ports setup ports setup...
Page 109
Scanning scanning details details 5 5..1 1..3 3..5 5 tributary scan tributary scan touching the tributary scan tributary scan button in the status area of the ports setup ports setup screen displays the status shown below. This screen allows to measure the alarms and errors of all vc-containers in t...
Page 110
Module present module present transceiver transceiver information information power monitor power monitor 5 5..1 1..3 3..6 6 transceiver transceiver touching the transceiver transceiver button in the status area of the ports setup ports setup screen launches the dialog shown below. This dialog box p...
Page 111
Alarms/errors/ alarms/errors/ others others 5 5..1 1..4 4 errors/alarms insertion errors/alarms insertion this section describes the errors or alarms insertion for the sdh layer on the application toolbar . Select the port to insert errors, and the stimuli type. The settings items vary depending on ...
Page 112
5 5..1 1..4 4..2 2 sdh frequency sdh frequency touch the field to set frequency offset frequency offset. If setting a positive value, the frequency will shift higher side. Example: if setting -50 ppm to the frequency offset for stm-16 output signal, the bit rate of output signal will be 2 488 320 * ...
Page 113
5 5..2 2 sonet setup and status sonet setup and status an oc-xx/sts-xx oc-xx/sts-xx button in the navigation area of the ports setup ports setup screen gives you access to the sonet setup for the transmitter and/or receiver of the currently selected port. Refer to sdh/sonet switching for switching t...
Page 114
Clock configuration clock configuration transceiver transceiver use the transmitter transmitter drop-down menus to select to the transmitter. Mode mode use the mode mode drop-down menus to select to the behavior of the transmitter. Oh overwrite position oh overwrite position only enabled when the oh...
Page 115
Follows follows tcm tcm sdh/sonet sdh/sonet switching switching toh editor toh editor the general principle in setting up the sonet frame is to select the relevant values for the various containers in the multiplexing structure. This is done either via a drop-down menu or via a launched dialog box, ...
Page 116
Poh editor poh editor the setup principle is the same in this editor dialog box as in the sonet structure. Touching a button or opening a drop-down menu will open for new editor dialog boxes, new value selections etc. S1 s1: synchronization status j0 j0: regenerator section trace idle char is an asc...
Page 117
Bulk pattern bulk pattern j1 j1: path trace idle char is an ascii code used for the padding. B3 b3: path bip-8 this byte cannot be set. C2 c2: signal label g1 g1: (bit 1 to 4) rei (bit 5) rdi (bit 6 and 7) reserved (bit 8) spare f2,z3 f2,z3: path user channels h4 h4: multiframe indicator z4 z4: (bit...
Page 118
Receiver receiver user [32] bit user [32] bit, user [2048] bit user [2048] bit: 32 bits or 2048 bits length pattern. The field which shows bit length is enabled. Touch the field to launch the dialog box to define the bit pattern. Refer to the user pattern editor . Prbs9 prbs9 to prbs31 prbs31: pseud...
Page 119
Receiver gain receiver gain transceiver transceiver follows follows tcm tcm sdh/sonet sdh/sonet switching switching sfp/sfp+ sfp/sfp+: optical interface electrical electrical: electrical interface (bnc connector) only relevant for electrical receivers. Select the attenuation and impedance mode from ...
Page 120
Physical status physical status alarm/error status alarm/error status capture/monitor capture/monitor status status 5 5..2 2..3 3 status information status information this section describes the status information available for the sonet layer in the status area of the ports setup ports setup screen...
Page 121
This dialog box contains detailed alarm and error information related to the sonet interface. Status is indicated by the use of colored lamp icons . Alarms los los: loss of signal lof lof: loss of frame oof oof: out of frame ais-l ais-l: line alarm indication signal rdi-l rdi-l: line remote defect i...
Page 122
Rei-p rei-p : path remote error indication v5/b3 v5/b3: bip-2 of vt-2/vt-1.5 or bip-8 of low order vc-3 rei-v rei-v: vt-path remote error indication pattern errors pattern errors: bit error detected in the payload sts-ndf sts-ndf: path new data flag vt-ndf vt-ndf: vt-path new data flag switch switch...
Page 123
5 5..3 3 e1 setup and status e1 setup and status e1 represents the 2.048 mbit/s pdh layer. The ports setup ports setup screen gives you access to the pdh layer setup for the transmitter and/or receiver of the currently selected port. Plesiochronous digital hierarchy (pdh) refers to the technology or...
Page 124
Connector connector switching between pdh tx and dsn tx is done in the sdh/sonet transmitter setup screen. 1. Select sdh tx sdh tx or sonet tx sonet tx check box. 2. Touch stm-xx stm-xx, sts-xx sts-xx, or oc-xx oc-xx button in the navigation area. 3. Use drop down menu at right bottom to switch sdh ...
Page 125
Drop and insert drop and insert timing source timing source follows follows select the source for the transmitter. On on: transmits the received data which the data generated in the network master has added. Off off: transmits the data generated in the network master. Select the clock source. Intern...
Page 126
Pcm frame is formed by 16 e1 frames. Frame structure is shown below. Frame frame number number bits 1 to 8 of the frame (timeslot 0) bits 1 to 8 of the frame (timeslot 0) 1 1 2 2 3 3 4 4 5 5 6 6 7 7 8 8 0 0 c1 0 0 1 1 0 1 1 1 1 0 1 a sa sa sa sa sa 2 2 c2 0 0 1 1 0 1 1 3 3 0 1 a sa sa sa sa sa 4 4 c...
Page 127
In the sa-bits sa-bits dialog box, change the individual sa-bits by touching on the relevant bit keys - this will toggle the bit key's binary value from logic 1 to 0 or vice versa. Touch ok ok to accept the changes and close the dialog. Content tab page content tab page the content content tab page ...
Page 128
You can select 'normal' or 'inverse' pattern type. Touching the 'itu standard' button will apply itu-t o.150 recommended pattern type pattern type for n x 64 kbps data rates (prbs 11). User pattern user pattern user pattern field is enabled if pattern type is set to user [32] bit user [32] bit or us...
Page 129
Tone tone touch the tone frequency tone frequency button and use the launched dialog box to key in the frequency, using the numeric soft keys. Touch the level level button and use the launched dialog box to key in the level. Cas tab page cas tab page the cas cas tab page contains the following param...
Page 130
Connector connector input mode input mode switching between pdh rx and dsn rx is done in the sdh/sonet receiver setup screen. 1. Select sdh rx sdh rx or sonet rx sonet rx check box. 2. Touch stm-xx stm-xx, sts-xx sts-xx, or oc-xx oc-xx button in the navigation area. 3. Use drop down menu at right bo...
Page 131
Input sensitivity input sensitivity follows follows terminate terminate used when the instrument is used as a tester and the receiver is the only device connected to the line. The input impedance is nominal. Bridged bridged used when the receiver is connected directly in parallel to a line carrying ...
Page 132
Line code line code use the line code line code radio buttons to select transmission line code hdb3 hdb3 or ami ami. For normal 2 mbps systems choose hdb3. Ami is for special applications only. Pcm frame pcm frame use the pcm frame pcm frame radio buttons to enable (on on) or disable (off off) the s...
Page 133
Pattern type pattern type select the requested pattern. Refer to pattern type in "transmitter setup". For testing of data rates from 64 kbps to 2 mbps in a 2 mbps line, itu-t o.150 recommends pbrs 11 to be used. For testing at the 2 mbps rate, prbs 15 is recommended in itu-t o.150. Select 'normal' o...
Page 134
Physical status physical status alarm/error status alarm/error status monitor buttons monitor buttons cas cas use the cas cas radio buttons to enable (on on) or disable (off off) the reception of a cas (channel associated signaling) signaling multiframe in time slot 16 of the received signal. 5 5..3...
Page 135
5 5..3 3..3 3..2 2 physical details physical details touching the topmost summary box in the status area of the ports setup ports setup screen displays the status shown below. This screen presents detailed information about the current physical status of the received signal at the 2 mbps e1 layer. T...
Page 136
This screen contains detailed alarm and error information related to the e1 interface. Status is indicated by the use of colored lamp icons . Alarms los los: loss of signal ais ais: alarm indication signal no frame no frame: no frame no crc4 mf no crc4 mf: no cyclic redundancy check 4 multi frames d...
Page 137
This screen provides information on the frame alignment when available. The frame alignment information includes the 16 first fas/nfas words of the crc4 multiframe. If multiframe is not available, the frame information will show 16 fas/nfas words in sequence. The following color indicators are used:...
Page 138
Use of colors use of colors audio channel audio channel cas mfas-signal cas mfas-signal this field shows the status of the cas mfas-signal. Port1, port2 port1, port2 this field shows the mfas bits. Cas bits, port1 and port2 cas bits, port1 and port2 this table shows the status of the cas bits in the...
Page 139
The received line content with even bits inverted. With a-law coded speech it is possible to observe the a-law code words before the even bit inverting. Ds1/j1 inverts all the bits. Peak (pos. And neg.) peak (pos. And neg.) the peak value of the signal. This only applies for a-law speech and it repr...
Page 140
The busy / idle status of channel is displayed. The current audio time slot is marked with an green highlighting. Select the relevant channel by touching it. Audio time slots for all ports are marked, but it is only possible to change the time slots of the current port. Touching this button will con...
Page 141
Alarms/errors/ alarms/errors/ others others select the port to insert errors, and the stimuli type. The settings items vary depending on the selected stimulus type. Pdh alarm/errors pdh alarm/errors: inserts errors or alarms related the pdh multi frame or the pattern error. Pdh frequency pdh frequen...
Page 142
5 5..4 4 ds1/j1 setup and status ds1/j1 setup and status ds1/j1 represents the 1.544 mbit/s pdh layer. The ports setup ports setup screen gives you access to the pdh layer setup for the transmitter and/or receiver of the currently selected port. Ds1/j1 allows transmission of data streams that are no...
Page 143
Input sensitivity - line input sensitivity - line buildout buildout drop and insert drop and insert timing source timing source follows follows for the switching method between pdh tx and dsn tx, refer to physical setup in "e1 setup and status". Touching off off radio button disables the transmitter...
Page 144
Line code line code use the line code line code radio buttons to select transmission line code. Ami ami: alternate mark inversion b8zs b8zs: bipolar eight zero substitution pcm frame pcm frame use the pcm frame pcm frame radio buttons to enable (on on) or disable (off off) insertion of pcm frame in ...
Page 145
Pattern type pattern type select the pattern to be inserted in the transmitted signal. Refer to pattern type in "e1 setup and status". Available patterns are: off off user [32] bit user [32] bit, user [2048] bit user [2048] bit prbs 9 prbs 9 to prbs 31 prbs 31 qrss 20 qrss 20 fox pattern fox pattern...
Page 146
Off off: no channel content is selected. Tone tone: tone with specified frequency and level. Transparent transparent: received content in the same channel time slot is used. Speech speech: pre-programmed speech sequence. 'drop and insert' on tx screen will be switched to on. Channel time slot channe...
Page 147
Input mode input mode 5 5..4 4..2 2 receiver setup receiver setup 5 5..4 4..2 2..1 1 physical setup physical setup when the receiver is set up with only a ds1/j1 interface, touching the rx rx button in the navigation area will launch the following screen. For the switching method between pdh rx and ...
Page 148
Follows follows to make the currently selected receiver follow either the transmitter or port 1 receiver (i.E. Copy its settings), touch the drop-down menu in the navigation area and select the relevant value. The receiver settings continue to follow the change of either the transmitter or port 1 re...
Page 149
Pattern type pattern type select the requested pattern. Available patterns are the same as the transmitter setup. Refer to pattern type in "e1 setup and status". Touch 'normal' or 'inverse' pattern type. Touching the 'itu standard' button will apply itu-t o.150 recommended pattern type pattern type ...
Page 150
Physical status physical status alarm/error status alarm/error status monitor buttons monitor buttons cas cas use the cas cas radio buttons to enable (on on) or disable (off off) the reception of a cas (channel associated signaling). 5 5..4 4..3 3 status information status information this section d...
Page 151
5 5..4 4..3 3..2 2 physical details physical details refer to physical details in "e1 setup and status". The nominal bit rate of ds1/j1 is 1 544 000 bps. 5 5..4 4..3 3..3 3 alarms and errors alarms and errors touching the middle summary box in the status area of the ports setup ports setup screen di...
Page 152
This screen provides information on the frame alignment when available. F-bit and m-bit are displayed when the frame type is j1 j1 or esf esf. F-bit and s-bit are displayed when the frame type is sf/d4 sf/d4. In-band fdl in-band fdl displays the in-band fdl (facility data link) data. Trigger trigger...
Page 153
Use of colors use of colors this screen gives information on the cas (channel associated signaling) signaling when available. It displays the state of the two signaling bits in both directions for all 24 channels. Activity is indicated with bold characters. For easy recognition of special bit combin...
Page 154
5 5..5 5 e3 setup and status e3 setup and status e3 represents the 34.368 mbit/s pdh layer. The ports setup ports setup screen gives you access to the pdh layer setup for the transmitter and/or receiver of the currently selected port. E3 allows transmission of data streams that are nominally running...
Page 155
Timing source timing source follows follows for the switching method between pdh tx and dsn tx, refer to physical setup in "e1 setup and status". Touch e3 e3 radio button. Touching off off radio button disables the transmitter. This screen allows you to make the physical setup of the pdh transmitter...
Page 156
Input mode input mode off off user [32] bit user [32] bit, user [2048] bit user [2048] bit prbs 9 prbs 9 to prbs 31 prbs 31 fox pattern fox pattern, fox (cma3000) fox (cma3000) all 0's all 0's, all 1's all 1's alternating 1:1 alternating 1:1, alternating 1:3 alternating 1:3, alternating 1:7 alternat...
Page 157
Follows follows terminate terminate used when the instrument is used as a tester and the receiver is the only device connected to the line. The input impedance is nominal. Monitor monitor used when connecting to protected monitoring points. The input impedance is nominal. 5 5..5 5..2 2..2 2 e3 signa...
Page 158
Physical status physical status alarm/error status alarm/error status 5 5..5 5..3 3 status information status information this section describes the status information available for the e3 layer in the status area of the ports setup ports setup screen. 5 5..5 5..3 3..1 1 status summary status summar...
Page 159
Alarms los los: loss of signal ais ais: alarm indication signal no frame no frame: no frame distant distant: distant no sync no sync: no synchronization errors fas words fas words: received fas pattern does not match to "1111010000". Pattern error pattern error: received pattern does not match to sp...
Page 160
5 5..6 6 ds3 setup and status ds3 setup and status ds3 represents the 44.736 mbit/s pdh layer. The ports setup ports setup screen gives you access to the pdh layer setup for the transmitter and/or receiver of the currently selected port. Ds3 allows transmission of data streams that are nominally run...
Page 161
Line buildout line buildout timing source timing source for the switching method between pdh tx and dsn tx, refer to physical setup in "e1 setup and status". Touch ds3 ds3 radio button. Touching off off radio button disables the transmitter. This screen allows you to make the physical setup of the p...
Page 162
Follows follows to make the port 2 transmitter follow the port 1 transmitter (i.E. Copy its settings) when using port 1 and port 2, touch the drop-down menu in the navigation area and select the tx1 tx1. The port 2 settings continue to follow the port 1 transmitter change. The default setting is non...
Page 163
C-bit frame overhead c-bit frame overhead x f1 aic f0 na f0 feac f1 x f1 udl f0 udl f0 udl f1 p f1 cp f0 cp f0 cp f1 p f1 febe f0 febe f0 febe f1 m0 f1 dl f0 dl f0 dl f1 m1 f1 udl f0 udl f0 udl f1 m0 f1 udl f0 udl f0 udl f1 aic: application identification na: network application feac: far-end alarm ...
Page 164
Option option meaning meaning cord word cord word feac off - ds3 ef ds3 equipment failure service affecting 011001 ds3 lof ds3 loss of signal 001110 ds3 oof ds3 out of frame 000000 ds3 ais ds3 ais received 010110 ds3 idle ds3 idle signal received 011010 ds3 ef nsa ds3 equipment failure (non-service ...
Page 165
Input mode input mode follows follows this screen allows you to make the physical setup of the pdh receiver in ds3 mode. It can also be used to inspect the current status of the selected port. The configuration options available in the setup area of the screen are described below. The status informa...
Page 166
Physical status physical status alarm/error status alarm/error status monitor button monitor button touch 'normal' or 'inverse' pattern type. Touching the 'ansi standard' button will apply ansi/ieee 1007 recommended pattern type pattern type for 45 mbit data rates (prbs 23 inverse). User pattern use...
Page 167
This dialog box contains detailed alarm and error information related to the ds3 interface. Status is indicated by the use of colored lamp icons . Alarms los los: loss of signal ais ais: alarm indication signal lof lof: loss of frame rai rai: remote alarm indication idle idle: idle signal lss lss: l...
Page 168
Alignment status when the frame type is m13 alignment status when the frame type is m13 alignment status when the frame type is c-bit alignment status when the frame type is c-bit this screen provides information on the frame alignment when available. The frame alignment information includes the bel...
Page 169
5 5..6 6..4 4 errors/alarms insertion errors/alarms insertion refer to errors/alarms insertion in e1 setup and status section. Ds3 setup and status ds3 setup and status 169 169.
Page 170
5 5..7 7 e4 setup and status e4 setup and status e4 represents the 139.264 mbit/s pdh layer. The ports setup ports setup screen gives you access to the pdh layer setup for the transmitter and/or receiver of the currently selected port. E4 allows transmission of data streams that are nominally runnin...
Page 171
Timing source timing source follows follows for the switching method between pdh tx and dsn tx, refer to physical setup in "e1 setup and status". Touch e4 e4 radio button. Touching off off radio button disables the transmitter. This screen allows you to make the physical setup of the pdh transmitter...
Page 172
Input mode input mode the length can be any length from 1 bit to 32 bits or from 1 bit to 2048 bits. 5 5..7 7..2 2 receiver setup receiver setup 5 5..7 7..2 2..1 1 physical setup physical setup when the receiver is set up with only an e4 interface, selecting the rx rx button in the navigation area w...
Page 173
Physical status physical status alarm/error status alarm/error status to make the currently selected receiver follow either the transmitter or port 1 receiver (i.E. Copy its settings), touch the drop-down menu in the navigation area and select the relevant value. The receiver settings continue to fo...
Page 174
Refer to physical details in "e1 setup and status". The nominal bit rate of e4 is 139 264 000 bps. 5 5..7 7..3 3..3 3 alarms and errors alarms and errors touching the middle summary box in the status area of the ports setup ports setup screen displays the status shown below. This screen contains det...
Page 175
5 5..8 8 aps aps the automatic protection switching (aps) test described in this section is applicable for sdh/sonet/pdh/dsn interfaces. For aps test of otn interface, refer to aps in "otn application". On sdh/sonet k1,k2 protocol decoding is performed, as well as measurement of average and maximum ...
Page 176
Measurement measurement condition condition threshold threshold this screen contains the parameters for setting up the threshold values for alarms/errors and pass/fail status. Reference event reference event use the drop-down menu(s) to select the relevant event (any errors any errors, los los, lof ...
Page 177
Summary field summary field list-form information list-form information this screen presents a summary of the results of the aps test. For each port the following information is displayed: reference event average switching time max. Time max reference duration 5 5..8 8..3 3..2 2 details for aps deta...
Page 178
Graphical graphical presentation presentation protocol interpretation protocol interpretation configuration configuration request request the graphical presentation consists of a bar diagram of the automatic switching times. Results may be affected by unexpected alarms/errors. Shows the screen displ...
Page 179
Touch the apply apply button to apply the specified aps request to the sdh/sonet transmitter. 5 5..8 8..3 3..4 4 event log event log touching the event log event log button in the navigation area displays the screen providing the event log data. Refer to event log of sdh/sonet/pdh/dsn bert applicati...
Page 180
5 5..9 9 bert bert the bit error rate test (bert) described in this section is applicable for sdh/sonet/pdh/dsn interfaces. For bert of otn interface, refer to bert in "otn application". The interface settings on the ports setup screen determines whether the current application is sdh, sonet, pdh an...
Page 181
Measurement mode measurement mode button appears in the navigation area only when starting the bert by application selector. Measurement mode measurement mode touch the field to select the application. Bert rtd aps pointer movement pointer movement touch the field to select the pointer movement poin...
Page 182
Performance performance parameters parameters manual stop manual stop: stops the measurement immediately when you touch the stop stop button. Stop at stop at: stops the measurement at the time specified in the stop at stop at field on the right. Duration duration: performs the measurement for the du...
Page 183
Performance parameters performance parameters parameter parameter name name pdh pdh sdh, sonet sdh, sonet otn otn g.821 g.821 g.826 g.826 m.2100 m.2100 g.826, g.826, g.828+g.829, g.828+g.829, m.2101.1 m.2101.1 g.8201,m.2401 g.8201,m.2401 es ✓ ✓ ✓ ✓ ses ✓ ✓ ✓ ✓ ✓ bbe ✓ ✓ ✓ als ✓ ✓ ✓ uat ✓ ✓ ✓ ✓ * una...
Page 184
Pattern errors pattern errors transport transport these items appear if pdh tx pdh tx and pdh rx pdh rx, or dsn tx dsn tx and dsn rx dsn rx are selected on setup screen. E1 e1 g.821, g.826, m.2100, g.821 (expired) e3 e3 g.826, m.2100 e4 e4 g.826, m.2100 ds1/j1 ds1/j1 g.821, g.826, m.2100, g.821 (exp...
Page 185
Statistics category statistics category transport transport pattern pattern pattern error insertion pattern error insertion interface interface select the item to evaluate from otn otn, sdh sdh, sonet sonet, e4 e4, e3 e3, e1 e1, ds3 ds3 or ds1/j1 ds1/j1. Evaluation item evaluation item select the it...
Page 186
Pointer source pointer source zoom zoom insertion insertion select the timing of the error insertion from the drop-down menu. Off off: stops the error insertion. Manual manual 1e-04 1e-04 to 1e-10 1e-10 alternate alternate burst length burst length if 'insertion' is set to manual manual, touch the b...
Page 187
When releasing the finger or stylus, the graph area zooms in to show the selected part of the graph. To zoom out, use the view settings below the graph: view mode view mode used to set the x-scaling for the graph. The possible settings are: last 24h last 24h to last 5m last 5m: shows a sliding graph...
Page 188
Event log display event log display functions functions 5 5..9 9..3 3..3 3 event log event log touching the event log event log button in the navigation area displays the screen shown below. The slide-out panel on the left-hand side of the screen contains the following event log functions: define ti...
Page 189
The event log list the event log list the test start event (started) and stop event (stopped) are always shown in the event log. The view view setting applies a port filter. A single port or all ports can be selected. Events with no port association will always pass. The csv export csv export button...
Page 190
Selecting the interval selecting the interval time time this screen presents a detailed analysis of the test results. You can choose to view either the total results from measurement start or the results of a specific interval during the test. You can also zoom in on a specific result item. The resu...
Page 191
Selecting type of selecting type of results results studying a specific studying a specific result result selecting notation selecting notation open the middle drop-down menu in the top row of buttons to select which results you want to display on the screen. Otn otn sdh sdh, sonet sonet e1 e1, e3 e...
Page 192
Tu vc-12/11 bulk au pointer tu pointer justification * 1 sdh performance mux au vc-4/3 tu vc-3 tu vc-12/11 sdh tcm alarms errors sonet alarms/errors alarms errors sonet quality frequency mux sts-3c/1 tu vc-3 vt-2/1.5 bulk sts pointer vt pointer justification * 1 sonet performance mux sts-3c/1 tu vc-...
Page 193
Pattern errors *1: justification justification appears when 'pdh rx' or 'dsn rx' is selected. *2: e-bit errors e-bit errors appears when 'e-bit' is set to on in frame tab of e1 receiver. *3: crc6 errors crc6 errors appears when 'esf' or 'j1' is selected. Sdh/sonet performance measurement items sdh/s...
Page 194
Bis limit bis limit items items definition definition s1-es the es threshold for deciding accecpted s2-es the es threshold for deciding unaccecpted s1-ses the ses threshold for deciding accecpted s2-ses the ses threshold for deciding unaccecpted s1-es, s2-es, s1-ses, and s2-ses are the calculated va...
Page 195
Uat when ses or als continues for ten seconds, uat starts from the beginning of the time. When items other than ses continues for ten seconds, uat ends at one second before the time. Refer to the figure of example of unavailable time detection . First, the time (when determining the start of uat) is...
Page 196
5 5..10 10 rtd rtd the round-trip delay (rtd) test measures the time that the data which is transmitted by the transmitter returns to the receiver. The rtd test described in this section is applicable for sdh/sonet/pdh/dsn interfaces. For rtd test of otn interface, refer to rtd in "otn application"....
Page 197
Test condition test condition threshold threshold allows you to define the test duration in one of two ways: mode mode single single - used to perform rtd test once. Repeat repeat - used when a persistent rtd test is needed. Measurement period measurement period select the measurement period from 0....
Page 198
Summary field summary field list-form information list-form information graphical graphical presentation presentation buttons for selecting the relevant port are displayed at the top of the screen, with a color indication of the pass/fail status of the test. This screen presents the detailed results...
Page 199
6 6 ethernet applications ethernet applications this chapter describes the graphical user interface (i.E. Screens, sub-screens and major dialogs) related to ethernet applications. Sub-screens and dialogs are described under the main screen from which they are activated/launched. The following settin...
Page 200
6 6..1 1 ethernet setup and status ethernet setup and status ethernet is globally used for data communication. Ethernet transmits variable length frames up to 1500 bytes in length, each containing a header with the source and destination addresses and a trailer that contains error correction data. W...
Page 201
Port definition port definition clock configuration clock configuration 6 6..1 1..1 1..1 1 port configuration parameters port configuration parameters you can use either a 'quick mode' or a 'detailed mode' to set up the port. Touching the long button at the top of the setup area will launch the port...
Page 202
Transceiver transceiver port mode = off port mode = off electrical + electrical + autonegotiate autonegotiate gps gps received received ieee 1588v2 ieee 1588v2 received received appears when the interface type is set to sfp sfp or sfp+ sfp+. Displays the transceiver information. 6 6..1 1..1 1..2 2 p...
Page 203
Electrical + forced electrical + forced sfp + autonegotiate sfp + autonegotiate sfp + forced sfp + forced sfp+ sfp+ open the clock clock drop-down menu to select one of the following settings: prefer master prefer master, prefer slave prefer slave, master master, or slave slave. Selecting the forced...
Page 204
Header header this screen allows you to specify the configuration of a wan interface sublayer for the currently selected ethernet port. It can also be used to inspect the current status of the selected port. The configuration options available in the setup area of the screen are described below. The...
Page 205
This screen contains the setup of the ethernet frame content transmitted by the network master. The exact layout depends on the current selection of layers (i.E. The various encapsulation and protocol headers composing the ethernet frame). Touching the button in the top left-hand part of the screen ...
Page 206
The quick selection menu contains a number of predefined frame configurations (e.G. Eth/vlan/ipv4 eth/vlan/ipv4). The detailed mode dialog box allows you to specify the frame configuration yourself and also provides you with access to all configuration parameters available for the individual layers....
Page 207
Copy frame content to copy frame content to other stream(s) other stream(s) this feature allows you to copy the frame content of the stream that you are currently configuring to all streams in another port or to a single stream. Touching the copy to copy to button opens a drop-down menu from which y...
Page 208
The layer buttons are arranged in order from bottom to top and from left to right. The tcp/udp protocols are the uppermost layer and ethernet the lowermost as depicted below compared to the osi model. # # osi layer name osi layer name protocol protocol (1) protocols can be excluded and the content c...
Page 209
Custom custom mpls mpls-tp pbb vlan llc1 snap ipv4 ipv6 udp tcp payload variable custom header can be set on bert application, allows users to edit the specific area in the header. To set custom header, touch the custom custom button in layer 2 or select custom custom in layer 3. Custom custom appea...
Page 210
Unframed unframed eth eth export export touching this button launches the export custom header export custom header dialog box. Enter the file name and touch export export button. Following operation on steam setup dialog box will display the parameter of the unframed stream. The frames of unframed ...
Page 211
Mpls mpls the ethernet (mac) header contains mac addresses and ethertype. Dst mac dst mac the destination mac address can either be specified manually. This can be decided based on an arp lookup when ipv4 is set to layer 3 or based on an ndp when ipv6 is set to layer 3. To enable arp or ndp, select ...
Page 212
Mpls-tp mpls-tp level count level count up to eight levels of mpls fields can be inserted in the frame. The number of mpls fields is selected through the level count level count drop-down menu, and each level is set up individually. Label label allows you to set up a denoting of the mpls. Exp exp al...
Page 213
Pbb pbb auto increment auto increment selecting the auto increment auto increment check box makes the sequence number in the rfc4448 control word increment automatically instead of being fixed to zero. The remaining fields are described under the eth layer. When mpls-tp is active the arp arp button ...
Page 214
Vlan vlan shows the type automatically depending on layer configuration. If the value is selectable, select the value by touching the field. Touching the vlan vlan layer button displays the parameters available for the virtual lan protocol layer. Virtual lan (vlan) is used to create independent logi...
Page 215
Llc1 llc1 snap snap ethertype ethertype when the level count is more than one, select the type from 0x8100 0x8100, 0x88a8 0x88a8, 0x9100 0x9100 or 0x9200 0x9200. When ipv4 ipv4 or ipv6 ipv6 is set to layer 3, the ethertype of the highest level is automatically defined, based on the next protocol ele...
Page 216
Ipv4 ipv4 the protocol id protocol id is fixed to 0 0, and the ethertype ethertype field depends on the upper protocol layer. 'snap' is not possible without 'llc1'. Touching the ipv4 ipv4 layer button displays the parameters available for the internet protocol version 4 layer. Ipv4 header is defined...
Page 217
Version, header length version, header length shows version and header length in the ipv4 header. Total length total length shows total length in the ipv4 header. Dscp/tos dscp/tos when changing the dscp/tos dscp/tos (differentiated service code point/type of service) setting, it is possible to defi...
Page 218
Selecting the dhcp dhcp check box located next to the src ip src ip field will enable the dynamic host configuration protocol function. Selecting the dns dns check box located next to the dst ip dst ip field changes the field name to hostname hostname, allowing you to specify the domain name server....
Page 219
Ipv6 ipv6 touching the ipv6 ipv6 layer button displays the parameters available for the internet protocol version 6 layer. Ipv6 header is defined in rfc 791 as below. Version version shows version in the ipv6 header. Traffic class traffic class traffic class traffic class is similar to ipv4's dscp/t...
Page 220
Udp udp shows payload length in the ipv6 header. This value is calculated automatically. Next header next header the next header indicates the upper/next layer protocol encapsulated in the ip datagram. Typical values in hex are: 1 = icmp , 6 = tcp etc. Hop limit hop limit the hop limit defines the n...
Page 221
Tcp tcp user datagram protocol is a core protocol of the internet protocol suite. The udp provides a minimal and simple interface between a network layer below and a session layer or application above. This protocol does not guarantee reliable and in-order delivery from sender to receiver. Udp heade...
Page 222
Transmission control protocol is a core protocol of the internet protocol suite. It is the intermediate layer between the internet protocol below it and the application above it. This protocol guarantees reliable and in-order delivery from sender to receiver. The network master supports sending fram...
Page 223
Payload payload when listen mode is enabled, the transmitter will await an external tcp connection before the actual traffic frames are sent. This makes it possible to pass a firewall/nat router from the other side (remark: you must have something establishing the tcp connection from the inner side ...
Page 224
Open the pattern pattern drop-down menu to select the relevant pattern. Fox fox 5555 5555 prbs9 prbs9 to prbs31 prbs31 hf test hf test crpat crpat jtpat jtpat spat spat user 32 bit user 32 bit if you select the user 32 bit user 32 bit pattern, a button appears with which you can open the pattern edi...
Page 225
Variable variable ethernet frames. The variable allows you to set variables in the transmitted frames. When eth eth button in layer 2 is green. When custom custom button in layer 2 is green. Variable no. Variable no. Select which of the two variables you want to define. Field field use the drop-down...
Page 226
Allows you to specify a bit position and bit length for the variable by offset offset and length length field. The position of a variable is shown in green. 'x' means four bits. When custom button in layer 2 is green, row of boxes appears. A box indicates eight bits. The part in green shows that all...
Page 227
6 6..1 1..2 2..3 3 swap swap touching the swap swap button in the navigation area displays the following screen. Swap swap button appears in reflector application. This screen is where you configure the traffic loop by specifying how addresses and/or ports are to be swapped and reflected. Selecting ...
Page 228
This screen allows you to specify how the network master handles incoming frames on the currently selected ethernet port. It can also be used to inspect the current status of the selected port. Follows follows it is possible to let the port 2 copy the setup from port 1 by touching the follows follow...
Page 229
Allows you to specify the minimum allowed receiver interframe gap. The default setting is 12 12 bytes. The range is from 8 8 to 15 15 bytes. Filter ifg violations caused by master/slave clock synchronization filter ifg violations caused by master/slave clock synchronization applies only to gigabit m...
Page 230
Setup setup this screen allows you to configure the setup parameters related to synchronous ethernet. It can also be used to inspect the current status of the selected port. The configuration options available in the setup area of the screen are described below. The status information is described i...
Page 231
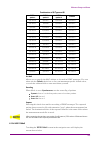
Combination of ql type and ql combination of ql type and ql g.781 g.781 option i option i g.781 g.781 option ii option ii g.781 g.781 option iii option iii g.8264 g.8264 ql-inv0 ql-stu ql-unk ql-inv0 ql-inv1 ql-prs ql-inv1 ql-inv1 ql-prc ql-inv2 ql-inv2 ql-inv2 ql-inv3 ql-inv3 ql-inv3 ql-inv3 ql-ssu...
Page 232
This screen allows you to configure the ieee 1588 clock (based on the ieee 1588 precision time protocol (ptp), which is used to distribute absolute time across the ethernet network). An ieee 1588 clock can act either as a timing master or as a slave. The screen also contains information about the cu...
Page 233
When the network master is grandmaster in unicast mode, only one slave will be accepted at a time. Other slaves are just ignored. Ext. Log ext. Log used to record the external log. If you select this, the ieee1588v2 log ieee1588v2 log button appears in the navigation area of test result. Capture cap...
Page 234
You can set up the transport protocol(s) for ptp messages either by selecting one of the predefined configurations from the quick selection menu (e.G. Eth/vlan/ipv4/udp eth/vlan/ipv4/udp) or by configuring the protocols via the detailed mode dialog box. Touching the protocol button will launch the d...
Page 235
Unicast negotiat unicast negotiat selecting the check box enables the unicast negotiation. This check box is available when profile is set to user defined user defined and the unicast unicast is selected. Clock tab page clock tab page the clock clock tab page contains the parameters related to the c...
Page 236
Prtc connected prtc connected and prtc not connected prtc not connected are available when: profile is set to g.8275.1 g.8275.1 or user defined user defined and slave mode slave mode is cleared. Prtc: primary reference time clock timing tab page timing tab page the timing timing tab page contains th...
Page 237
Transport protocol transport protocol g0325a mu100090a (when using j1706a gps antenna of the standard accessory) sync interval sync interval allows you to specify the interval between transmitted sync messages. Available values are between 1/128 s 1/128 s and 32 s 32 s. The data to send actually is ...
Page 238
Eth layer eth layer when the layer 3 is set to none none, you can set src mac src mac and select multicast select multicast mac address mac address only. Dst mac dst mac - type in the destination mac address to be used with all ptp unicast frames. Touch the arp arp button to solve any mac setup in c...
Page 239
Between 0x0 and 0xf. Enable extension header enable extension header -appends the ipv6 extension header. Touching extension header extension header opens the extension header dialog box. Type select the extension header type from hop-by-hop hop-by-hop, routing (type 0) routing (type 0), destination ...
Page 240
Oam protocol oam protocol touch the button in the top left-hand part of the screen to select the protocol. The setup parameters are grouped according to protocol. 802.3ah protocol - applies to the connectivity of point-to-point connections across one hop. 802.1ag protocol - applies to the connectivi...
Page 241
802.3ah protocol 802.3ah protocol setup setup pbb layer pbb layer refer to pbb in "stream" subsection. Vlan layer vlan layer refer to vlan in "stream" subsection. Mpls, mpls-tp layer mpls, mpls-tp layer refer to mpls in "stream" subsection. Selecting the 802.3ah 802.3ah protocol will display the scr...
Page 242
802.1ag protocol 802.1ag protocol setup setup select this check box to make the device operate in unidirectional transmission mode. Link event link event this setting is reserved for future use and cannot be set. Remote loopback remote loopback this setting is reserved for future use and cannot be s...
Page 243
General parameters general parameters state state allows you to set the state of the protocol to either on on or off off. Note that when state state is set to on on, the other general parameters are disabled, but the tab pages and their contents are enabled. Mep id mep id allows you to specify the l...
Page 244
Y.1731 protocol setup y.1731 protocol setup allows you to specify a ttl value. Used to indicate whether or not an ltm should be terminated by the receiver. Trans id trans id allows you to specify the transaction number for the ltm. Selecting the y.1731 y.1731 protocol will display the screen shown b...
Page 245
Use the drop-down menu to specify the frequency at which ccms are transmitted and expected to be received. Lbm tab page lbm tab page the lbm lbm tab page contains the following parameters: optional tlv optional tlv use the drop-down menu to select a tlv type, if relevant. The possible types are: dat...
Page 246
Mcc tab page mcc tab page the mcc mcc tab page contains the following parameters: oui oui allows you to specify the organizationally unique identifier for the organization defining a specific format and meaning of eth-mcc. Data data allows you to specify any required additional information. The type...
Page 247
Only available if a data tlv type has been selected. Allows you to specify the length of the tlv. Value value only available if a data tlv type has been selected. Allows you to specify the value of the tlv. Note that for the data tlv type, this field is an entry field where you open an editor and ty...
Page 248
Use the drop-down menu to select the rate at which lmm frames are transmitted. Frames to send frames to send allows you to specify the number of frames to transmit. Loss threshold loss threshold allows you to specify a loss threshold that is used when an lmm test is active. If the loss ratio meets o...
Page 249
Discovering devices discovering devices the contents of the discovery view screen is the same for both protocols. The screen contains the following parameters: ccm/lbm ccm/lbm select the radio button for the relevant method of discovery. Ccm ccm - passive method. Discover remote maintenance points b...
Page 250
Adding devices adding devices manually manually removing devices removing devices devices will appear in the dialog's list as they are discovered. Select the device in the list and touch the add add button in the dialog box. The device is added to the list displayed on the discovery view screen. To ...
Page 251
Columns are columns are "and'ed", rows are "and'ed", rows are "or'ed". "or'ed". Touching the filter filter button in the navigation area will display the screen shown below. This screen allows you to set up filters and masks for the reception of ethernet frames. It can also be used to inspect the cu...
Page 252
Allow the following allow the following encapsulation types encapsulation types select filter select filter to specify the set of values and/or masks available for each filter (i.E. The columns of the table), touch the select filter select filter button. This will launch the filter editor dialog box...
Page 253
4. Touch the cell of pattern pattern in the table on the setup area. 5. Specify the pattern of four bytes. 6. Select the check box at left-side of the table. For mpls/vlan pattern setting, the dedicated dialog box will launch. Mpls mpls enter the number of mpls label and ttl (time to live). You can ...
Page 254
Physical status physical status interface status interface status monitor buttons monitor buttons the topmost part of the status area gives you access to information about the current physical status of the selected interface. A summary consisting of the most relevant status indicators is displayed ...
Page 255
Timing timing link link link partner abilities link partner abilities accumulated difference , which shows the accumulated bit rate difference between the received signal and the reference source signal. Link , which shows the link status of ethernet. Link partner abilities , which shows the abiliti...
Page 256
Lan status lan status view mode view mode indicates in green when the device is capable of asymmetric flow control using pause request. Remote fault remote fault indicates in green when the device is sending the remote fault signal. Speed/duplex speed/duplex available speed and duplex are indicated ...
Page 257
Sync test sync test button appears when sync test application is running. The icon indicating the summary is displayed on each button. Wan alarms, wan errors wan alarms, wan errors for the detail of items, refer to the following descriptions in "sdh/sonet/pdh/dsn applications". Sdh alarms sdh errors...
Page 258
Ssm/ql ssm/ql local clock local clock this screen presents information related to the status of synchronous ethernet. Synchronization status message and quality level status last received last received shows the latest ql value. Ssf ssf server signal fail . The lamp icon becomes red when no esmc mes...
Page 259
Wall clock wall clock parent clock parent clock grandmaster clock grandmaster clock offset offset shows the current offset from the master clock. Mean path delay mean path delay shows the mean path delay, which is the time from master to slave back to master again, divided by two. Sync timeout sync ...
Page 260
Foreign masters foreign masters 802.3ah status 802.3ah status information information shows the time source. The hexadecimal value of the time source in the ptp packet data is displayed right-hand. Provides a list of detected foreign masters. The identity of the current master is shown in the field,...
Page 261
802.1ag status 802.1ag status information information loop button loop button touch the loop loop button to send the far-end device into loopback mode and reflect frames. Devices tab page devices tab page shows the status of the remote and local devices. Variables tab page variables tab page on the ...
Page 262
Y.1731 status y.1731 status information information shows extra information about ltm frames. Message buttons message buttons allows you to send messages either to a remote mep id or to a unicast mac address. U-lbm u-lbm: data-path integrity to/from the far-end to/from one address (unicast). M-lbm m...
Page 263
Capture setup capture setup trigger setup trigger setup shows extra information about the various frame types. 6 6..1 1..3 3..8 8 frame capture frame capture touching the frame capture frame capture button in the status area of the ports setup ports setup screen launches the screen shown below. This...
Page 264
Frame field trigger frame field trigger definition definition frame capture starts when the error specified by error type error type drop-down menu has occurred. Field match frame capture starts if the field in transmitted frame matches to one defined by frame field trigger definition frame field tr...
Page 265
Module present module present transceiver transceiver information information power monitor power monitor alarms/errors/ alarms/errors/ others others this screen presents status information about the optical transceiver (pluggable module installed on the connector panel). Green green indicates that ...
Page 266
Ethernet lan ethernet lan: inserts errors or alarms related the ethernet frame, ip packet or the pattern error. Ethernet pcs alarms/errors ethernet pcs alarms/errors: inserts errors or alarms to pcs blocks. Ethernet wan ethernet wan: inserts errors or alarms to the wan header. Ethernet frequency eth...
Page 267
Destination destination description description fcs sends an ethernet frame which has fcs error. Preamble sends a preamble in which pattern is different from the normal pattern. Pause frames. Sends pause frames. Wrong ip checksum sends data which ipv4 header checksum is wrong. Fragmented ip sends ip...
Page 268
6 6..1 1..4 4..3 3 ethernet wan ethernet wan when port is set to sfp+ 10 gbps wan sfp+ 10 gbps wan, inserting the wan alarms/errors is available. 1. Select alarms alarms or errors/violations errors/violations using the radio button. 2. Select destination destination using the drop down menu. 3. Sele...
Page 269
6 6..2 2 bert bert the bit error rate test (bert) described in this section is applicable for ethernet interfaces. For bert of otn interface, refer to bert in "otn application". 6 6..2 2..1 1 ports setup and status ports setup and status the first step in running an application is to set up the port...
Page 270
Performance performance parameters parameters allows you to specify when the measurement is started. Immediate immediate: starts the measurement when you touch the start start button. Start at start at: starts the measurement at the time specified in the start at start at field on the right. Stop fu...
Page 271
Bert options bert options otn-related otn-related these items appear if otn tx otn tx and otn rx otn rx are selected on setup screen. Otn otn g.8201, m.2401 (m.2110) time period time period 15 minutes, 1 hour, 2 hours, 24 hours, 7 days allocation allocation touching the setup setup button launches t...
Page 272
Traffic duration traffic duration only show ber alarms when measuring only show ber alarms when measuring ber alarms in interface status dialog box is enabled only when the measurement is running. This function allows to avoid the ber alarms occurrence when no data is input. Ignore the frame loss se...
Page 273
Transmission mode transmission mode stream profile stream profile line load line load this screen contains the parameters for specifying a profile and pattern for each stream and for specifying which measurements are made. Normal normal: does not generate the bursts. The normal ethernet frames are s...
Page 274
The line load unit can be specified from percent percent, mbps mbps, and ifg ifg. When ifg (inter frame gap) is specified to the unit, 12 byte setting means the 100% utilization. The value set to the field is an average of inter frame gap. When transmission mode is normal normal, 100% or more line l...
Page 275
Frame size frame size when profile is set to data data, four setups are available: constant constant uses the fixed frame size specified by the start start value for the duration of the test. The following figure shows an example of frame sizes when constant constant is selected. Stepped stepped ste...
Page 276
Burst mode burst mode 1-byte incremental 1-byte incremental steps the frame size from start start to end end in increment of one byte in frame-by- frame. The following figure shows an example of frame sizes when 1-byte 1-byte incremental incremental is selected. Frame size is protocol headers and pa...
Page 277
Burst length burst length frame size frame size ramp ramp: generates the bursts while changing the burst length. Number of bursts number of bursts selecting num of burst num of burst allows to set the number of the bursts to generate. If sending specified number bursts has finished, sending stream w...
Page 278
Select one or more of the measurements (jitter jitter, latency latency and service service disruption disruption) and then specify a threshold value for each. When service disruption service disruption is selected, select disruption type disruption type from "packet" or "los". Enable sequence checki...
Page 279
Pattern errors pattern errors sequence errors sequence errors service disruption service disruption total frame total frame difference difference transport transport ethernet ethernet this screen contains the parameters for setting up the various threshold values (i.E. Limits) for errors and pass/fa...
Page 280
In the dialog box, select the check boxes for the relevant thresholds and then touch the close close button to list them on the thresholds thresholds screen. You can select/deselect all check boxes in the dialog box by using the select all select all / clear clear all all buttons. Touch the individu...
Page 281
This screen contains a summary of the results of the ethernet bert test. The information includes such things as number of pattern errors, average and maximum disruption time, and number of exceeded thresholds. The three dials showing utilization/throughput results, pattern errors and errored frames...
Page 282
Transport transport pattern pattern pattern error insertion pattern error insertion displays the results of transport test. This result appears if 'transport' check box is selected in the test setup screen. Allows to change the payload pattern . Cross pattern cross pattern check box is the same as c...
Page 283
Message type message type this screen presents an ieee1588v2 log of the test results. You can search the messages by specifying the type. Search search select the message type from below. Announce announce delayreq delayreq delayresp delayresp followup followup management management pdelayreq pdelay...
Page 284
This screen presents an oam log of the test results. Note that the layout of the dialog box depends on the currently selected oam protocol. 6 6..2 2..3 3..4 4 event log event log touching the event log event log button in the navigation area displays the screen providing the event log data. Refer to...
Page 285
Selecting the interval selecting the interval time time selecting type of selecting type of results results touch the total total button to switch the total values measured in all interval times. The start time of measurement is displayed on the button. Touching the button in left side back back fie...
Page 286
Studying a specific studying a specific result result selecting notation selecting notation touch a specific cell in a result table to zoom in on the corresponding result item. The count count and ratio ratio fields are displayed on a zoom zoom tab page. A time vs. Time vs. Statistics statistics tab...
Page 287
Size dist. Frame size transmit results traffic latency results latency(ns) jitter results jitter(ns) wan alarms/errors alarms errors wan g.826 results mux spe wan g.826+g.829 results mux spe wan m.2101.1(m.2100) results mux spe synce results ssm statistics alarms rx ssm ql ieee 1588v2 results offset...
Page 288
Unavailable time of measurement. Refer to uat definition. M.2100 performance parameters m.2100 performance parameters items items definition definition es errored second within s avail , the number of seconds during which one or more pattern errors occurred. Ses severely errored second within s avai...
Page 289
Sequence error and sequence sync loss are measured as following: ethernet frames sent by network master include special bytes that indicates sequence number. When receiving this ethernet frames, network master sets the sequence number of next incoming ethernet frame. Network master checks sequence n...
Page 290
6 6..3 3 cable cable the ethernet cable test uses time domain reflectometry (tdr) to validate and detect open and short circuited cat5/cat5e cables. This test is convenient for installation and troubleshooting of cables. Time domain reflectometry principle time domain reflectometry principle the tdr...
Page 291
Test setup controls test setup controls test monitoring test monitoring information information this screen allows you to control and monitor an ethernet cable test . Color coding standard color coding standard allows you to select the color coding used for the graphical representation of the cables...
Page 292
6 6..4 4 channel statistics channel statistics the channel statistics test separates incoming frames into channels based on a number of defining characteristics ( definitions ) and shows information about each channel ( statistics ). The test is mostly used for in-service monitoring, where it provid...
Page 293
Merging channels merging channels this screen is where you specify which frame characteristics are considered when performing the channel separation (i.E. Which frame characteristics are active during the test). The maximum number of channels is 231. 6 6..4 4..3 3 test results test results 6 6..4 4....
Page 294
Selecting notation selecting notation modifying columns modifying columns open the merge merge drop-down menu to combine all channels where one specific definition value (e.G. The source mac address) is identical. The drop-down menu contains all currently active definitions. When the test results ar...
Page 295
Tcp statistics tcp statistics udp statistics udp statistics select/clear all select/clear all to select all check boxes in the dialog box, touch the select all select all button. To clear all check boxes in the dialog box, touch the clear all clear all button. 6 6..4 4..3 3..2 2 ieee1588v2 log ieee1...
Page 296
6 6..5 5 mon/gen mon/gen ethernet monitor/generate is typically used for out-of-service and performance testing. It is possible to perform a passive, non-intrusive monitoring or at the same time transmit test data, which can be reflected for further evaluation and testing of the network. 6 6..5 5..1...
Page 297
Stream selection stream selection transmission mode transmission mode stream x profile stream x profile line load line load this screen contains the parameters for specifying a profile and pattern for each stream and for specifying which measurements are made. Use the slide-out panel on the left-han...
Page 298
Frame size frame size the line load unit can be specified from percent percent, and mbps mbps. Touching off off at left-bottom stops sending the stream. The dialog box contains the following settings: line load start line load start the line load at which the ramp will start. Line load end line load...
Page 299
Burst mode burst mode stepped stepped steps the frame size from start start to end end in increments of step step. Each frame size is transmitted for the period in seconds specified by duration duration. The following figure shows an example of frame sizes when stepped stepped is selected. If the tr...
Page 300
Duty duty frame size frame size const const: generates the bursts that the data length and the gap length are constant. When const const is selected, "burst" is displayed on multi stream slide. Number of bursts number of bursts selecting n-burst n-burst allows to set the number of the bursts to gene...
Page 301
6 6..5 5..3 3 test results test results 6 6..5 5..3 3..1 1 summary summary when you go to the test results of the ethernet monitor/generate application, the following screen is displayed. This screen contains a summary of the results of the ethernet monitor/generate test. The information includes su...
Page 302
When ethernet ethernet is selected on 'threshold' of the test setup screen, the ethernet ethernet information appears in the upper right-hand corner, shows pass/fail status summary. Touching the details details button allows you to inspect the individual pass/fail status. Transport transport display...
Page 303
Selecting the interval selecting the interval time time 6 6..5 5..3 3..3 3 oam log oam log the operation of oam log oam log screen is the same as that of bert application. Refer to oam log in bert for the operation. 6 6..5 5..3 3..4 4 event log event log touching the event log event log button in th...
Page 304
Selecting type of selecting type of results results studying a specific studying a specific result result selecting notation selecting notation if you have stopped measurement during the interval time, the measurement results of the current interval are discarded. The log of the current interval is ...
Page 305
Frame alarms alarms good frames good frames errored frames errored frames layer3 error layer3 error other frames other frames last received last received frame diff. Frame diff. Bursts frames frames burst size burst size size distribution total frames total frames size dist. Size dist. Frame size fr...
Page 306
6 6..6 6 pass through pass through ethernet pass through enables non-intrusive in-service monitoring for both fast troubleshooting and detailed analysis of the live traffic on a network. All traffic received on a port is forwarded on the other port and vice versa. Traffic between the two network dut...
Page 307
Ethernet ethernet when you select the check box, you can enable various thresholds. Touch the setup setup button to display the ethernet threshold setup ethernet threshold setup dialog box. 6 6..6 6..3 3 test results test results 6 6..6 6..3 3..1 1 summary summary when you go to the test results of ...
Page 308
6 6..6 6..3 3..2 2 event log event log touching the event log event log button in the navigation area displays the screen providing the event log data. Refer to event log of sdh/sonet/pdh/dsn bert application. 6 6..6 6..3 3..3 3 statistics statistics touching the statistics statistics button in the ...
Page 309
Test duration test duration threshold threshold traffic traffic 6 6..7 7 ping ping the ethernet ping test is a quick and easy way for testing, troubleshooting and verification of connectivity and latency. Packets are sent from the source address to the destination address and back again - allowing t...
Page 310
Graphical graphical presentation presentation graphical graphical presentation presentation frame size is protocol header and payload combined. Frame size does not include preamble and interframe gap. 6 6..7 7..3 3 test results test results the results of an ethernet ping test relate to a specific p...
Page 311
Graphical graphical presentation presentation this screen presents the detailed results of an ethernet ping test. The results relate to a specific port and consist of the round trip times of the individual ping requests. The data is shown in both list-form and in a graphical representation. The grap...
Page 312
6 6..8 8 reflector reflector in ethernet reflector mode the network master loops incoming traffic on a port swapping mac and/or ip addresses. Hdx (half duplex) is not possible in 'reflector' mode. Multicast or broadcast frame are not reflected in 'reflector' mode. 6 6..8 8..1 1 ports setup and statu...
Page 313
Total frame total frame difference difference ethernet ethernet for applications also including an otn interface, you can find a description of the setup options and status information for otn in the following section: otn setup and status please refer to the sections relevant for your current port ...
Page 314
6 6..8 8..3 3 test results test results 6 6..8 8..3 3..1 1 summary summary when you go to the test results of the ethernet reflector application, the following screen is displayed. This screen contains a summary of the results of the ethernet reflector test. The information includes such things as n...
Page 315
6 6..9 9 rfc 2544 rfc 2544 the rfc 2544 is a benchmarking methodology and defines a number of tests to be used for describing the performance characteristics of a network device (or a complete network). The network master includes several physical setups (test modes) and four different tests. Throug...
Page 316
Select test mode select test mode test selection test selection switch/router test switch/router test this screen allows you to specify your test mode and select which rfc 2544 tests to carry out. 4 different test modes are available: switch/router test router latency test end to end network test si...
Page 317
Router latency test router latency test end to end network end to end network test test both ports must be activated in order to perform the switch/router test. You cannot select 'throughput and frame loss' and 'throughput' / 'frame loss' at the same time. In this test mode, the latency-test sends o...
Page 318
Single ended network single ended network test test the end to end test can be run in several modes: by default, both ports are used for transmitting and receiving on both the 'local' unit and the 'remote' unit. Depending on the address setup the test will run either local port 1 > remote port 1, an...
Page 319
Frame size (bytes) frame size (bytes) this screen allows you to configure the following parameters related to an rfc 2544 throughput test: the changes affect both port 1 and port 2 when the switch/router test mode is selected. Frame size can be specified in 3 ways. Observe that the screen layout cha...
Page 320
Line load (mbps) line load (mbps) duration duration the different test line loads used in the test are specified as a minimum (min min) and maximum (max max) - varied in intervals of the value specified in the step step field. The test always starts at maximum line load and decreases until the line ...
Page 321
6 6..9 9..2 2..3 3 frame loss frame loss only available if you have specified a frame loss test on the 'control' of the test setup screen. Touching the frame loss frame loss button in the navigation area will display the screen shown below. This screen allows you to configure the following parameter...
Page 322
This screen allows you to configure the following parameters related to an rfc 2544 throughput and frame loss test: frame size line load duration the settings for 'throughput and frame loss' are identical to the ones described in the throughput section above. 6 6..9 9..2 2..5 5 latency latency only ...
Page 323
Duration most of the settings for latency are identical to the ones described above in the throughput section. Please see the detailed descriptions in that section in addition to the latency-specific information provided here. Only run steps where other test passed only run steps where other test pa...
Page 324
Frames per burst frames per burst (burst length) (burst length) this screen allows you to configure the following parameters related to an rfc 2544 burst test: frame size frames per burst (burst length) duration frame size and duration are identical to the ones described above in the throughput sect...
Page 325
Pretest options pretest options end to end test end to end test (master side) (master side) miscellaneous miscellaneous pretest options end to end test (master side) miscellaneous throughput calculation layer selection throughput type transmit learning frames transmit learning frames when this optio...
Page 326
Throughput throughput calculation layer calculation layer selection selection throughput type throughput type graphical graphical presentation presentation the rfc 2544 test (throughput, frame loss, latency, and burst) is performed by steps by means of changing a parameter value. When selecting the ...
Page 327
This screen presents the current status of the test(s) (configured / not started configured / not started, running running, completed completed or not configured not configured). Touching the status button for a specific test will display the relevant screen with detailed results information. 6 6..9...
Page 328
Test mode test mode port 1 port 1 port 2 port 2 switch/router test port 1 tx port 2 rx port 2 tx port 1 rx end to end test port 1 tx port 1 rx port 2 tx port 2 rx router latency test single ended network test 6 6..9 9..3 3..3 3 frame loss frame loss only available if you have specified a frame loss ...
Page 329
This screen presents the results from the throughput and frame loss test. The most important columns of the tables are the varied main parameters frame size and throughput and the performance parameters frames lost and loss rate . The order of the tables will vary depending on the test mode and the ...
Page 330
6 6..9 9..3 3..5 5 latency latency touching the latency latency button in the navigation area will display the screen shown below. This screen presents the results from the latency test. The most important columns of the tables are the varied main parameters frame size and throughput and the perform...
Page 331
The most important columns of the tables are the varied main parameters burst size and frame size and the performance parameter frames lost . The order of the tables will vary depending on the test mode and the relation of the ports. Refer to the table in "throughput" subsection of "test results". 6...
Page 332
The tx tx graph shows the transmitted periods, and the rx rx graph shows the received periods. Due to latency the receiver will first see the transmitted frames some time later than when transmitter actually sent the frames (the l- period). This is also why the receiver may have more periods than th...
Page 333
6 6..10 10 rfc 6349 rfc 6349 the rfc 6349 framework for tcp throughput testing describes a practical methodology for measuring end-to-end tcp throughput in a managed ip network. For using rfc 6349 application, tcp throughput option is required to the test module. If the option has been installed, rf...
Page 334
General general site names (short, site names (short, long) long) test directions setup test directions setup cir cir this screen allows you to specify your test mode and select which rfc 6349 tests to carry out. Test port test port touch the fields to set the port number. On local side, "test port"...
Page 335
Test sequence test sequence mtu discovery mtu discovery baseline rtt baseline rtt downstream cir downstream cir: cir of incoming stream. Select the check boxes of the test defined in rfc 6349, which you wish to run. Path mtu path mtu runs a test to determine the path mtu (maximum transmission unit)....
Page 336
6 6..10 10..2 2..3 3 windows scan / throughput windows scan / throughput windows scan / throughput windows scan / throughput button in the navigation area is enabled if windows scan and throughput check box of test sequence is selected on "control" screen. The contents of the screen depend on the te...
Page 337
Appears when test mode is set to auto. The nominal window size to be used if possible. If specified window size is lower than bdp/16, a larger window size will be calculated and used automatically. Window scan window scan touch the step duration step duration field to set the duration of each steps....
Page 338
Test directions test directions graphical graphical presentation presentation select the check box if setting window size automatically. The window size is calculated from bandwidth delay product (bdp). Connection connection select the check box of the stream number to enable a connection. Destinati...
Page 339
The measurement results are displayed in white cells. Throughput and rtt throughput and rtt window size window size: the window size used for the step. Connections connections: the number of tcp connections. Threshold threshold: the threshold of the throughput. Avg throughput avg throughput: the ave...
Page 340
For example, a baseline rtt of network path is 25 ms, and average rtt across the entire transfer increases to 32 ms. Buffer delay percentage would be calculated as: buffer delay (%) = 32 - 25 × 100 = 28 25 6 6..10 10..3 3..3 3 window scan window scan touching the window scan window scan button in th...
Page 341
This screen presents the throughput results in graph or table. Touch the graph graph and table table buttons to switch between the tabular form and a graphical presentation of the results. The ideal throughput, rtt and tcp efficiency are shown in the graphical presentation. Thpt/eff thpt/eff: throug...
Page 342
This screen presents results by each tcp connection of rtt, throughput and tcp efficiency . Use the graph graph and table table buttons to switch between the tabular form and a graphical presentation of the results. Touching the button in navigation area switches the test direction of results. The r...
Page 343
6 6..11 11 sat 1564 sat 1564 service activation test is an out-of-service test used to assess the proper configuration and performance of ethernet services. The test methodology, which is described in the itu-t recommendation y.1564, applies to point-to-point and point- to-multipoint connectivity in...
Page 344
Test mode test mode site names (short, site names (short, long) long) this screen allows you to configure the test mode and other general parameters related to a service activation test . Use the radio buttons to select the relevant test mode. One-way test one-way test in this test mode, two network...
Page 345
End to end test setup end to end test setup bit rate realm bit rate realm remote remote: the site name for the opposite instrument. This setup is enabled when one-way test one-way test is selected. Direction direction use the check boxes to specify which directions to test. Line line use the drop-do...
Page 346
Service configuration service configuration tests tests service performance service performance test test enable/disable enable/disable service service frame starting with the first mac address bit and ending with the last fcs bit. In this realm the ethernet line rate defines the maximum combined ci...
Page 347
Profile profile use the enabled enabled check box to enable/disable the service specified in the service service field. To define a new service, select the relevant stream, specify a name in the service service field and then configure the service using the tab pages. Profile tab profile tab the pro...
Page 348
Steps steps allows you to specify the committed information rate (cir). When set to zero, the cir test is excluded. If color awareness is enabled (see below), this is the bit rate for green frames. Step duration step duration allows you to specify the test step duration. Valid setting is from 1 to 6...
Page 349
Traffic policing traffic policing select this check box to enable the traffic policing test. When enabled, you can specify a margin on the service acceptance criteria service acceptance criteria tab page and use that margin for pass/fail evaluation during the service configuration test. The test wil...
Page 350
Allows you to specify the maximum acceptable frame transfer deviation in ms (mean). Frame loss rate frame loss rate allows you to specify the maximum acceptable frame loss rate. Avail avail allows you to specify the minimum acceptable availability percentage. Color aware tab color aware tab the colo...
Page 351
Emix emix allows you to set up a repeating frame size pattern. The pattern must consist of at least 1 frame size and at most 16. Touching emix sequence emix sequence field opens the dialog box. Frame size is protocol headers and payload combined. Frame size does not include preamble and interframe g...
Page 352
6 6..11 11..2 2..3 3 advanced advanced include addresses in frame filter on receiver include addresses in frame filter on receiver when enabling this function, the ethernet frames which their destination addresses match to following items will appear on the streams screen. Src mac src ip vlan id src...
Page 353
Green the item and all its sub items are passing or have passed the service acceptance criteria. Yellow the gps synchronization has been lost for a following period or more. G0325a: 10 seconds mu1000090a: 1 hour ftd and fdv results could be compromised if the duration of continuous gps synchronizati...
Page 354
Test results test results the results are presented in a table and are related to a specific cir% (cir 25.00%, cir 50.00%, cir 75.00%, and cir 100%). Select the relevant cir% either by selecting the corresponding bar in the bar graph or by using the cir drop-down menu. Touching a cell in table displ...
Page 355
Test results test results select a cell in the results table to see the details. The following information is presented: ir ir shows the minimum, mean and maximum bit rate in mbps. Depending on the test setup, the bit rate is either information rate (ir). Fl fl shows the number of lost frames and th...
Page 356
6 6..12 12 traceroute traceroute the traceroute test is used to determine the route taken by packets in an ip network. The intermediate routers traversed are identified by the sending of a sequence of icmp ping packets to the desired destination, each packet with a too low time-to- live (ttl) or hop...
Page 357
Test duration test duration threshold threshold number of attempts number of attempts used to specify the maximum number of times that ping packets with each ttl value are transmitted. If no icmp type 11 or ping reply is received after this number of attempts, the test will move on to a higher ttl v...
Page 358
6 6..12 12..3 3..2 2 ieee1588v2 log ieee1588v2 log if ext. Log ext. Log is selected in ieee1588v2 screen of ethernet frame setup, the ieee1588v2 log ieee1588v2 log button appears in the navigation area. Refer to ieee1588v2 log in "bert" for the operation. 6 6..12 12..3 3..3 3 event log event log tou...
Page 359
6 6..13 13 sync test sync test sync test application provides one pulse per second (1pps) measurement and one way delay (owd) measurement. 1pps measurement measures phase difference between the 1pps signal under test and the reference 1pps signal. Owd measurement measures the time error of ptp packe...
Page 360
Measurement result example measurement result example n n 1 2 3 4 5 6 δ δ n n 0.1 0 0.05 0 0.2 0 deviation deviation 0.1 0 0.05 0 0.2 0 phase error phase error 0.1 0.1 0.15 0.15 0.35 0.35 the difference between two bnc cable lengths makes time difference of 1pps signals. Therefore it affects the pha...
Page 361
Δms: the cable delay in direction from dut (master) to network master (slave). Te4= (delay_request owd) − Δsm Δsm: the cable delay from network master (slave) to dut (master). Δms=Δsm is assumed in owd measurement. This value can be set at ethernet ethernet cable correction cable correction in contr...
Page 362
Interval length interval length refer to " control in bert test setup subsection for the operation. Measurement period measurement period allows you to set the time from the measurement start to the stop. Following values are listed in the pull-down menu. 100 sec 100 sec, 1000 sec 1000 sec, user def...
Page 363
1pps threshold 1pps threshold one way delay one way delay threshold (owd) threshold (owd) allows you to set a correction value of the delay time in ns unit that is caused by the ethernet cable length between the mt1000a and the instrument under test. This value is used to correct the measurement res...
Page 364
1pps te 1pps te packet te packet te allows to set the threshold range of follow_up owd. Delay req. Owd delay req. Owd allows to set the threshold range of delay_request owd. 6 6..13 13..3 3 test results test results 6 6..13 13..3 3..1 1 summary summary touching the summary summary in the navigation ...
Page 366
Zoom zoom to zoom in, select a zoom area directly in the graph area by drawing a rectangle with a finger or the stylus (delivered with the instrument). When releasing the finger or stylus, the graph area zooms in to show the selected part of the graph. To zoom out, use the view settings below the gr...
Page 367
Zoom zoom in this screen, the one way delay test results are displayed as a graph, showing the positions of a time error over time. Csv export csv export outputs measurement results in csv format. Content content select the contents corresponding to the test to display. Sync sync: displays the one w...
Page 368
Selecting the interval selecting the interval time time used to set the y-scaling of the view. The maximum amplitude of the plot always originates from the zero line. In general, you use direct touch-manipulation of the graph area to zoom in and use the controls to zoom out. 6 6..13 13..3 3..4 4 eve...
Page 369
Selecting type of selecting type of results results studying a specific studying a specific result result selecting notation selecting notation if you have stopped measurement during the interval time, the measurement results of the current interval are discarded. The log of the current interval is ...
Page 370
Si prefix si prefix - e.G. 71.892 k (k means "kilo") engineering engineering - e.G. 71.892e3 scientific scientific - e.G. 7.1892e4 results results the result items varies depending on the configuration in ports setup screen. Frame results alarms alarms good frames good frames errored frames errored ...
Page 371
7 7 otn applications otn applications this chapter describes the graphical user interface (i.E. Screens, sub-screens and major dialog boxes) related to otn-only applications. Sub-screens and dialogs are described under the main screen from which they are activated/launched. The following setting and...
Page 372
Transmitter transmitter 7 7..1 1 otn setup and status otn setup and status an otuk otuk button in the navigation area of the ports setup ports setup screen gives you access to the otn setup for the transmitter and/or receiver of the currently selected port. Otn (optical transport networking) provide...
Page 373
Mode mode clock configuration clock configuration transceiver transceiver select the transmission mode. Off off: otuk frame is not transmitted. Normal normal: transmits otuk frames generated in the network master. Through through (pass through mode):transmits the received data. Oh overwrite oh overw...
Page 374
Follows follows frame setup frame setup note that the changes you make will be reflected in the text displayed in the otuk button in the navigation area. To make the port 2 transmitter follow the port 1 transmitter (i.E. Copy its settings), touch the right-most button in the navigation area and sele...
Page 375
Gfp-f gfp-f only displayed when the client signal is ethernet. Touch the gfp-f gfp-f button to launch a dialog box where you can to select parameters. The dialog box is described in the gfp-f section. Gfp-t gfp-t only displayed when the client signal is gbe. Touch the gfp-t gfp-t button to launch a ...
Page 376
For the otn application prbs prbs: prbs null null: null for the ethernet +otn application gbe gbe: giga bit ethernet (1.25 gbit/s) 10gbe 10gbe: 10 giga bit ethernet (10.3125 gbit/s) ethernet ethernet: variable rate for the sdh/sonet/pdn/dsn +otn application stm64(async) stm64(async): synchronous tra...
Page 377
Fas fas mfas mfas applicable when there are three levels of multiplexing. Defines into which higher order odu is multiplexed. None none odtu01 odtu01 : supports 1.25g tributary slot (ts). 7 7..1 1..1 1..4 4 overhead overhead touching an oh oh button in the setup area of the ports setup ports setup s...
Page 378
Sm sm sm consists of the following parameters: tti byte (trail trace identifier) bip-8 byte (bit interleaved parity level 8 code) 3rd byte: bits 1-4: bip violations (bei/biae) bit 5: signal fail status (bdi) bit 6: frame alignment error (iae) bits 7-8: reserved for future use the tti byte and 3rd by...
Page 379
Gcc0-gcc2 gcc0-gcc2 tcm1-tcm6 tcm1-tcm6 3rd byte bit 5: bdi 3rd byte bit 5: bdi bdi (backward defect indication) is set to "1" to indicate a signal fail status, otherwise it is set to "0". 3rd byte bit 6: iae 3rd byte bit 6: iae iae (incoming alignment error) is set to "1" to indicate a frame alignm...
Page 380
Ftfl ftfl bits 1-4 bits 1-4 bip violations bip violations 0000 0000 0 0001 0001 1 0010 0010 2 0011 0011 3 0100 0100 4 0101 0101 5 0110 0110 6 0111 0111 7 1000 1000 8 1001 to 1111 1001 to 1111 0 3rd byte bit 5: bdi 3rd byte bit 5: bdi bdi (backward defect indication) is set to "1" to indicate a signa...
Page 381
Pm pm both messages (forward and backward) consist of the following parameters: fif (fault indication field) fif (fault indication field) byte byte fault indication fault indication 0x00 0x00 no fault 0x01 0x01 signal fail 0x02 0x02 signal degrade 0x03 to 0xff 0x03 to 0xff reserved oif (operator ide...
Page 382
Aps/pcc aps/pcc bits 1-4 bits 1-4 bip violations bip violations 0000 0000 0 0001 0001 1 0010 0010 2 0011 0011 3 0100 0100 4 0101 0101 5 0110 0110 6 0111 0111 7 1000 1000 8 1001 to 1111 1001 to 1111 0 3rd byte bit 5: bdi 3rd byte bit 5: bdi bdi (backward defect indication) is set to "1" to indicate a...
Page 383
Psi psi bits 1-4 bits 1-4 meaning meaning 0000 0000 nr (no request) 0001 0001 dnr (do not revert) 0010 0010 rr (reverse request) 0011 0011 reserved 0100 0100 exer (exercise) 0101 0101 reserved 0110 0110 wt (wait-to-restore) 0111 0111 reserved 1000 1000 ms (manual switch) 1001 1001 reserved 1010 1010...
Page 384
Psi value psi value payload type payload type 0x0a 0x0a stm-1 mapping into opu0 0x0b 0x0b stm-4 mapping into opu0 0x0c 0x0c fc-100 mapping into opu0 0x0d 0x0d fc-200 mapping into opu1 0x0e 0x0e fc-400 mapping into opuflex 0x0f 0x0f fc-800 mapping into opuflex 0x10 0x10 bit stream with octet timing m...
Page 385
7 7..1 1..1 1..5 5 tp/ts tp/ts touching a tp tp button on the ports setup ports setup screen launches the tp/ts tp/ts dialog box. Note that the contents and layout of the dialog box depends on which higher order type has been selected. This dialog box allows you to define otuk frame mapping. Main tp...
Page 386
7 7..1 1..1 1..7 7 gfp-f gfp-f gfp-f means frame-mapped generic framing procedure, defined by itu-t rec. G.7041/y.1303. When otn layer is added to ethernet applications, gfp-f gfp-f button appears in the setup area of the ports setup ports setup screen if client signal is selected to ethernet ethern...
Page 387
Receiver receiver transceiver transceiver this screen allows you to make the physical setup of the receiver in otn mode. It can also be used to inspect the current status of the selected port by the button in navigation area. The configuration options available in the setup area of the screen are de...
Page 388
Follows follows frame setup frame setup this screen allows you to configure otuk frame of the currently selected receiver. It can also be used to inspect the current status of the selected port in a separate screen. To setting up the otu frame, touch mapping mapping button at first. Then select the ...
Page 389
Only displayed when the frame mapping is set to multiplexing. Touch the msim detection msim detection button and use the launched dialog box to set the detection method of msim. The dialog box is shown and described in the msim detection section. Configure configure only displayed when the client si...
Page 390
Tti detection tti detection tti detection allows you to select the detection method for sm, pm, and tcm1- 6. Off off disables the tti (trail trace identifier) detection. Sapi sapi (source access point identifier) dapi dapi (destination access point identifier) sapi and dapi sapi and dapi sapi, dapi ...
Page 391
Physical status physical status alarm/error status alarm/error status capture/monitor capture/monitor status status tx data tx data : expected msi are copied from oh preset data. Received data received data: expected msi are set from received msi data. 7 7..1 1..3 3 status information status informa...
Page 392
Rx rx tx tx this screen presents detailed information about the current physical status of the optical signal. Signal level signal level shows the input level of an optical signal. A lamp icon indicates the los state. Frequency frequency shows the input signal frequency and the deviation of the inpu...
Page 393
Level-specific alarms level-specific alarms this screen contains detailed alarm and error information related to the otn layer. Status is indicated by the use of colored lamp icons . If the oduk is multiplexed, touch the relevant otu/oduk level button. Alarms otu alarms los los: loss of signal. Otu-...
Page 394
Pattern error pattern error: bit error detected in the payload tcm errors tcmi-bip8 tcmi-bip8: bit interleaved parity 8 tcmi-bei tcmi-bei: backward error indication (i=1 to 6) gmp errors crc8 error crc8 error: crc8 error occurred crc5 error crc5 error: crc5 error occurred inc over inc over: c m (t) ...
Page 395
Refreshing refreshing information information displaying detailed displaying detailed information information this screen shows otu/odu/opu oh capture data for one frame at time. Use the level level drop-down menu to select which multiplexing level to display. For a description of the frame structur...
Page 396
A tributary scan detects errors and alarms over multiple tributary ports depending on the current mapping settings at the receiver port. The screen displayed by the tributary scan tributary scan button can be used to acquire the tributary status information. The screen contains the following buttons...
Page 397
Module present module present transceiver transceiver information information power monitor power monitor errors and alarms detected at the selected channel. Touching the button in green does not launch the dialog box. To change tp to scan, touch the scan scan button. Tributary scan results are clea...
Page 398
Alarms/errors/ alarms/errors/ others others select the port to insert errors, and the stimuli type. The settings items vary depending on the selected stimulus type. Otn otn: inserts errors or alarms related the otn overhead or fec. Otn frequency otn frequency: adds the frequency offset to the otu bi...
Page 399
Gmp gmp 1. Select the level level to insert errors. 2. Select the error item error item. 3. Touch the error bits error bits field to edit bits. 4. Touch the error insert error insert icon. The error is inserted once by touching the icon. Gfp gfp 1. Select the error item error item. The available opt...
Page 400
A. Touch the sub-row sub-row field to set the sub-row. B. Insertion mode insertion mode is fixed to "single". Touch the error insert error insert icon. The error is inserted once by touching the icon. For o.182 poisson, refer to the white paper on anritsu homepage: fec efficiency new test method - r...
Page 401
7 7..2 2 aps aps the aps (automatic protection switching) test measures the switching time in protecting the system from failure switching time is defined below. The start and stop trigger can be selected independently. Trigger event can be selected from the high order otu and odu. The pass/fail thr...
Page 402
This screen contains the parameters for setting up the threshold values for errors and pass/fail status. Start trigger, stop trigger start trigger, stop trigger use the drop-down menu(s) to select the appropriate trigger. Start and stop triggers include the following: any errors any errors, lof lof,...
Page 403
The following information is displayed: start trigger stop trigger average switching time : average time of switching max. Time : maximum time of switching threshold : the threshold value used in the test 7 7..2 2..3 3..2 2 detailed detailed touching the detailed detailed button in the navigation ar...
Page 404
Summary field summary field list-form information list-form information graphical graphical presentation presentation consists of the minimum, maximum, and average automatic switching times in milliseconds, the specified threshold value, the number of measurements. Presents the automatic switching t...
Page 405
7 7..3 3 bert bert the bit error rate test (bert) described in this section is applicable for otn interfaces. 7 7..3 3..1 1 ports setup and status ports setup and status the first step in running an application is to set up the port interfaces. This is done on the ports setup ports setup screen, whi...
Page 406
This screen allows you to configure the test mode and other general parameters related to the test. Interval length interval length allows you to specify the duration of the bert intervals. The drop-down menu contains the following values: 1 second 1 second, 2 seconds 2 seconds, 5 seconds 5 seconds,...
Page 407
Performance performance parameters parameters the network master's memory size (the file size of measurement results) is 64 mbytes per one port. The result file size is less than 64 mbytes because it is compressed when saving to the file. Estimate of test duration estimate of test duration contains ...
Page 408
Pattern errors pattern errors transport transport set the limit of sesr (severely errored seconds ratio). Ses (severely errored second) is a one-second period which contains 15% or more errored blocks or at least one defect. Section objective (bber) section objective (bber) set the upper limit of bb...
Page 409
Evaluation item evaluation item use the drop-down menu to select the item to evaluate. If selecting other than any alarm or error any alarm or error, another menu appears. Evaluation type evaluation type select the relevant type. Pass & fail threshold pass & fail threshold touch the left-hand number...
Page 410
Selecting the interval selecting the interval time time pattern error insertion pattern error insertion select the check box to enable the pattern error insertion. Select insertion mode to single single or rate rate. When single single is selecting, touch alarm/error insert icon in the application t...
Page 411
Selecting type of selecting type of results results selecting notation selecting notation time format if you have stopped measurement during the interval time, the measurement results of the current interval are discarded. The log of the current interval is not displayed in back back field. In this ...
Page 412
Otn performance measurement items otn performance measurement items this paragaraph describes the performance result items. Eb (errored block) is defined as: a block in which one or more bits are in error otn performance parameters otn performance parameters items items definition definition ses sev...
Page 413
Example of unavailable time detection pass/fail is judged after the time period set at performance test parameters on the control screen has elapsed. Bert bert 413 413.
Page 414
Test condition test condition 7 7..4 4 rtd rtd the round-trip delay (rtd) time is the duration time of the network and the network equipments. Network master measures rtd using a trigger injected in odu frame. At first, network master transmits the trigger signal. Network master measures the rtd by ...
Page 415
Threshold threshold 7 7..4 4..2 2..2 2 threshold threshold touching the thresholds thresholds button in the navigation area displays the following screen. This screen allows you to configure the rtd test conditions for the currently selected port(s). Maximum limit maximum limit allows you to specify...
Page 416
Summary field summary field list-form information list-form information graphical graphical presentation presentation minimum, average and maximum rtd in micro seconds threshold value 7 7..4 4..3 3..2 2 detailed detailed touching the detailed detailed button in the navigation area will display the s...
Page 417
8 8 cpri/obsai applications cpri/obsai applications this chapter describes the graphical user interface (i.E. Screens, sub-screens and major dialogs) related to cpri (common public radio interface) and obsai (open base station architecture interface) applications. Sub-screens and dialogs are describ...
Page 418
8 8..1 1 cpri/obsai setup and status cpri/obsai setup and status cpri (common public radio interface) is an interface designed for the communication inside the base station used for the mobile radio communications. Obsai (open base station architecture initiative) defines the architecture of the cel...
Page 419
Port mode port mode line rate line rate obsai line bit rates obsai line bit rates bit rate bit rate (mbaud) (mbaud) multiplexer × multiplexer × base bit rate (mbaud) base bit rate (mbaud) 768 1 × 768 1536 2 × 768 3072 4 × 768 6144 8 × 768 the cpri/obsai uses the optical ports. Mu100010a connector pa...
Page 420
Clock configuration clock configuration transceiver transceiver content content pattern pattern use the drop-down menu to select the clock source. This is fixed to received received when the port mode is set to through through. Timing source internal internal: internal clock of the module external e...
Page 421
Cpri link cpri link physical status physical status alarm/error status alarm/error status set the cpri link conditions, if content content is set to "cpri link" and port mode port mode is set to "normal". Start up start up enabled enabled: the line rate, protocol version, and c&m channel will be dec...
Page 422
Capture/monitor capture/monitor status status at the bottom of the status area, a button that gives you access to the monitor information by touching the button, you can launch the transceiver information display. 8 8..1 1..3 3..2 2 physical details physical details touching the topmost summary box ...
Page 423
This screen contains detailed alarm and error information related to the cpri/obsai interface. Status is indicated by the use of colored lamp icons . Remote remote and link link are displayed only when the content is set to cpri. Alarms signal loss signal loss: this lights in red when the optical si...
Page 424
Alarms/errors/ alarms/errors/ others others link state and port role appear when start up is set to enabled enabled. Rx protocol version hdlc rate pointer tx protocol version hdlc rate pointer 8 8..1 1..3 3..4 4 transceiver transceiver refer to transceiver in "ethernet setup and status". 8 8..1 1..4...
Page 425
3. Select the insertion insertion. Off off: turns off inserting errors. Manual manual: inserts the specified number of errors if you touch the error insert icon. Touch the burst length burst length field to set the number of errors to insert. 1e-04 1e-04 to 1e-10 1e-10: inserts errors at the specifi...
Page 426
8 8..2 2 bert bert this section describes the bit error rate test (bert) that is applicable to cpri/obsai interfaces. For bert of otn interface, refer to bert in "otn application". 8 8..2 2..1 1 ports setup and status ports setup and status after the application is launched, first configure the port...
Page 427
Performance performance parameters parameters delay delay allows you to specify when the measurement is started. Immediate immediate: starts the measurement when you touch the start start button. Start at start at: starts the measurement at the time specified in the start at start at field on the ri...
Page 428
Aps aps if selecting check box, port setup is changed as following: content: cpri link error insertion item: lcv the check box will be cleared if content has changed to other options. Threshold threshold allows you to specify a threshold value of round trip delay in micro seconds (μs). 8 8..2 2..2 2...
Page 429
Statistics category statistics category transport transport pattern pattern pattern error insertion pattern error insertion refer to thresholds of bert section in "sdh/sonet/pdh/dsn applications". 8 8..2 2..3 3 test results test results 8 8..2 2..3 3..1 1 summary summary when you go to the test resu...
Page 430
Summary field summary field list-form information list-form information graphical graphical presentation presentation off off: stops the error insertion. Manual manual 1e-04 1e-04 to 1e-09 1e-09 burst length burst length if 'insertion' is set to manual manual, touch the button and set the burst leng...
Page 431
Selecting the interval selecting the interval time time this screen presents a detailed analysis of the test results. You can choose to view either the results of a specific time interval or the total results from measurement start. The results can be displayed either in table (list) form or as grap...
Page 432
Selecting type of selecting type of results results studying a specific studying a specific result result selecting notation selecting notation open the left drop-down menu in the top row of buttons to select which results you want to display on the screen. Otn - alarms/errors otn - alarms/errors ot...
Page 433
8 8..3 3 pass through pass through cpri/obsai pass through enables non-intrusive in-service monitoring. All traffic received on a port is forwarded on the other port and vice versa. Traffic between the two network dut elements is monitored as illustrated below. 8 8..3 3..1 1 ports setup and status p...
Page 434
Transport transport selecting type of selecting type of results results this screen contains a summary of the results of the cpri pass through test. Displays the results of transport test. This result appears if 'transport' check box is selected in the test setup screen. 8 8..3 3..3 3..2 2 event log...
Page 435
9 9 fibre channel (fc) fibre channel (fc) applications applications this chapter describes the graphical user interface (i.E. Screens, sub-screens and major dialogs) related to fibre channel applications. Sub-screens and dialog boxes are described under the main screen from which they are activated/...
Page 436
9 9..1 1 fibre channel setup and status fibre channel setup and status fibre channel (fc) is a high-speed network technology, commonly running at 1, 2, 4, 8, 16 and 20 gigabit per second rates. It is primarily used to connect computer data storage. The fibre channel protocol (fcp) is a transport pro...
Page 437
Port mode port mode clock configuration clock configuration transceiver transceiver 9 9..1 1..1 1 physical port setup physical port setup when the port is set up with a fibre channel interface, touching the port port button in the navigation area will display the screen shown below. This screen allo...
Page 438
Topology topology flow control flow control source source destination destination frame setup frame setup touching the interface interface button in the navigation area displays the following screen. Point to point point to point is the point to point connection. Select the login login check box to ...
Page 439
Frame setup frame setup frame setup setting is not used in fc bert. In fibre channel reflector mode you should activate connection to a fc switch, after you have selected framing as sof:header:data:crc:eof sof:header:data:crc:eof. If activating connection to a fc switch when framing is set to sof:da...
Page 440
Frame header frame header physical status physical status alarm/error status alarm/error status sof:data:eof sof:data:eof: start of frame - data - end of frame sof:header:data:crc:eof sof:header:data:crc:eof: start of frame - frame header - data - crc - end of frame content content select a predefin...
Page 441
Timing timing link link a summary consisting of the most relevant alarm/error indications is displayed constantly. 9 9..1 1..3 3..2 2 physical details physical details touching the topmost summary box in the status area of the ports setup ports setup screen opens the dialog shown below. This screen ...
Page 442
Login login alarms/errors/ alarms/errors/ others others indicates the current link status. Fabric login fabric login lamp icon lit in green when login. Port login port login lamp icon lit in green when login. 9 9..1 1..3 3..3 3 alarms and errors alarms and errors the middle summary box in the status...
Page 443
2. In the insertion insertion drop-down list, select an insertion mode. Off off: turns off inserting errors. Manual manual: inserts the specified number of errors if you touch the error insert icon. Burst / sec burst / sec: inserts the specified number of errors in one second periodic. Burst / 10 se...
Page 444
9 9..2 2 bert bert bert stands for bit error rate testing or ber testing. The bit error rate is a key parameter in assessing systems that transmit digital data from one location to another (that is, systems such as radio data links, fiber-optic data systems, ethernet etc.). 9 9..2 2..1 1 ports setup...
Page 445
Performance performance parameters parameters bert options bert options start action start action allows you to specify when the measurement is started. Immediate immediate: starts the measurement when you touch the start start button. Start at start at: starts the measurement at the time specified ...
Page 446
Traffic duration traffic duration the receiver uses a filter to determine which frames should be counted in the results. When this function is enabled, the following fields are required to match: source id destination id r_ctl (=0x00, uncategorized fc-4) type (=0xe0, vender unique type) when this fu...
Page 447
This screen contains the parameters for specifying a profile and pattern for each stream and for specifying which measurements are made. Bert bert 447 447.
Page 448
Stream profile stream profile stream measurement stream measurement bert threshold bert threshold monitoring monitoring line load line load refer to " line load in "ethernet applications" for the operation. Frame size frame size touch constant constant field to set the fixed frame size for the durat...
Page 449
Fibre channel fibre channel transport transport when you select the check box, you can enable various thresholds. Touch the setup setup button to display the fibre channel threshold setup fibre channel threshold setup dialog box. For setting example, refer to example in "ethernet threshold setup". T...
Page 450
Pattern pattern pattern error insertion pattern error insertion this screen contains a summary of the results of the fibre channel bert test. The information includes such things as number of pattern errors, average and maximum disruption time, and number of exceeded thresholds. The three dials show...
Page 451
Selecting the interval selecting the interval time time 9 9..2 2..3 3..3 3 statistics statistics touching the statistics statistics button in the navigation area displays the screen shown below. This screen presents a detailed analysis of the test results. You can choose to view either the results o...
Page 452
Selecting type of selecting type of results results studying a specific studying a specific result result selecting notation selecting notation if you have stopped measurement during the interval time, the measurement results of the current interval are discarded. The log of the current interval is ...
Page 453
Results are displayed according to your choice. Otn alarms/errors refer to results in "otn application" otn performance refer to results in "otn application" bert results ber latency jitter service disruption reflector results reflected frames reflected bytes not reflected frames not reflected bytes...
Page 454
9 9..3 3 reflector reflector in fiber channel reflector mode, the network master loops incoming traffic on a port, swapping id addresses. 9 9..3 3..1 1 ports setup and status ports setup and status the first step in running an application is to set up the port interfaces. This is done on the ports s...
Page 455
For operation, refer to control in "bert" section. 9 9..3 3..2 2..2 2 thresholds thresholds touching the thresholds thresholds button in the navigation area displays the following screen. The follow follow button appears when the port 2 settings can follow port 1. Transport transport settings appear...
Page 456
This screen contains a summary of the results of the fc reflector test. The information includes such things as number of errored frames and number of exceeded thresholds. The three dials showing utilization, errored frames and throughput results. Utilization, errored frames and throughput can be en...
Page 457
Interval or total results interval or total results touching the event log event log button in the navigation area displays the screen providing the event log data. Refer to event log of sdh/sonet/pdh/dsn bert application. 9 9..3 3..3 3..3 3 statistics statistics touching the statistics statistics b...
Page 458
Selecting type of selecting type of results results studying a specific studying a specific result result selecting notation selecting notation if you have stopped measurement during the interval time, the measurement results of the current interval are discarded. The log of the current interval is ...
Page 459
10 10 utility applications utility applications this chapter describes the applications on utilities screen of application selector. The following applications are available: scenario gps pdf viewer vip wireshark 459 459.
Page 460
10 10..1 1 scenario scenario scenario application executes applications according to the description in the scenario file. The contents of the scenario file can be edited by using the mx100003a mt1000a/mt1100a scenario editor software on the pc. If the scenario files are not loaded, only scenario ma...
Page 461
Note are defined in the scenario. They cannot be edited on the scenario manager screen. Editing the scenario editing the scenario 1. Touch the row of the scenario in the table. 2. Touch edit edit button. The edit screen appears. 3. Touching the value value field opens the dialog box. Touch the setup...
Page 462
10 10..1 1..2 2 running the scenario running the scenario when scenario is loaded, the icon appears in scenario of utilities screen. If touching the icon, the following screen is displayed. This screen displays the pass/fail results and status of the scenario execution. Select the check box for the ...
Page 463
An example of the scenario execution an example of the scenario execution save results save results 1. Touch the on application toolbar 2. Set the file name using the dialog box displayed. 3. Touch save save button. Generating the report generating the report 1. Touch the on application toolbar 2. S...
Page 464
Test time test time 10 10..2 2 gps gps gps application logs nmea format data received from the gps receiver. According to the nmea format data, the locations of satellite are displayed on the chart. 10 10..2 2..1 1 test setup test setup when you go to the test setup of the gps application, the follo...
Page 465
Sky view sky view satellites satellites this screen displays positions of satellite and the logged data. Touch a left top button to switch the result to display. Satellites satellites: displays the satellite positions by the chart and the table. Console console: displays the logged data received fro...
Page 466
Text console text console elev: elevation azim: azimuth snr: signal to noise ratio depending on the snr value, the text color varies in green, blue, or red. Console console the logged data in text data are displayed. You can save the logged data by touching icon on the application toolbar. The log d...
Page 467
10 10..3 3 pdf viewer pdf viewer pdf viewer allows you to view pdf files, for example, operation manual, report files created by the network master, etc. Opening the pdf file opening the pdf file touching the file open icon ( ) on application toolbar opens the dialog box, where you can select a pdf ...
Page 468
10 10..4 4 vip vip vip (video inspection probe) application allows you to view the edge surface of an optical fiber by using the optional accessory video inspection probe. The captured image and analysis results can be saved to files. 10 10..4 4..1 1 application toolbar application toolbar icons for...
Page 469
Probe setup probe setup g0306b video inspection probe g0306b video inspection probe replace the adaptor of the video inspection probe with one that matches the optical connector. For handling the video inspection probe, refer to the operation manual that came with the video inspection probe. Network...
Page 470
Auto functions auto functions auto file name auto file name settings settings test profile test profile select the observing fiber type. Sm pc>45 sm pc>45: single mode fiber, physical contact, return loss is more than 45 db. Sm apc sm apc: single mode fiber, angled physical contact sm pc>25 sm pc>25...
Page 471
Analyzing an image analyzing an image 1. Touch . 2. Touch . After the analysis finishes normally, the results appear in the table. If overlays on overlays on is selected, the circles showing the analysis area appear. 3. Adjust image position by touching zoom zoom buttons or pan pan buttons. The item...
Page 472
10 10..5 5 wireshark wireshark wireshark allows users to analyze captured ethernet frames. Wireshark is used to analyze the capture files. There are some restrictions on functions because ethernet interface is not connected. For example, "capture" and "telephony" menus are not available. When wiresh...
Page 473
11 11 specifications specifications 473 473.
Page 474
11 11..1 1 mt1000a mt1000a this section contains specifications for the network master pro, mt1000a (mainframe). 11 11..1 1..1 1 configuration configuration - main frame - - main frame - mt1000a network master pro - standard accessories - - standard accessories - j1565a line cord usa * 1 j1566a line...
Page 475
Internal clock internal clock ref clock input ref clock input service interface service interface aux i/o aux i/o remote control remote control input device input device lcd lcd - optional accessories - - optional accessories - b0691a hard case b0691b hard case b0720a rear cover b0729a screw 1u b073...
Page 476
Led led speaker speaker storage memory storage memory voltage voltage power consumption power consumption battery charging time battery charging time temperature range temperature range emc emc lvd lvd wireless certification wireless certification size size mass mass on, standby, charge built-in mon...
Page 477
11 11..2 2 mu100010a, 10 g multirate module mu100010a, 10 g multirate module in the following you find specifications for the network master pro mu100010a module. The mu100010a specification lists the functionality added to the basic network master pro by installing the mu100010a option. Refer to th...
Page 478
Test signal interface test signal interface simultaneous simultaneous measurement port measurement port bit rate bit rate 11 11..2 2..2 2 external interfaces external interfaces sfp/sfp+: 2 slots sff-8431, sff-8472 compliant ieee 802.3ae-2002, ieee802.3-2008 compliant rj45: 2 sockets ieee802.3-2008 ...
Page 479
Bit rate offset range of bit rate offset range of transmitter transmitter bit rate tolerance of bit rate tolerance of receiver receiver optical output optical output optical input optical input e1: 2.048 mbit/s rj-48/bnc e3: 34.368 mbit/s bnc e4: 139.264 mbit/s bnc ds1: 1.544 mbit/s rtt bantam ds3: ...
Page 480
Electrical output electrical output electrical input electrical input 1.5m/2m output 1.5m/2m balanced output bit rate refer to bit rate . Pulse mask itu-t g.703 compliant code/interface (balance) 1.544 mbits/s ami/b8zs bantam 100Ω 2.048 mbits/s hdb3 or ami rj-48 120Ω 2m to 139/45/156m output bit rat...
Page 481
Return loss return loss jitter generation jitter generation jitter tolerance jitter tolerance rx bit rate counter rx bit rate counter 1pps phase 1pps phase comparison comparison battery operating time battery operating time 2m to 139/45/156m input bit rate refer to bit rate . Code/interface 2.048,34...
Page 482
Temperature and temperature and humidity range humidity range laser safety laser safety emc emc lvd lvd size size mass mass operating: 0°c to +50°c, ≤85%rh (non-condensing) storage: -30°c to +60°c, ≤90%rh (excluding battery and ac adapter) -20°c to +50°c, ≤90%rh (including battery and ac adapter) (n...
Page 483
Internal clock internal clock external interfaces external interfaces 11 11..3 3 mu100090a high performance gps disciplined oscillator mu100090a high performance gps disciplined oscillator the following sections describe the specifications for the network master pro mu100090a module. 11 11..3 3..1 1...
Page 484
Supported signal supported signal number of receivable number of receivable channels channels synchronization synchronization accuracy accuracy (to utc time) (to utc time) power power temperature range temperature range emc emc lvd lvd size size mass mass antenna connector: sma jack feeding antenna:...
Page 485
Cable test cable test transmitter clock transmitter clock frequency deviation frequency deviation measurement measurement frequency offset frequency offset synce functionality synce functionality ieee 1588v2 ieee 1588v2 functionality functionality 11 11..4 4 measurement functionality measurement fun...
Page 486
Priority 1 priority 2 domain number clock class slave only mode time source encapsulation announce receipt timeout clock accuracy clock step mode announce interval sync interval minimum delay request interval ieee 1588 clock results: clock state announce count sync count follow-up count delay reques...
Page 487
Wan wan transmitter, receiver transmitter, receiver traffic generator traffic generator faults and changes in grand-master clock ieee 1588 messages can be captured and exported in a wireshark compatible format. Terminology sdh, sonet supported encapsulations (frame formats) ethertype ll (dix v.2) ie...
Page 488
Status, results status, results user-defined vlan id and vlan priority address configurable ip and ethernet source and destination addresses (supports ipv4 and ipv6 addressing). Fixed, dhcp, dns. Flow control generate pause frames respond to pause frames arp answer incoming arp request on/off ip fix...
Page 489
Fragmented frames oversized and undersized frames fcs errored frames error symboled frames (excluding 10gbps) code violation frames (for 10gbps) collisions (10/100 mbps half duplex) preamble violations ifg violations local fault (for 10gbps) remote fault (for 10gbps) last received vlan 1-8 (id/prior...
Page 490
Error generation error generation alarm generation alarm generation wan oh capture wan oh capture errored frames collision rate unicast frames multicast frames broadcast frames pause frames fragmented frames undersized frames oversized frames fcs errored frames ifg violations (ethernet 10/100/1000 m...
Page 491
Frame capture frame capture transceiver transceiver ber test ber test throughput throughput measurement measurement single repeat : update period 1s buffer size 1, 2, 4, 8, 16, 32, 64, 128 mb frame slicing whole frame, top 64 bytes, top 32 bytes buffer handling stop when full, overwrite capture tran...
Page 492
Service disruption service disruption measurement measurement ping test ping test traceroute traceroute ethernet oam option ethernet oam option vlan vlan ethernet mpls ethernet mpls link layer network layer data layer can be activated as part of the ber test: maximum/average service disruption time,...
Page 493
Ethernet multistream ethernet multistream rfc2544 installation rfc2544 installation and commissioning and commissioning can be added. Status indicator for detection of mpls frames and mpls-tp statistics number of mpls frames and mpls-tp frames maximum number of mpls layers detected number of streams...
Page 494
Rfc6349 tcp rfc6349 tcp throughput test throughput test service activation service activation test (y.1564) test (y.1564) physical layer excl. Preamble link layer network layer data layer average or maximum values supports connecting to iperf server. Test direction setup local -> remote remote -> lo...
Page 495
Ip channel statistics ip channel statistics all services tested simultaneously at cir duration: 15 minutes, 2 hours, 24 hours or customer programmable results: pass/fail indication ir (maximum/minimum/average) fl (count/flr) ftd and fdv (maximum/minimum/average/current (during measurement)) avail (%...
Page 496
Sync test sync test reflector mode reflector mode ipv4 bytes ipv4 throughput ipv4 header bytes ipv4 header errors ipv6 statistics ipv6 packet count, rate ipv6 bytes ipv6 throughput ipv6 header bytes tcp/udp statistics tcp/udp packets, rate tcp/udp bytes tcp/udp throughput tcp/udp errored packets the...
Page 497
Number of ports number of ports transmitter clock transmitter clock frame format frame format measurement measurement parameter parameter sdh mappings sdh mappings sync owd follow up owd delay req. Owd 11 11..4 4..2 2 sdh/sonet/pdh/dsn sdh/sonet/pdh/dsn sonet/sdh switchable. Max. 2 reference clock i...
Page 498
Dummy channel dummy channel handling handling test patterns test patterns preset data preset data tandem connection tandem connection frequency offset frequency offset alarm insertion alarm insertion error insertion error insertion stm-64/stm-16/stm-4/stm-1/stm-1e - au-4 - vc-4 - tu-11 - vc-11 - ds1...
Page 499
Pointer pointer error/alarm detection error/alarm detection monitor monitor manual : burst length : 1 to 8000 (bit) (excluding pattern error) burst length : 1 to 4000 (bit) (for pattern error) rate: 1*10 -3 , 1*10 -4 , 1*10 -5 , 1*10 -6 , 1*10 -7 , 1*10 -8 , 1*10 -9 , 1*10 -10 the available highest ...
Page 500
Pointer analyze pointer analyze oh capture oh capture transceiver transceiver through mode through mode aps aps deviation: ppm (resolution: 1 ppm) bit rate: bit/s pointer value: au-ptr, tu-ptr element : negative, positive graph : pointer movement item soh: 64 frames poh: 64 frames pathtrace: j0/j1/j...
Page 501
Delay measurement delay measurement sdh performance sdh performance measurement measurement tributary scan tributary scan sonet mappings sonet mappings dummy channel dummy channel handling handling test patterns test patterns measurement mode : single, repeat measurement period : 0.5, 1, 2, 5,10 s m...
Page 502
Preset data preset data tandem connection tandem connection frequency offset frequency offset alarm insertion alarm insertion error insertion error insertion 1:7, 2 in 8 user pattern : 32 bit, 2048 bit oh preset data toh : all bytes except b1, b2, h1, h2 and h3 byte sts-3c/sts-1 poh : all bytes exce...
Page 503
Pointer pointer error/alarm detection error/alarm detection monitor monitor pointer analyze pointer analyze oh capture oh capture sts-3c, sts-1, tu-3, vt-2, vt-1.5 test sequence : no test sequence single alternating regular + double regular + missing double alternating movement : positive negative b...
Page 504
Transceiver transceiver through mode through mode aps aps delay measurement delay measurement sonet performance sonet performance measurement measurement tributary scan tributary scan module present transceiver information alarm, wavelength and bit rate, compliance, vendor information, output contro...
Page 505
Number of ports number of ports frame format frame format frequency offset frequency offset ber test patterns ber test patterns line build out line build out alarm insertion alarm insertion 11 11..4 4..2 2..3 3 pdh pdh max. 2 non pcm frame bit rate : refer to bit rate . Framed bit rate (format) e1 2...
Page 506
Error insertion error insertion error/alarm detection error/alarm detection error performance error performance result result item e1 fas, fas and nfas, fas word, crc4, crc4 mfas, code, pattern error, cas mfas, e-bit, pattern slip, frame slip, transparent e3/e4 frame, code, pattern error, pattern sl...
Page 507
Frame format frame format transmitter clock transmitter clock through mode through mode mapping mapping ds1: cas bits, f-bit, s-bit ds3: f-bits round trip delay aps switching time (only available in case of e1 or ds1.) 11 11..4 4..3 3 otn otn 11 11..4 4..3 3..1 1 otn setup otn setup otu2, otu1e, otu...
Page 508
Otu2-odu2/opu2-odtu2.1-odu0/opu0-stm1/sts3 otu2-odu2/opu2-odtu12(pt=20,21)-odu1/opu1 -stm16(async)/sts48(async) otu2-odu2/opu2-odtu12(pt=20,21)-odu1/opu1 -stm16(sync)/sts48(sync) otu2-odu2/opu2-odtu12(pt=20,21)-odu1/opu1 -odtu01-odu0/opu0-stm4/sts12 otu2-odu2/opu2-odtu12(pt=20,21)-odu1/opu1 -odtu01-...
Page 509
Client signals client signals test pattern test pattern measurement channel measurement channel otu1-odu1/opu1-stm16(async)/sts48(async) otu1-odu1/opu1-odtu01-odu0/opu0-stm4/sts12 otu1-odu1/opu1-odtu01-odu0/opu0-stm1/sts3 otu1-odu1/opu1-prbs otu1-odu1/opu1-odtu01-odu0/opu0-prbs otu1-odu1/opu1-odtu01...
Page 510
Fec encode/decode fec encode/decode oh edit oh edit tti measurement tti measurement msim detection msim detection alarm insertion alarm insertion error insertion error insertion frequency offset frequency offset payload offset payload offset rs(255,239) described in itu-t rec. G709, no fec all otu, ...
Page 511
Alarm detection alarm detection error detection error detection justification analysis justification analysis oh capture oh capture transceiver transceiver aps measurement aps measurement 0.1 ppm step gmp -150 ppm to +150 ppm 0.1 ppm step 11 11..4 4..3 3..3 3 otn measurement otn measurement otu, odu...
Page 512
Otn performance otn performance measurement measurement tributary scan tributary scan round trip delay round trip delay port mode port mode topology topology framing framing content content alarm insertion alarm insertion error insertion error insertion link detection link detection login detection ...
Page 513
Reflector mode reflector mode port mode port mode line rate line rate clock configuration clock configuration content content pattern pattern cpri link cpri link alarm insertion alarm insertion error insertion error insertion frequency offset frequency offset alarm detection alarm detection error de...
Page 514
Link link transceiver transceiver ber test ber test pass through pass through rx protocol version, hdlc rate, pointer p tx protocol version, hdlc rate, pointer p module present transceiver information alarm, wavelength and bit rate, compliance, vendor information, output control power monitor alarm:...
Page 515
Specifications specifications 11 11..5 5 optical modules optical modules up to 2 optical modules can be installed. Correct functionality can only be guaranteed with optical modules purchased from anritsu for the mu100010a . Safety measures for laser products safety measures for laser products optica...
Page 516
Order no./ name order no./ name description description (approx. Distance) (approx. Distance) min. Input min. Input sensitivity sensitivity input input wavelength wavelength output output power power output output wavelength wavelength g0356a 8g fc/10g sr 850 nm sfp+ 8g fc/10g sr 850 nm sfp+ -11.1 d...
Page 517
12 12 support support this chapter contains information about general maintenance of the network master. It also contains information on how to obtain support or service assistance. 517 517.
Page 518
12 12..1 1 maintenance and cleaning maintenance and cleaning this section contains information about general maintenance and cleaning of the network master. 12 12..1 1..1 1 maintenance maintenance the network master does not require any regular adjustments. Using the network master in a normal envir...
Page 519
In the presence of lubricating oil mists in places at an altitude of more than 2 000 m in the presence of frequent vibration or mechanical shock, such as in cars, ships, or airplanes places with temperatures and relative humidity in the following ranges: temperature range of ≤-20°c or ≥+50°c humidit...
Page 520
12 12..2 2 calibration calibration mt1000a and mu100010a do not require any calibration in the meaning of adjustment after shipment from factory. When the mu100090a is capturing gps satellites, built-in rubidium oscillator is disciplined to the utc by using the gps signal. By this operation, 10 mhz ...
Page 521
12 12..3 3 formatting the data area in the network master formatting the data area in the network master occasionally it is required to remove customer data from network master such as after instrument rental. With software tools you can format network master internal data area. Two data areas are a...
Page 522
12 12..4 4 upgrading the software upgrading the software connect the ac adapter to the network master while updating the software. When updating the software with battery operation, make sure that there is 40% (or more) power in the battery of the network master. 12 12..4 4..1 1 installation by usin...
Page 523
12 12..5 5 support and service assistance support and service assistance in case your network master needs support or service, follow the instructions given in the sub-sections below. 12 12..5 5..1 1 before you obtain assistance before you obtain assistance to ensure fast help the anritsu or the anr...
Page 524
12 12..6 6 transporting and disposal transporting and disposal this section describes the precautions to observe when transporting and disposing of the main frame at the end of its useful life. 12 12..6 6..1 1 repackaging repackaging use the original shipping materials, or an approved optional trans...
Page 525
12 12..7 7 special information special information 12 12..7 7..1 1 equipment certificate equipment certificate anritsu corporation certifies that this equipment was tested before shipment using calibrated measuring instruments with direct traceability to public testing organizations, and was found t...
Page 526
In places where abnormal power voltages (high or low) or instantaneous power failures occur in places where condensation occurs in the presence of lubricating oil mists in places at an altitude of more than 2,000 m in the presence of frequent vibration or mechanical shock, such as in cars, ships, or...
Page 527
12 12..8 8 software license document software license document network master comes with the package software as described in following table. Note, however, that the package software is not covered by the anritsu software license agreement. Go to the following website for details of each license. H...
Page 528
Name name version version license license software license (continued) software license (continued) gmp 5.1.3-2 lgpl3 gnutls 3.2.7-1 gpl3,lgpl2.1 graphite 1:1.2.4-1 lgpl,gpl,custom gsettings-desktop-schemas 3.10.1-1 gpl gtk2 2.14.3 lgpl gtk3 3.10.6-1 lgpl gzip 1.6-1 gpl3 harfbuzz 0.9.24-1 mit hicolo...
Page 529
Name name version version license license software license (continued) software license (continued) libx11 1.6.2-1 custom libxau 1.0.4 mit libxaw 1.0.4 mit libxcb 1.9.1-2 custom libxcomposite 0.4.4-1 custom libxcursor 1.1.14-1 custom libxext 1.0.4 mit libxfixes 4.0.3 mit libxfont 1.3.3 mit libxft 2....
Page 530
Name name version version license license software license (continued) software license (continued) poppler-data 0.4.6-1 custom,gpl2 poppler-qt4 0.26.3-1 gpl portaudio 19_20111121- custom portmap 5beta bsd qt4 4.8.2 gpl3,lgpl,fdl,custom qwt 6.1.0rc3 lgpl randrproto 1.2.2 mit readline 6.2.004-2 gpl r...
Page 531
12 12..9 9 eula license document eula license document software end-user license agreement (eula) software end-user license agreement (eula) please read this software end-user license agreement (hereafter this eula) carefully before using (includes executing, copying, registering, etc.) this softwar...
Page 532
4. Export restrictions 4. Export restrictions you may not use or otherwise export or re-export directly or indirectly this software except as authorized by japanese and united states law. In particular, this software may not be exported or re-exported (a) into any japanese or us embargoed countries ...
Page 533
12 12..10 10 ce conformity marking ce conformity marking anritsu affixes the ce conformity marking on the following product(s) in accordance with the decision 768/2008/ec to indicate that they conform to the emc and lvd directive of the european union (eu). 12 12..10 10..1 1 product model product mo...
Page 534
Or stored data is allowed. If the minimum performance level or the permissible performance loss is not specified by the manufacturer, either of these may be derived from the product description and documentation and what the user may reasonably expect from the equipment if used as intended. C. Tempo...
Page 535
12 12..10 10..5 5 ce declaration ce declaration ce conformity marking ce conformity marking 535 535.
Page 536
12 12..11 11 rcm conformity marking rcm conformity marking anritsu affixes the rcm mark on the following product(s) in accordance with the regulation to indicate that they conform to the emc framework of australia/new zealand. 12 12..11 11..1 1 product model product model model: mt1000a network mast...
Page 537
12 12..12 12 laser safety laser safety 12 12..12 12..1 1 laser safety classifications laser safety classifications class 1 indicate the danger degree of the laser radiation specified below according to iec 60825-1:2007. Class 1: lasers that are safe under reasonably foreseeable conditions of operati...
Page 538
Table 2 table 2 specifications of laser built into specifications of laser built into mu100010a mu100010a model model max. Optical max. Optical output power output power (mw)* (mw)* pulse width (s)/ pulse width (s)/ repetition rate repetition rate emitted emitted wavelength wavelength (nm) (nm) beam...
Page 539
12 12..12 12..3 3 laser radiation markings laser radiation markings figure 1: locations of laser beam aperture figure 2: locations of affixed labels laser safety laser safety 539 539.
Page 540
12 12..13 13 wireless certification wireless certification 12 12..13 13..1 1 japan mic japan mic mt1000a has obtained the certification of construction type of specified radio equipment. 12 12..13 13..2 2 north america (usa fcc and canada ic) north america (usa fcc and canada ic) this device complie...
Page 541
Les connaissances scientifiques dont nous disposons n'ont mis en évidence aucun probème de santé associé à l'usage des appareils sans fil à faible puissance. Nous ne sommes cependant pas en mesure de prouver que ces appareils sans fil à faible puissance sont entièrement sans danger. Les appareils sa...
Page 542
12 12..13 13..5 5 china srrc china srrc 12 12..13 13..6 6 indonesia sdppi indonesia sdppi mt1000a is certified sdppi wireless certification. 12 12..13 13..7 7 israel moc israel moc support support 542 542.
Page 543
12 12..13 13..8 8 mexico ifetel mexico ifetel ifetel certification number: rcpanmt14-0759 the operation of this equipment is subject to the following two conditions: 1. It is possible that this equipment or device may not cause harmful interference. 2. This equipment or device must accept any interf...
Page 544
12 12..14 14 declarations declarations 12 12..14 14..1 1 notes on export management notes on export management this product and its manuals may require an export license/approval by the government of the product's country of origin for re-export from your country. Before re-exporting the product or ...
Page 545
The product that you have purchased contains a rechargeable battery. The battery is recyclable. At the end of its useful life, under various state and local laws, it may be illegal to dispose of this battery into the municipal waste stream. Check with your local solid waste officials for details in ...

