- DL manuals
- ABB
- Server
- COM600 series
- Data Historian Operator's Manual
ABB COM600 series Data Historian Operator's Manual - Status Bar
Status bar
4.4.
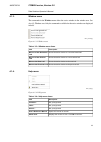
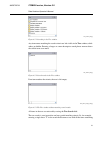
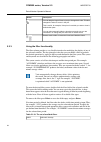
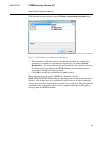
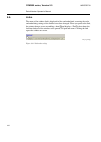
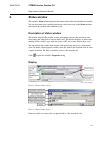
The status bar is displayed at the bottom of Vtrin.
Row_status_bar.jpg
Figure 4.4-1 Status bar
It indicates the status of Vtrin (not yet supported) and time. The time on the user’s PC
is indicated by the (
) icon and the time on the server by the (
) icon at the right-hand
end of the bar. If the system has an alarm log feature, you can set parameters for process
area-specific indicators for active and unacknowledged alarms on this row. In this case,
the area-specific priority icons indicate the priority of the alarm situation. If the icon is
colored, the log contains active alarms, and if the icon is flashing, the log contains
unacknowledged alarms.
Tree window
4.5.
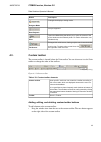
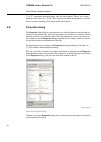
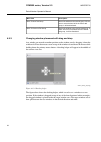
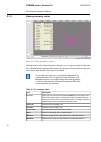
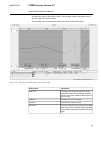
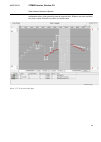
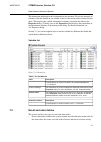
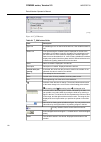
The Tree window shows the system’s windows (charts) in a hierarchical tree structure.
Tree_window.jpg
Figure 4.5-1 Tree window
The tree contains folders, which, in turn, include other folders (subfolders) and windows.
The windows display lists, tables, charts, process diagrams, and reports.
The procedures for opening and closing the Tree window, as well as moving it within
the workspace, are described in 4.7, Tree window and the Properties dialog.
27
COM600 series, Version 5.0
1MRS756739
Data Historian Operator's Manual
Summary of COM600 series
Page 1
— com600 series, version 5.0 data historian operator's manual.
Page 3
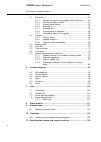
Contents: 1. About this manual .................................................................................. 7 1.1. Copyrights ...................................................................................... 7 1.2. Trademarks ..................................................................
Page 4
5.1. Plot area ....................................................................................... 47 5.1.1. Viewing the value of the graph in the tool tip box ......... 49 5.1.2. Viewing summary values .............................................. 50 5.1.3. Viewing trend values ..................
Page 5
11.1. Taking a backup of the data historian ........................................ 128 11.2. Taking a data historian online backup ....................................... 128 11.3. Restoring data historian backup ................................................ 131 index .............................
Page 6
6.
Page 7: About This Manual
About this manual 1. Copyrights 1.1. The information in this document is subject to change without notice and should not be construed as a commitment by abb oy. Abb oy assumes no responsibility for any errors that may appear in this document. In no event shall abb oy be liable for direct, indirect, ...
Page 8: Document Conventions
Document conventions 1.4. The following conventions are used for the presentation of material: • the words in names of screen elements (for example, the title in the title bar of a window, the label for a field of a dialog box) are initially capitalized. • capital letters are used for the name of a ...
Page 9: Terminology
The caution icon indicates important information or warning related to the concept discussed in the text. It might indicate the presence of a hazard which could result in corruption of software or damage to equipment or property. The information icon alerts the reader to relevant facts and condition...
Page 10: Abbreviations
Description term the smallest part of a function that exchanges data. A ln is an object defined by its data and methods. Logical node; ln a communication protocol developed by echelon. Lon a proprietary method of abb on top of the standard lon pro- tocol. Lon application guideline for substation aut...
Page 11: Document Revisions
Mrs number name of the manual 1mrs756740 com600 hmi configuration manual document revisions 1.9. History product revision document version/date document created 3.3 a/13.2.2009 document revised 3.4 b/06.11.2009 document revised 3.5 c/30.6.2011 document revised 4.0 d/31.5.2012 document revised 4.1 e/...
Page 12: Introduction
Introduction 2. Overview of com600 2.1. Com600 provides gateway functions for mapping signals between protection and control ieds in industrial or utility substations and higher-level systems. It further includes an optional webhmi that provides data and information from the substation to the users....
Page 13: 3.1.
Getting started with com600 data historian 3. The com600 data historian is a relational database designed and optimized for process information management and extensive history recording. Vtrin is a user interface client that connects to rtdb database (cpmplus history database) in the com600 compute...
Page 14
Security_warning.Jpg figure 3.1-1 security warning dialog the logon window opens: vtrin_login.Png figure 3.1-2 log on to database dialog 3. In the location drop-down menu, select the rtdb-com600 you want to connect to. The database name consists of the name of the computer or the ip address and the ...
Page 15: Logging Off From Vtrin
Logging off from vtrin 3.2. 1. Click vtrin's title bar or select exit from the database menu. 2. When logging off from vtrin, you are prompted to save the changes in each open window. General overview of vtrin user interface 3.3. When logging in, depending on the user rights, available tools are vis...
Page 16
Workspace.Png figure 3.3-1 vtrin workspace for a normal vtrin user the administrator's tree view contains maintenance tools, such as templates for various trends, and report templates. Vtrin administrator defines what is shown for normal users, for example, predefined tai preconfigured trend views. ...
Page 17: 3.4.
Workspaceadminview.Png figure 3.3-2 vtrin workspace for a vtrin administrator user detailed information about the vtrin user interface is found later in the following chapters of this manual. Quick start for creating trend views 3.4. To create a new trend view: 1. Right-click user’s definitions in t...
Page 18
The variable list opens with the variables (such as process measurements), which have been configured with sab600 for the data historian function. 5. Drag and drop variables from the list to the trend view. There are several settings to customize the trend view. For example, by default all variables...
Page 19: 3.5.
Tree. Administrator users can create objects to other levels as well. For example, to create a trend view available for all users, the administrator user can create it below the root object in the tree. In the tree view, the equipment and tags node has a structure of the substation with voltage leve...
Page 20: Vtrin Workspace
Vtrin workspace 4. The following table lists the elements in the vtrin user interface. Table 4-1 vtrin user interface elements window's heading title bar see 4.1, menu bar menu bar see 4.5, tree window and 4.7, tree window and the properties dialog tree window see 4.9, window area tab see 4.3, custo...
Page 21
Database menu 4.1.1. Menu_database.Jpg figure 4.1.1-1 database menu table 4.1.1-1 database menu items description item opens a connection to another database. Displays a logon window as described in 3.1, logging on/connecting to the database. Connect to... Saves the active window in the directory tr...
Page 22
View menu 4.1.2. View_menu.Jpg figure 4.1.2-1 view menu table 4.1.2-1 view menu items description item displays the toolbar by default under the menu bar, see 4.2, toolbar. Selected by default. Toolbar displays the custom toolbar by default under the vtrin toolbar, see 4.3, custom toolbar. Selected ...
Page 23
Window menu 4.1.3. The commands in the window menu affect the active window in the window area. See also 4.9, window area. Only the commands available for the active window are displayed in bold. Menu_window.Jpg figure 4.1.3-1 window menu table 4.1.3-1 window menu items description item moves the ac...
Page 24: Toolbar
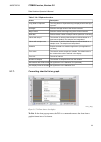
About_vtrin.Jpg figure 4.1.4-2 about vtrin dialog toolbar 4.2. By default, the vtrin toolbar is located below the menu bar. Row_toolbar.Jpg figure 4.2-1 vtrin toolbar table 4.2-1 toolbar elements description button steps backward through the window call path, activating the previ- ous window. Back s...
Page 25: Custom Toolbar
Description button changes the display to design mode. Designer mode not yet supported. Data playback opens the print dialog that allows you to print the content of the active window to the selected printer. For further information, see windows help. Print enlarges vtrin to full screen, leaving only...
Page 26
Toolbarbutton_collection_editor.Jpg figure 4.3-2 toolbar button collection editor table 4.3-1 toolbar button collection the buttons that have been defined to belong to the custom tool- bar. The buttons are listed from left to right. Members properties of the selected button. Toolbarbutton properties...
Page 27: Status Bar
Status bar 4.4. The status bar is displayed at the bottom of vtrin. Row_status_bar.Jpg figure 4.4-1 status bar it indicates the status of vtrin (not yet supported) and time. The time on the user’s pc is indicated by the ( ) icon and the time on the server by the ( ) icon at the right-hand end of the...
Page 28
Opening folders and windows to make the tree fully visible: • if the tree is not fully visible, open it by clicking next to the database icon or by clicking the icon or name of the database. To open a folder: • click next to the folder. You can also click the name of the folder. The symbol next to a...
Page 29
Opens up the window name field for editing. Changing the name of the window in the tree changes also the name visible in the window tab. In case of a trend, the default title of the trend is also changed. If the trend title is edited separately, changes in the window name field do not affect the edi...
Page 30
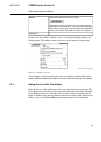
Tree_folder_menu_set_as_root.Jpg figure 4.5.1-1 setting content as root of the tree window description menu item sets the folder to act as a root of the tree. Only the contents of the folder are left visible. Set as root the whole tree structure can be retrieved by selecting reset root from the popu...
Page 31
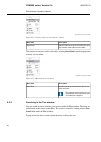
Tree_search_tes.Jpg figure 4.5-1 searching in the tree window any item names matching the search criteria are left visible in the tree window, while others are hidden. Entering a longer or a more descriptive search phrase narrows down the visible items even more. Tree_search_test.Jpg figure 4.5-2 se...
Page 32: Properties Dialog
"t" or "t" somewhere in the item name. Also, the search phrase "trend - avg" returns different results from "avg - trend". This is because the whole search phrase is searched for, not a name containing all the words in the search phrase. Properties dialog 4.6. The properties dialog displays the prop...
Page 33: 4.7.
Clicking the buttons at the top of the dialog allows you to select or deselect a data display option. When an option is selected the button is displayed in white (for example, ). When an option is deselected, the button is displayed in the same color as the background (for example, ). For more detai...
Page 34
Or • click the close button in the title bar. Enlarging and reducing the tree window and the properties dialog • click in the title bar if you want the window to cover the area of both the tree window and the properties dialog. • click in the title bar if you want to restore the window to its normal...
Page 35: 4.8.
If the window does not open as shown in the following figure, widen the vtrin on the screen. To position the window back on the bar, click anywhere outside the window. To restore the window to its location, click or point to the tree icon on the bar and then click in the title bar. The button and th...
Page 36
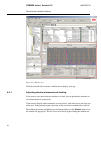
Window_area.Jpg figure 4.9-1 window area click the selected tab to activate a window and to display it on top. Adjusting window placement and docking 4.9.1. If you want to view more than one window at a time, you can position the windows in several horizontal or vertical tabs. Vtrin can only display...
Page 37
To move the active window to a new tab of horizontal (vertical) leaf using the window menu: • select move to a new horizontal leaf (move to a new vertical leaf) from the window menu. Other windows are also ordered in horizontal (vertical) tab groups. To move the active window to the following (previ...
Page 38
Description menu item moves the window to the next tab group. If there are no more windows left in the former tab group, it will be dismissed. Move to next tab group moves the window to the previous tab group. If there are no more windows left in the former tab group, it will be dismissed. Move to p...
Page 39: Icons
Window_docking_helper_center.Jpg figure 4.9.2-2 dropping the window to the center of the docking helper if dropped to the center area of the docking helper, the dragged window consumes the whole target window area and the replaced window is hidden under a tab. Window_docking_helper_sidebar.Jpg figur...
Page 40
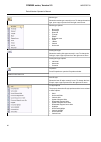
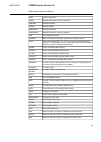
Table 4.10-1 tree icons description icon equipment model maintenance report history history of current values stored procedures table, list system configuration sql view column chart trend chart process diagram variable list variable list, binary variable variable list, integer variable variable lis...
Page 41
Description icon text variable the status icons and colors indicate the status of the variable's current value. The follow- ing table lists the icons and colors, as well as the icons depicting the direction of values. Table 4.10-3 status icons, status colors, and icons for the direction of values co...
Page 42
Table 4.10-4 chart item icons description icon icon for line plots. The color of the symbol in the icon corresponds to that of the plot and/or data point markers. The data point marker color is selectable. Line, trend icon for area plots. The color of the symbol in the icon corresponds to that of th...
Page 43
Description icon shows that an error occurred when fetching chart item data. Error indicator the following table lists other icons used in vtrin. Table 4.10-5 other icons description icon vtrin user's pc server icon for the free start and end time of an interval, used, for example, in charts. Click ...
Page 44
Description icon pointer displayed when you change the size of different areas on the screen. 44 1mrs756739 com600 series, version 5.0 data historian operator's manual.
Page 45: Charts
Charts 5. The graphical information in vtrin displays is shown in charts. Charts can contain various graphical elements, such as pictures, graphs, plots, value controls, and text blocks. This chapter describes various properties of the chart display on a trend display template. Description of charts...
Page 46: Chart Window
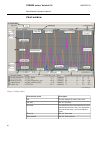
Chart window chart_window.Jpg figure 5-1 chart window description chart window terms the text displays the name of the chart. Tab see 5.1, plot area. Plot area the default title of the chart window is the name that the chart has in the tree. You can edit the name in the title area, if you have suffi...
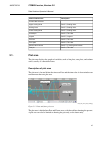
Page 47: Plot Area
Description chart window terms current date and time see 5.3, scaling limits. Upper scaling limits see 5.3, scaling limits. Scaling limits see 5.3, scaling limits. Lower scaling limits see 5.4, time bar. Locked pin see 5.2, legend. Legend see 5.4, time bar. Time bar see 5.4, time bar. Time span see ...
Page 48
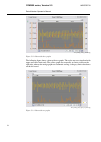
To view the values of the graph, place the pointer over the graph. The tool tip box shows the value, time stamp, and status of the data point closest to the left of the pointer (see 5.1.1, viewing the value of the graph in the tool tip box). Moving the pointer in the plot area displays the time and ...
Page 49
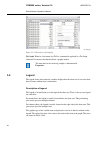
Changes the chart from a graph to a list format. See 5.1.7, converting chart to list or graph. To list changes the chart from a list to a graph format. See 5.1.7, converting chart to list or graph. To graph open chart definitions. Properties... Viewing the value of the graph in the tool tip box 5.1....
Page 50
Viewing summary values 5.1.2. Tooltip_summary_in_trend_2.Jpg figure 5.1.2-1 tool tip summary in trend click the mouse at the desired location in the plot area. A turquoise vertical trend value line is displayed in the location of the pointer. Its location is fixed in relation to the plots and it mov...
Page 51
Description item average during the time span between the start and end time. Average deviation during the time span between the start and end time. Deviation viewing trend values 5.1.3. 1. Place the pointer in the plot area and move it so that the vertical line of the crosshair pointer (assuming th...
Page 52
2. Click on the chart to select time. Turquoise vertical line appears indicating the selection. 3. Left and right arrow keys move the turquoise line from one value point to another showing new trend value and time for each point. Pointer_position_value_in_trend.Jpg figure 5.1.3-1 pointer position va...
Page 53
Table 5.1.3-1 display items description item the trend value line shows the values corres- ponding to the selected time. Trend value line the column shows the values corresponding to the selected time. Pointed time the column shows the value at the time of the selected trend value line or, if the li...
Page 54
Zoom_out.Jpg figure 5.1.4-2 zoom out zooming out 5.1.5. 1. Right-click in the plot area and select zoom out. 2. The zoom out command can be selected as long as the number of zooms in com- mands is larger than the number of zoom out commands. To return to the original state, zoom out until the zoom o...
Page 55
Table 5.1.6-1 clipboard actions description action the copy data to clipboard dialog is displayed with chart pop- up menu. Copy data to clipboard picks the average values of the chosen intervals. Averages picks the values at the beginning of the chosen intervals. Begin values picks a chosen number o...
Page 56: Legend
List_display.Jpg figure 5.1.7-2 from list to chart display to graph: when in a list format, the to list -command is replaced by a to graph - command. It converts the chart back into a graphic format. The time interval for retrieving samples is determined in properties. Legend 5.2. The legend shows d...
Page 57
The legend can be configured to display a variety of information on the variables, such as: • variable names • aliases • ids • descriptions • current values • units of current values • the names of the tables from which the values of past and future times are retrieved. In the case of line and area ...
Page 58
To edit a variable column: • select the variables in the column as instructed earlier. An arrow indicating a drop- down menu appears in the last row selected. • click the arrow to open the drop-down menu. • select a variable by clicking its name in the menu. • all the highlighted variables are now c...
Page 59
Description item removes the chart items whose rows you clicked from the plot area and from the legend in question. Remove... Opens the legend columns dialog, where you can define the data to display in the column and its order. Legend columns... Opens the chart item’s properties dialog where you ca...
Page 60
Marker type shows the marker type currently in use. To change the marker type, open a pop-up menu from the right corner arrow. Marker type options • no marker • rectangle • diamond • triangle • ellipse • diagonal cross • cross • i-beam • vertical • horizontal scaling limit type shows the scaling lim...
Page 61
Color information (item color / item secondary color / chart background color) the three color boxes show the following information (from left to right): • item color: the color in which the selected item is presented in the chart. • item secondary color: • chart background color: the color in which...
Page 62
The variable data is retrieved. As the column headings are often the same, an additional attribute related to the heading is used to specify the data source as follows: table 5.2.2-1 abbreviations used in the legend column headers abbreviations used in the legend column headers f = future p = past i...
Page 63
Description column header if trend values have been requested for the chart, the time pointed to is displayed in the column heading and the column’s rows show the corres- ponding calculated values. For linear plot styles, the trend value is created by interpolating. If step styles, the trend value i...
Page 64
Description button you can drag the legend’s items (rows) to change their order. This also changes the order of curves in the plot. This is useful, for example, if the plot of a variable you want to view is behind other plots. You can also temporarily hide the plot that covers the one you are intere...
Page 65
Arithmetic deviation adev arithmetic deviation of entire population adevp arithmetic median amedian arithmetic mode amode arithmetic variance avariance arithmetic variance of entire population avariancep time weighted average avg raw time weighted average - ignoring the invalidity of values avgraw u...
Page 66
Minimum value of a period, timestamp is the period time minpt operating time. Requires a parameter, e.G. Optime10min(>5) calculates the time the value has been greater than 5. Optime percent of good samples (0-1) perg percent of invalid samples (0-1) peri maximum value within a period minus minimum ...
Page 67
Description time identifier months, local time mon, month, months months, utc time mon_utc, month_utc, months_utc years, local time y, year, years years, utc time y_utc, year_utc, years_utc source data period lengths. E.G. If the source data is avg5min, avg2plen produces data that has been averaged ...
Page 68
• rem(x, y) = returns the remainder of x divided by y • round(x) = rounds x to closest integer value • rounda(x, y) = rounds x to y decimals, away from zero • rounde(x, y) = rounds x to y decimals, to even • sign(x) = returns 1 or -1 depending on the sign of the number • sin(x) = sine of x • sinh(x)...
Page 69: Calculated Trend
Calculated trend calculated_value.Jpg figure 5-1 calculated value you can create new variable items that are calculated from the data of the existing vari- ables. In our example, variable h is the sum of a and c. If the time span contains both past and future, the calculated variable will not be dis...
Page 70
The graphs in the chart window can have either common or individual limits. For explanations, see table 5.3-1. Individual and common scaling limits can be changed by using boxes or at the ends of the scales. The upper limits are located at the top and the lower limits at the bottom of the scale area...
Page 71
Description field the common upper scaling limit is the highest upper limit, while the common lower scaling limit is the smallest lower limit. Common limits are only displayed if they are used in one of the graphs and if no individual limits have been defined for the plot. The common limit values ca...
Page 72
Trend_scaling_limits_3_variables.Jpg figure 5.3-2 chart with three graphs the following figure shows a chart with two graphs. The scales are now visualized with upper and lower limits only. The yellow graph uses manually set limits visible on the right side, whereas the orange graph uses automatic s...
Page 73: Time Bar
Time bar 5.4. The time bar allows you to select the time range for displaying the plots of the variables. Description of time bar the time bar is displayed under the plot area. It shows the start time of the time span at the left end of the row and the end time at the right. The length of the time s...
Page 74
The time next to the pin is unlocked the time next to the pin is locked the display's update mode is determined in the following way, depending on the left and right pin: normally updated display. If the time span is changed, the time scale and the time at the left end of the time span change accord...
Page 75: Time Scroll Bar
Description button free start or end time that cannot be changed. Start time you can change the locked start or end time to view the graph at different times and to use a longer or shorter time span. A locked start or end time that can be changed. The indicator for daylight saving time is displayed ...
Page 76: Time Scale
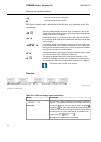
Time scroll bar time_scroll_bar_row.Jpg figure 5.5-1 time scroll bar the following table lists the time scroll bar buttons table 5.5-1 time scroll bar buttons description button the time span for which the curves are displayed moves backwards or forwards in time when you move the scroll box. The sta...
Page 77
Time_scale_whole_2.Jpg figure 5.6-1 time scale • start time shows the earliest time the chart shows. • the drop-down menus show the numerical value and the time span unit selected for the time span. You can change either the numerical value or the unit from the menus. • end time shows the latest tim...
Page 78: 5.7.
• select the desired option by clicking its row. If the selected numerical value does not match exactly with the selected unit, the numerical value is rounded to a matching value closest to the original. History updating and recollection 5.7. Values in the history tables can be updated e.G. To corre...
Page 79
Selected time span as the default values. You see them in the value boxes next to the time span start and end times. • if you change your selection, the value boxes show new default values. Historyupdating_currenthistorytrend.Jpg figure 5.7.1-1 trend of a variable from a non-periodic table descripti...
Page 80
• if you want to change the values, enter new values in the value boxes. • clear the values from the value boxes, if you want to remove the history values. You can remove the values also from the graph area pop-up menu by the selection ‘remove time span values...’ graphareapopupmenu2.Jpg figure 5.7....
Page 81
Updating non-periodic history values update or delete operation inserts new data points immediately before (-100ns) the start time and immediately after (+100ns) the end time of the time span and assigns them to the original values at those time positions, and then removes values that the time span ...
Page 82
The effect of the history update is seen as a straight line from the start value to the end value and as the additional value points just before and after the selected time span. Currenthistorytrendafterdeletion.Jpg figure 5.7.1-5 current history trend after deletion the effect of history value dele...
Page 83
Corresponding time are shown in the time bar. In this case the update function replaces or deletes the value, which is in the beginning of the highlighted area. Updating periodic history values the update procedure for values in periodic type history tables is slightly different from the updating of...
Page 84
If start and end values are different, the update function produces new values for every time period using interpolation. Averagetrendafterupdating.Jpg figure 5.7.1-7 an average value table after updating 84 1mrs756739 com600 series, version 5.0 data historian operator's manual.
Page 85
If start and end values are equal, the update function produces a value only to the beginning of the first period within the time span. Averagetrendafterupdatingpacked.Jpg figure 5.7.1-8 an average value table after updating with new values in the beginning of the time span 85 com600 series, version...
Page 86
If a value is deleted, the update function removes the values covered by the time span. Averagetrendafterdeletion.Jpg figure 5.7.1-9 an average value table after deletion 86 1mrs756739 com600 series, version 5.0 data historian operator's manual.
Page 87
The following figure shows an example of a periodic type, the sum of values. The default values suggested by the system are equal in this case. Sumtrend.Jpg figure 5.7.1-10 the sum of values 87 com600 series, version 5.0 1mrs756739 data historian operator's manual.
Page 88
In case of sum of the values, the update function produces equal values every time period covered by the time span. Sumtrendafterupdating.Jpg figure 5.7.1-11 the sum of values after updating the following figure shows an example of updating a scenario table data. The example shows three trends for t...
Page 89
Combination takes values primarily from the scenario table. If there is no value available, the value is taken from the base table, if available there. Scenariotrend.Jpg figure 5.7.1-12 scenario table data 89 com600 series, version 5.0 1mrs756739 data historian operator's manual.
Page 90
Updating the combined trend always changes the values in the scenario table, as shown in the following figure. Deletion removes the values from the scenario table as well. Scenariotrendafterupdating.Jpg figure 5.7.1-13 scenario table after updating scenario operations 5.7.2. In addition to scenario ...
Page 91
The full scenario table name for this example according to this rule is: ‘ht_sc123’. There is also a separate table ‘scenarios’ for scenario handling in the system. This table connects the scenario number to the scenario name which is shown on the legend rows and related dialog boxes. The four scena...
Page 92
Scenarioclearing.Jpg figure 5.7.2-2 scenario clearing operation scenario commitment this operation combines data from the defined scenario and base tables within the time span, and stores that data to the base table. The original data in the base table is removed. This operation concerns all variabl...
Page 93
Copy to scenario this operation copies all rows of all variables within the time span from the base table to the scenario table. The original data in the scenario table is removed before copying. Copytoscenario.Jpg figure 5.7.2-4 copy to scenario operation delete from scenario this operation removes...
Page 94
History update log 5.7.3. Each update and deletion or scenario operation generates a new row to the history update log table. A row contains information about the target table and variable, updating time, time span and corresponding values, and what was the updating operation. Historyupdatelogrow.Jp...
Page 95
Click recalculate on the menu to open the history recalculation activation dialog: historyrecalculationactivation.Jpg figure 5.7.4-2 the history recalculation activation dialog • select the history table from where (selected table included) the recollection is activated. If a variable was selected i...
Page 96: Process Diagrams
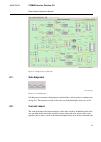
Process diagrams 6. Process diagrams present current and history values refreshed in the process-specific background as values, columns, symbols, or plots. Process diagrams are displayed in chart windows. Description of process diagrams process diagram windows are usually located in the application-...
Page 97: Sub-Diagrams
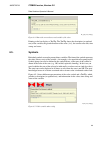
Example_process_diagram.Jpg figure 6-1 sample process diagram sub-diagrams 6.1. G_sub_diagram.Jpg figure 6.1-1 sub-diagram sub-diagrams can contain a background, a refreshed line, and area plots or column series on top of it. The direction of time of the series can be defined right, down, up, or lef...
Page 98: History Values
A current value with a flash. The icon can be displayed at all times or only when the status is not ok. Current_value_and_tooltip.Jpg figure 6.2-1 current value pointing to the value displays a tooltip. The tooltip shows the description (or updated text) of the variable, the growth direction of the ...
Page 99: Symbols
Bar_graph_and_tooltip.Jpg figure 6.4-1 bar with current history and variable of the value pointing to the bar displays a tooltip. The tooltip shows the description (or updated text) of the variable, the growth direction of the value (+/=/), the current value unit, time stamp, and status. Symbols 6.5...
Page 100: Links
Links 6.6. The name of the window link is displayed in blue and underlined, assuming the color and underlining settings of the link have not been changed. When you point to the link, the pointer changes to one resembling a hand and displays a tooltip that shows the location database of the window to...
Page 101: Lists
Lists 7. List windows show database data (attributes) in list format. Examples of lists include the variable list, alarm log, event log, maintenance log, and user log. Basically all lists are viewed in the same way. Some lists, however, can contain more properties than others. This chapter uses the ...
Page 102
Menu_list_column.Jpg figure 7-1 list menu table 7-1 list menu items description item the items are first sorted by the column you clicked to display the pop-up menu. Select an ascending or descending order. A triangle and the number 1 ( or ) is displayed in the column. The number is only displayed i...
Page 103
Description item displays the properties dialog, where you can change the appearance and functions of the list. Properties you can view and, with sufficient authorizations, change (in edit mode) item data directly in the list or in the general properties dialog by clicking the item. The data for one...
Page 104
Description icon alphabetical order click the alphabetical order button to turn alphabetical order on/off. When alphabetical order is on, the information is shown in an alphabetical order, from a to z. When alphabetical order is off, the information is shown in the same order as in the chart columns...
Page 105: List Screen
List screen 7.1. Sample list view example_list_small.Jpg figure 7.1-1 sample list view table 7.1-1 list view fields and activation buttons description field / button the row numbers are optionally shown in the beginning of the row. Row numbers string criteria that are compared with text in all colum...
Page 106
Description field / button a text selection box for text and figure columns. Enter a string mask like the one used in the search bar in the text box. String mask : enter a string mask that is compared with the column texts. The properties of string masks are explained in the search bar description s...
Page 107
Description field / button click the right side of the column heading with the pointer to change the column width to accommodate the longest text in the column. Changing the order of columns you can change the order of columns by clicking a column heading and then moving the column either to the rig...
Page 108
• click the same column again if you want to sort the items in reverse order ( ). Sorting the list items using a popup menu • the primary sort (default sort) is always selected in the list. If you want to sort the items by more than one column, select the following columns in numerical order - first...
Page 109
Different criteria on search and advanced search bars: • search bar: defines the string mask that is compared with the texts in all columns. The string mask can consist of several query strings. The query string has the following properties: • the ? Wildcard replaces one character. • the * wildcard ...
Page 110: Variable List
The search bar are combined with an and operator, that is, the displayed items must meet all the criteria listed in 7.1, list screen to use the search and advanced search bars: 1. Enter the string mask in the search bar. 2. Enter the string mask in the string mask fields in the advanced search bar (...
Page 111: Event And Alarm Tables
The information displayed in the list depends on the customer. To view the meaning of columns, click the variable in any column of the list (the current value column does not open). This displays the variable information (columns) one below the other in the properties dialog. Clicking a row in the p...
Page 112: Alarm And Event Lists
And alarm acknowledgement information. Alarm table printouts are described in 7.4, alarm and event lists. • event table displays the system events that do not have variables in the database. In this case, the event row contains all the information available to the user. Event table printouts are des...
Page 113
• process area (grouping variables by process area) • variable-specific identifications you can sort the alarms/events shown in the list based on the following criteria (see chapter 7, lists for more information on how to sort the alarms by different data fields and search them using different crite...
Page 114
Table 7.4-1 available alarm and event list columns description alarm and event list columns for descriptions of common list boxes (e.G. Search and advanced search bar , see 7.1, list screen. The descriptions of column headings are displayed at the bottom of the properties dialog. For more informatio...
Page 115
Description alarm and event list columns the variable is identified in the row with the following information: • variable • description • unit • area • process • alias variable identification data description alarm list button area icons can be configured in the status bar. Each icon indicates the t...
Page 116
Description of event log open the event log in the tree. You can create your own event logs by editing the basic event log and place them anywhere in the tree. The default event log, however, will remain in the maintenance folder. The data displayed in the event log depends on the customer. To see t...
Page 117: Status Window
Status window 8. The variable's status window displays the current value of the selected database variable. You can also remove the variable from current value processing in the status window and replace the variable with a different value. Description of status window the window displays the variab...
Page 118
T_sum.Jpg figure 8-3 t_sum status table 8-1 t_sum status fields description field a variable-type icon on the left of the title bar, if the variable’s status is ok. Type icon icon representing the variable’s status. Displayed on the left of the description. If the status is not ok, the status icon i...
Page 119: Opening The Status Window
Description field the variable’s valid states are displayed at the bottom of the window using colored icons. Status icons are described in 4.10, icons. Status icons table 8-2 t_sum activation buttons description button not yet supported. Displays the properties dialog of the variable. Makes the new ...
Page 120: Variable
Table 8-1 status window items description item opens a variable specific pop-up menu from which you can select a display type. Send to the status window of a selected variable. Status window a diary, if such is configured into the system. Diary the default current trend of a selected variable. Curre...
Page 121: Default Trends
Default trends 9. The variable's default trend enables you to, for example, use the variable list to open a chart window displaying the variable's plot. Description of default trends the default trend is a chart window defined for the variable, which displays the variable's plot. A variable can have...
Page 122: Opening A Default Trend
Opening a default trend 9.1. Menu_open_status_window_from_list.Jpg figure 9.1-1 opening a default trend to open a default trend: 1. Right-click any column other than the current value or the alarm list variable column on the variable's row in the variable list or the legend in the chart window. 2. S...
Page 123: Templates
Templates 10. A template contains certain properties and the layout of a chart window. Using the appropriate template to create a chart window enables you to quickly create a functional window complying with the agreed standard by simply adding the required graphs. Display_template.Jpg figure 10-1 d...
Page 124: 10.1.
Creating a chart window using a template 10.1. Right-click the tree's folder in which you want to create a chart window. Select new tree item and the required template. Menu_open_new_tree_item.Jpg figure 10.1-1 creating a chart window using a template table 10.1-1 templates description template sele...
Page 125
2. In the variable list, locate the variables that you want to add to the chart. The easiest way to find variables is by using search criteria in the search bar and in the selection boxes. For more information, see 7, lists, selection of items. 3. Select the variable row (by clicking) and drag it to...
Page 126
2. Drag the variable row from the chart window's legend to the legend or the graph area of the new chart window. New_variables_from_chart_window.Jpg figure 10.1-4 adding graphs from the legend of the chart window 3. Add the rest of the graphs in the same way. You can also add graphs from several cha...
Page 127
Values are retrieved from) is like those of the chart they originated from. The addition of graphs does not affect the chart window interval. New_variables_from_different_time_span_chart_window.Jpg figure 10.1-5 adding new variables if you want to change the properties of the graphs added to the cha...
Page 128: 11.
Data historian backup and restore functions 11. Taking a backup of the data historian 11.1. Ensure that the actions below are done from administrator command prompt. To backup data historian : 1. Log into the com600 computer operating system. 2. Open the command prompt window (start > run > cmd). 3....
Page 129
To manually backup data historian application: 1. Log into the com600 computer operating system. 2. Open the command prompt by choosing start>run>cmd. Make sure that you have logged in as an administrator. 3. Change the runtime directory to c:\program files\com610 gw sw\common\bin. For example, cd “...
Page 130
4. Right click the com600rtdbbackup task and select properties to enable the task and set the time interval for task execution. 5. In the following com600rtdbbackup properties dialog, select the triggers tab. 6. Double click on the daily trigger entry to setup time interval for task execution and cl...
Page 131: 11.3.
Data_hist_edit_action.Png figure 11.2-3 9. Edit the textbox for add arguments (optional) to change the intended backup location. Then click ok. 10. Click ok in the com600rtdbbackup properties to confirm the changes made to the properties of the task. 11. Run the com600rtdbbackup task. Check the back...
Page 132
132.
Page 133: Index
Index c charts ................................................................................................................ 45 description ..................................................................................................... 45 window ................................................
Page 134
Columns ......................................................................................................... 61 description ..................................................................................................... 56 lists changing order of columns .....................................
Page 135
T templates ......................................................................................................... 123 creating chart window ................................................................................... 124 using .................................................................
Page 136
136.
Page 140
— abb oy medium voltage products p.O. Box 699 fi-65101 vaasa, finland tel. +358 10 22 11 fax. +358 10 224 1094 abb inc. Medium voltage products 655 century point lake mary, fl 32746, usa tel: +1 407 732 2000 fax: +1 407 732 2335 www.Abb.Com/medium-voltage 1mrs756739 f/24.5.2017 © copyright 2017 abb....


