- DL manuals
- Anritsu
- Remote Control
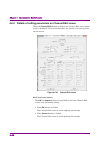
- MS2690A
- Operation Manual
Anritsu MS2690A Operation Manual
Document No.: M-W2914AE-9.0
ANRITSU CORPORATION
MS2690A/MS2691A/MS2692A
and MS2830A Signal Analyzer
Vector Signal Generator
Operation Manual
IQproducer
TM
Ninth Edition
• For safety and warning information, please read this
manual before attempting to use the equipment.
• Additional safety and warning information is provided
within the “MS2690A/MS2691A/MS2692A Signal
Analyzer Operation Manual (Mainframe Operation)”,
“MS2830A Signal Analyzer Operation Manual
(Mainframe Operation)”,
“MS2690A/MS2691A/MS2692A Option 020 Vector
Signal Generator (Operation)” and “MS2830A Vector
Signal Generator (Operation)” Please also refer to
either of these documents before using the
equipment.
• Keep this manual with the equipment.
Summary of MS2690A
Page 1
Document no.: m-w2914ae-9.0 anritsu corporation ms2690a/ms2691a/ms2692a and ms2830a signal analyzer vector signal generator operation manual iqproducer tm ninth edition • for safety and warning information, please read this manual before attempting to use the equipment. • additional safety and warni...
Page 2: Danger
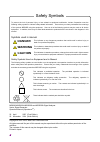
Ii safety symbols to prevent the risk of personal injury or loss related to equipment malfunction, anritsu corporation uses the following safety symbols to indicate safety-related information. Ensure that you clearly understand the meanings of the symbols before using the equipment. Some or all of t...
Page 3
Iii notes on export management this product and its manuals may require an export license/approval by the government of the product's country of origin for re-export from your country. Before re-exporting the product or manuals, please contact us to confirm whether they are export-controlled items o...
Page 4
Iv protection against computer virus infections prior to the software installation before installing this software or any other software recommended or approved by anritsu, run a virus scan on your computer, including removable media (e.G. Usb memory stick and cf memory card) you want to connect to ...
Page 5: About This Manual
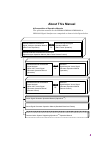
I about this manual composition of operation manuals the operation manuals for the ms2690a/ms2691a/ms2692a or ms2830a signal analyzer are comprised as shown in the figure below. Vector signal generator operation manual (iqproducer tm ) vector signal generator operation manual (standard waveform pa...
Page 6
Ii signal analyzer operation manual (mainframe operation) signal analyzer operation manual (mainframe remote control) these manuals describe basic operating methods, maintenance procedures, common functions, and common remote control of the signal analyzer mainframe. vector signal generator op...
Page 7: Table of Contents
Iii 2 3 4 5 1 appen dix index table of contents about this manual........................................ I chapter 1 overview .................................... 1-1 1.1 overview .................................................................... 1-2 1.2 functions ...................................
Page 8
Iv. Appendix a error messages ....................... A-1 index .......................................................... Index-1.
Page 9
Chapter 1 overview 1-1 1 o ver view this chapter provides an overview of the iqproducer tm for the ms2690a/ms2691a/ms2692a or ms2830a signal analyzer vector signal generator option. 1.1 overview .................................................................... 1-2 1.2 functions .....................
Page 10: 1.1 Overview
Chapter 1 overview 1-2 1.1 overview the iqproducer tm is windows application software used to generate a modulated waveform pattern to be used by the ms2690a/ms2691a/ms2692a or ms2830a signal analyzer vector signal generator option. Note that purchase of a license key corresponding to the serial num...
Page 11: 1.2 Functions
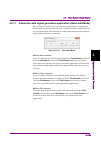
1.2 functions 1-3 1 o ver view 1.2 functions 1.2.1 signal generation application corresponding to communications system signal generation applications that generate modulation waveform patterns are provided for each communications system. For detailed information on the operations and functions of t...
Page 12: 1.2.6 Clipping Function
Chapter 1 overview 1-4. 1.2.5 time domain graph display function the iqproducer tm can read a modulation waveform pattern generated by each signal generation application and display it in the time domain graph with up to four traces. 1.2.6 clipping function this function performs clipping processing...
Page 13
Chapter 2 installation/uninstallation 2-1 2 installation/uninst allation this chapter describes how to install/uninstall the iqproducer tm to a pc. 2.1 operating environment .............................................. 2-2 2.2 installation/uninstallation procedure ......................... 2-3 2.2...
Page 14: 2.1 Operating Environment
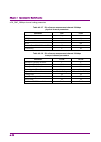
Chapter 2 installation/uninstallation 2-2 2.1 operating environment the iqproducer tm requires the following environment. Table 2.1-1 operating environment pc os windows xp/windows vista/windows 7 cpu at least 1 ghz or faster pentium iii or equivalent memory 512 mb or more hard disk 5 gb or more fre...
Page 15
2.2 installation/uninstallation procedure 2-3 2 installation/uninst allation 2.2 installation/uninstallation procedure the iqproducer tm can be installed interactively by activating the setup program. If resident virus check programs are running on your pc, exit them before activating the iqproducer...
Page 16: 2.2.1 Installation
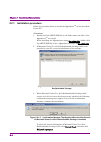
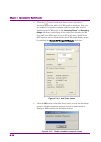
Chapter 2 installation/uninstallation 2-4 2.2.1 installation procedure follow the procedure below to install the iqproducer tm on the hard disk of your pc. 1. Double-click the setup.Exe file in the folder where the files of the iqproducer tm are stored. When installing the iqproducer tm using the se...
Page 17
2.2 installation/uninstallation procedure 2-5 2 installation/uninst allation 4. The iqproducer tm setup program starts. When “welcome to the installshield wizard for iqproducer” is displayed on the screen, click the next> button. 5. The license agreement screen is displayed. Read the license agreeme...
Page 18: 2.2.2 Upgrade
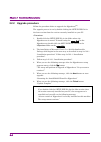
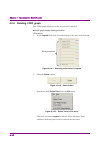
Chapter 2 installation/uninstallation 2-6 2.2.2 upgrade procedure follow the procedure below to upgrade the iqproducer tm . The upgrade process is run by double-clicking the setup.Exe file for the later version than the version currently installed on your pc. 1, double-click the setup.Exe file in th...
Page 19
2.2 installation/uninstallation procedure 2-7 2 installation/uninst allation 2.2.3 uninstallation procedure follow the procedure below to uninstall the iqproducer tm from the hard disk of your pc. 1. Click the start button on the windows task bar, point setting, and click control panel. 2. Double-cl...
Page 20
Chapter 2 installation/uninstallation 2-8..
Page 21
Chapter 3 basic operations 3-1 3 b as ic o pe ra tio ns this chapter describes the operations specifically important for operating the iqproducer tm on windows. 3.1 operations for menu .................................................. 3-2 3.1.1 operations using mouse...................................
Page 22: 3.1 Operations For Menu
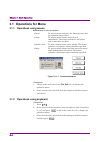
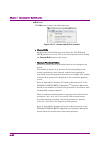
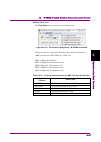
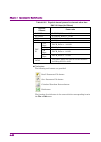
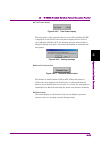
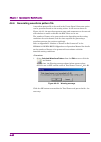
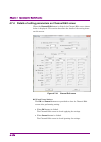
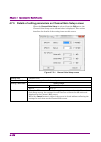
Chapter 3 basic operations 3-2 3.1 operations for menu 3.1.1 operations using mouse description for mouse operation • point: to move a mouse and place the mouse pointer onto the operation target object. • click: to press a mouse button and release it immediately. The button indicates a left button u...
Page 23
3.1 operations for menu 3-3 3 b asi c o pe ra tio ns 3.1.3 operations using up and down cursor keys 1. Select an item to be executed using the up and down cursor keys (↑/↓) and press enter . An item can also be selected by pressing the underscored character in that item on the menu bar and pull-down...
Page 24
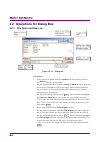
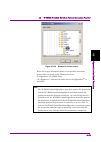
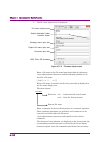
Chapter 3 basic operations 3-4 3.2 operations for dialog box 3.2.1 file open and save as… figure 3.2.1-1 dialog box 1. Select a drive or folder from the look in box (for opening a file) or the save in box (for saving a file). For the mouse operation, click the look in or save in box to open the list...
Page 25
3.2 operations for dialog box 3-5 3 b asi c o pe ra tio ns 3. Enter into the file name box the name of a file to be opened or saved. 4. When opening a file by the mouse operation, click the file to be opened from the displayed files. The name of the selected file is displayed in the file name text b...
Page 26
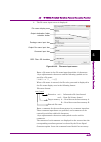
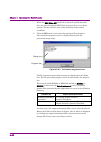
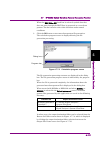
Chapter 3 basic operations 3-6. 3.2.2 entering numeric value and character string 1. When entering a numeric value, click the desired numeric value entry text box or move the cursor to the desired numeric value entry text box by pressing tab several times. Enter a numeric value from the keyboard or ...
Page 27
Chapter 4 operations for each function 4-1 4 operat ions for eac h funct ion this chapter describes the items that the users should understand when actually operating the iqproducer tm , including the names of parts in each screen, operations in the ccdf/fft graph screens, file conversion settings i...
Page 28
Chapter 4 operations for each function 4-2 4.5.7 setting the rms-value calculation range ....... 4-63 4.6 w-cdma downlink waveform pattern generation function ...................................................................... 4-64 4.6.1 activation ...................................................
Page 29
Chapter 4 operations for each function 4-3 4 operat ions for eac h funct ion 4.10 clipping function ...................................................... 4-134 4.10.1 activation ...................................................... 4-134 4.10.2 clipping setting screen ................................
Page 30: 4.1.1 Starting
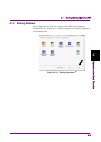
Chapter 4 operations for each function 4-4 4.1 starting/exiting iqproducer tm 4.1.1 starting software start the iqproducer tm by following the procedures below. 1. Click the start button on the windows task bar, and select all programs . Then select anritsu corporation from the displayed program gro...
Page 31: 4.1.2 Exiting
4.1 starting/exiting iqproducertm 4-5 4 operat ions for eac h funct ion 4.1.2 exiting software to exit iqproducer™ that are running, select exit on the common platform screen. In this case, a dialog is displayed to confirm stopping of each running tool. Figure 4.1.2-1 exiting iqproducer tm.
Page 32
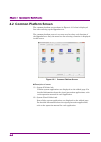
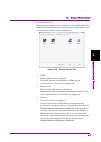
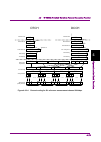
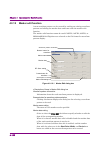
Chapter 4 operations for each function 4-6 4.2 common platform screen the common platform screen shown in figure 4.2-1 below is displayed first after starting up the iqproducer tm . The common platform screen is a screen used to select each function of the iqproducer tm . Only the menu bar for selec...
Page 33
4.2 common platform screen 4-7 4 operat ions for eac h funct ion (3) general purpose tab general purpose applications are displayed on the tabbed page. For detailed information about the signal generation applications, refer to the operation manual for each application. Figure 4.2-2 general purpose ...
Page 34
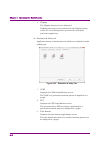
Chapter 4 operations for each function 4-8 4 clipping the clipping setting screen is displayed. Clipping processing can be performed in the clipping setting screen, for a waveform pattern generated by each signal generation application. (4) simulation & utility tab application menus of simulations a...
Page 35
4.2 common platform screen 4-9 4 operat ions for eac h funct ion (5) change instrument button provided to display the select instrument dialog box at the next startup. A message is displayed indicating that the iqproducer tm must be restarted to change the target model. (6) help button the version i...
Page 36: 4.3 Ccdf Graph Display
Chapter 4 operations for each function 4-10 4.3 ccdf graph display the complementary cumulative distribution function (ccdf) of a waveform pattern generated by a signal generation application can be displayed. In a ccdf graph, the signal peak power/average power is displayed on the x axis, and on th...
Page 37
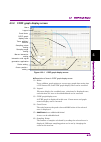
4.3 ccdf graph display 4-11 4 operat ions for eac h funct ion 4.3.2 ccdf graph display screen interaction with signal generation application menu legend trace addition/ deletion crest factor mouse interaction setting scale setting cursor position setting ccdf graph display area sampling points setti...
Page 38
Chapter 4 operations for each function 4-12 (7) sampling range the sampling range for the selected trace is displayed. A different sampling range can be set by changing the value in this text box. (8) cursor position the current cursor position is displayed. The cursor position in the ccdf graph dis...
Page 39
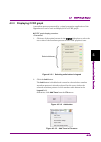
4.3 ccdf graph display 4-13 4 operat ions for eac h funct ion 4.3.3 displaying ccdf graph a waveform pattern generated by a signal generation application of the iqproducer tm can be read and displayed in a ccdf graph. Ccdf graph display procedure 1. Click one of the option buttons in the legend dial...
Page 40
Chapter 4 operations for each function 4-14 3. Click the button in the add trace screen, and select a waveform pattern for which a ccdf graph is displayed. Next, set the number of target data samples and the target data area for displaying the ccdf graph, in the sampling points and sampling range te...
Page 41
4.3 ccdf graph display 4-15 4 operat ions for eac h funct ion if the cancel button is clicked during the graph calculation, the calculation is interrupted and waveform pattern reading is stopped. When the graph calculation and waveform reading have been completed, the graph calculation progress scre...
Page 42: 4.3.4 Deleting Ccdf Graph
Chapter 4 operations for each function 4-16 4.3.4 deleting ccdf graph the ccdf graph displayed in the screen can be deleted. Ccdf graph display deleting procedure 1. In the legend field, click the radio button of the trace to be deleted. Select whichev er. Figure 4.3.4-1 selecting radio button in le...
Page 43: 4.3.5 Displaying
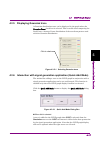
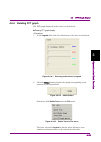
4.3 ccdf graph display 4-17 4 operat ions for eac h funct ion 4.3.5 displaying gaussian trace a gaussian distribution trace can be displayed in the graph when the gaussian trace check box is selected. This is useful when comparing the peak power / average power distribution of the waveform pattern u...
Page 44
Chapter 4 operations for each function 4-18 when clear is selected: a trace is deleted from the ccdf graph and the distribution of the generated waveform pattern is displayed when ccdf is selected from the simulation menu or the ccdf tool button is clicked after data generation by the signal generat...
Page 45: 4.3.8 Moving Graph Cursor
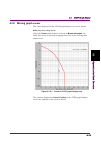
4.3 ccdf graph display 4-19 4 operat ions for eac h funct ion 4.3.8 moving graph cursor the cursor displayed in the ccdf graph display area can be moved. Moving cursor using mouse when the cursor radio button is selected in mouse interaction, the black-line cursor is moved by dragging the cursor in ...
Page 46
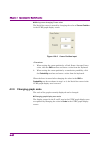
Chapter 4 operations for each function 4-20 moving cursor changing cursor value the black-line cursor is moved by changing the value of cursor position in the ccdf graph display screen. Figure 4.3.8-2 cursor position input 1. When setting the cursor position by a peak power / average power value, cl...
Page 47
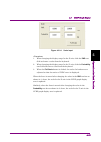
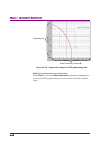
4.3 ccdf graph display 4-21 4 operat ions for eac h funct ion figure 4.3.9-1 scale input 1. When changing the display range for the x axis, click the par text field and enter a value from the keyboard. 2. When changing the display range for the y axis, click the probability text field and enter a va...
Page 48
Chapter 4 operations for each function 4-22 probability (%) peak power/avg. Power (db) figure 4.3.9-2 graph scale change in ccdf graph display area specifying display area by mouse operation when zoom is selected for mouse interaction, pointing and dragging an area in the ccdf graph enlarges the sel...
Page 49
4.3 ccdf graph display 4-23 4 operat ions for eac h funct ion 4.3.10 printing/saving graph data printing out graph display screen click print window image from the file menu to display the print screen. Set the printer, printing range, number of copies, etc., in this screen, and print out the ccdf g...
Page 50: 4.4 Fft Graph Display
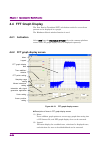
Chapter 4 operations for each function 4-24 4.4 fft graph display the fast fourier transform (fft) calculation results for a waveform pattern can be displayed in a graph. The blackman-harris window function is used. 4.4.1 activation select fft from the simulation & utility tab on the common platform...
Page 51
4.4 fft graph display 4-25 4 operat ions for eac h funct ion (3) fft graph display area an fft graph is displayed in this area. Cursor move and graph zoom-in display can be executed. (4) add/delete (trace addition/deletion) a trace can be added/deleted. (5) fft points the number of points of the x a...
Page 52: 4.4.3 Displaying
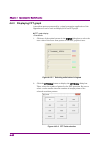
Chapter 4 operations for each function 4-26 4.4.3 displaying fft graph a waveform pattern generated by a signal generation application of the iqproducer tm can be read and displayed in an fft graph. Fft graph display 1. Click one of the option buttons in the legend dialog box to select the trace col...
Page 53
4.4 fft graph display 4-27 4 operat ions for eac h funct ion 3. Click the add button. The add button is disabled when any other waveform pattern is already specified on the selected option button. In such a case, delete the waveform pattern by clicking the delete button, or click one of other option...
Page 54
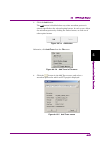
Chapter 4 operations for each function 4-28 5. Click the ok button on the add trace screen to read the waveform pattern. A graph calculation progress screen as shown below is displayed while reading the waveform pattern. When the graph calculation has completed, the fft graph display screen is displ...
Page 55: 4.4.4 Deleting Fft Graph
4.4 fft graph display 4-29 4 operat ions for eac h funct ion 4.4.4 deleting fft graph the fft graph displayed in the screen can be deleted. Deleting fft graph display 1. In the legend field, click the radio button of the trace to be deleted. Figure 4.4.4-1 selecting radio button in legend 2. Click t...
Page 56
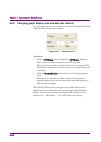
Chapter 4 operations for each function 4-30 4.4.5 changing graph display area and axis plot interval the plot interval of the x axis (frequency) on the fft graph and the data range for fft analysis can be changed. Figure 4.4.5-1 parameter input 1. Click the fft points button to display the fft point...
Page 57
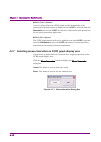
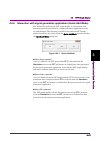
4.4 fft graph display 4-31 4 operat ions for eac h funct ion 4.4.6 interaction with signal generation application (quick add mode) the method for updating the fft graph display in conjunction with waveform pattern generation by a signal generation application can be set and changed. This function is...
Page 58
Chapter 4 operations for each function 4-32 4.4.7 selecting mouse interaction in ccdf graph display area cursor move or graph zoom-in is selected for a mouse dragging operation in the fft graph display area. Click the mouse interaction button to display the mouse interaction dialog box. Cursor the m...
Page 59: 4.4.8 Moving Graph Cursor
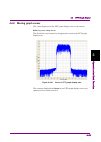
4.4 fft graph display 4-33 4 operat ions for eac h funct ion 4.4.8 moving graph cursor the cursor displayed in the fft graph display area can be moved. Moving cursor using mouse the black-line cursor moves by dragging the cursor in the fft graph display area. Figure 4.4.8-1 cursor in fft graph displ...
Page 60
Chapter 4 operations for each function 4-34 moving cursor changing cursor value the black-line cursor is moved by changing the value of cursor in the fft graph display screen. Figure 4.4.8-2 cursor input click the frequency text field and enter the frequency value from the keyboard. When the focus i...
Page 61
4.4 fft graph display 4-35 4 operat ions for eac h funct ion 4.4.9 changing graph scale the scale of the graph currently displayed can be changed. Changing graph display area scale the scales for the x and y axes in the fft graph display area are updated by changing the value in scale in the fft gra...
Page 62
Chapter 4 operations for each function 4-36 figure 4.4.9-2 graph scale change in fft graph display area specifying display area by mouse operation when zoom is selected for mouse interaction, pointing and dragging an area in the ccdf graph enlarges the selected area (enclosed by dotted lines)..
Page 63
4.4 fft graph display 4-37 4 operat ions for eac h funct ion 4.4.10 printing/saving graph data printing out graph display screen click print window image from the file menu to display the print screen. Set the printer, printing range, number of copies, etc., in this screen, and print out the fft gra...
Page 64
Chapter 4 operations for each function 4-38 4.5 file conversion on convert screen ascii-format waveform patterns generated by simulator software, digitized files created by the ms2690a/ms2691a/ms2692a or ms2830a using the digitize function, and waveform patterns formatted for the mg3700a/mg3710a/mg3...
Page 65: 4.5.1 Activation
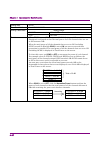
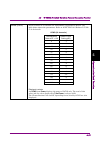
4.5 file conversion on convert screen 4-39 4 operat ions for eac h funct ion table 4.5-2 input file format and specifiable bit widths input file format selectable bit width ascii1 14/15/16 bit ascii2 16 bit ascii3 14/15 ms269x/ms2830 digitizer 14/15/16 bit mg3710/mg3740/ms269x/ms2830 (to mg3700) 14 ...
Page 66: 4.5.2 Convert
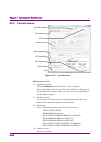
Chapter 4 operations for each function 4-40 4.5.2 convert screen input file selection file data setting file format comment entry burst data setting data conversion exit rf gate setting time domain figure 4.5.2-1 convert screen description of items (1) input file selection click the reference button...
Page 67
4.5 file conversion on convert screen 4-41 4 operat ions for eac h funct ion (5) burst data setting set the burst data. The burst data includes gap length and frame length, and they should be set respectively. For a non-burst continuous wave, set the number of samples per frame of the used communica...
Page 68
Chapter 4 operations for each function 4-42 4.5.3 selecting input file select a file to be converted. 1. Click the button in the file format box to open a pull-down menu, and select the format of the file to be input. 2. Click the reference button to open the file dialog box, and select a file to be...
Page 69
4.5 file conversion on convert screen 4-43 4 operat ions for eac h funct ion mg3700/mg3710/mg3740/ms269a (to ms2830): of the wvi and wvd files, which are waveform patterns for the mg3700a, mg3710a, mg3740a and ms269a, respectively, select the wvi file. Click the ok button to finalize the input file ...
Page 70
Chapter 4 operations for each function 4-44 figure 4.5.3-3 input file information display dialog box click the ok button to finalize the input file selection. Click the cancel button to cancel the input file selection. If the file format is changed in the file format box after selecting the input fi...
Page 71
4.5 file conversion on convert screen 4-45 4 operat ions for eac h funct ion figure 4.5.4-1 sampling rate input normalizing setting (only available when the convert screen is displayed in the ms2830a mode) to apply the rms (route mean square) value of the standard waveform pattern used by the ms2830...
Page 72
Chapter 4 operations for each function 4-46 rms iq indicates the rms value of the i/q vector when rms i and rms q are as described above. When normalization is selected, a crest factor (peak power/rms power) of 17 db can be obtained if the signal output of the ms2830a is set within the level assuran...
Page 73
4.5 file conversion on convert screen 4-47 4 operat ions for eac h funct ion when the convert screen is displayed in the ms2830a mode when reading waveform patterns, the data in the file to be converted is read, and then the rms and peak values are calculated and displayed. Click the rms value text ...
Page 74
Chapter 4 operations for each function 4-48 memory size setting (only available when the convert screen is displayed in the ms2830a mode) select whether the arb memory expansion option 256msamples is installed for the used option (ms2830a). Ms2690a/ms2691a/ms2692a or ms2830a. Specifying with option ...
Page 75
4.5 file conversion on convert screen 4-49 4 operat ions for eac h funct ion selecting spectrum (available for ascii1, ascii2, ascii3, and digitizer) click the button on the right of the spectrum box to open a pull-down menu, and select the spectrum from normal and reverse. When reverse is selected,...
Page 76
Chapter 4 operations for each function 4-50 entering comments click the comment line 1 box and enter a comment from the keyboard. The text entered here is displayed on the screen when the vector signal generator option selects the corresponding waveform. Leave this text box blank if unnecessary. The...
Page 77
4.5 file conversion on convert screen 4-51 4 operat ions for eac h funct ion configuring rf gate settings (ascii file and for digitized file conversion) to configure the rf gate settings, select the rf gate check box. The rf on/off threshold and minimum rf gate length boxes will then become availabl...
Page 78: 4.5.5 Executing
Chapter 4 operations for each function 4-52 4.5.5 executing conversion set a file before conversion (conversion source file) and a file after conversion (conversion destination file) before executing conversion. 1. Click the convert button to display the export file screen shown in figure 4.5.5-2 be...
Page 79
4.5 file conversion on convert screen 4-53 4 operat ions for eac h funct ion 3. Click the ok button to start conversion. After this, if a clipping occurs during the conversion, the warning message “the waveform pattern to be generated will be above 8191 and be clipped.” is displayed. If the ok butto...
Page 80: 4.5.6 Input File Format
Chapter 4 operations for each function 4-54 4.5.6 input file format there are the following eight types of acceptable file for the convert operation. ascii1 format file ascii2 format file ascii3 format file the digitized file generated by the ms269x digitizer (the digitizing capability of ms...
Page 81
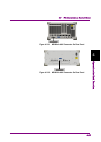
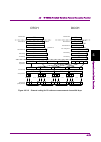
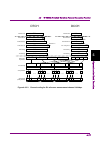
4.5 file conversion on convert screen 4-55 4 operat ions for eac h funct ion figure 4.5.6-1 ms269xa aux connector on rear panel figure 4.5.6-2 ms2830a aux connector on rear panel.
Page 82
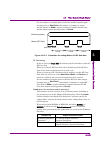
Chapter 4 operations for each function 4-56 marker data output data2 data1 rf output data3 data4 i/q1 i/q2 i/q3 i/q4 1 sample figure 4.5.6-3 marker data output and rf output rf gate this data is used to execute pulse modulation for the rf output when using a burst wave such as tdma. Each signal of ...
Page 83
4.5 file conversion on convert screen 4-57 4 operat ions for eac h funct ion waveform memory da converter 14 14 vector modulator pulse modulator 3 markers 1, 2, 3 rf gate delay 3 waveform data sample 2 sample 1 rf gate sample 3 sample 4 1 0 1 0 rf output on off on on waveform data, 14 bits 2 ch fi...
Page 84
Chapter 4 operations for each function 4-58 when 15 bit is specified the data format is delimited by a comma, in the order of i-phase data, q-phase data, marker 1, marker 2, marker 3, and rf gate. I-phase data q-phase data marker1 rf gate figure 4.5.6-6 ascii1 data format (when 15 bit is specified) ...
Page 85
4.5 file conversion on convert screen 4-59 4 operat ions for eac h funct ion // iq data comment line 0.214178,0.984242 0.187286,1.245890 0.073896,1.368888 0.091758, 1.316199 0.073896,1.368888,1 # marker1 = 1 is output. 0.091758, 1.316199,0,1 # marker2 = 1 is output. 0.248275, 1.089333,0,0...
Page 86
Chapter 4 operations for each function 4-60 ascii2 i-phase data is stored in one file, q-phase data is stored in another, and the marker data file for the ascii3 format described below is excluded. When using this format, markers 1 to 3 are set to 0, rf gate is set to 1, and marker output is all 0s....
Page 87
4.5 file conversion on convert screen 4-61 4 operat ions for eac h funct ion exists in a line where i-phase and q-phase data do not exist, it is regarded that line has no data. If the data line of a different file is described in a comment line in a certain file, that data line is ignored. A line st...
Page 88
Chapter 4 operations for each function 4-62 lines 3 and 4 are marker = 0 and rf gate = 1, respectively. 1 # corresponds to the fifth line data in the i-phase and q-phase data. 0,0 # marker1 = 0 is output and rf output becomes on. 1,0,0 # marker1 = 1 is output and rf output becomes on. 1,1,1,0 # mark...
Page 89
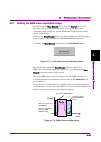
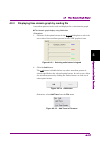
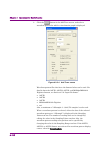
4.5 file conversion on convert screen 4-63 4 operat ions for eac h funct ion 4.5.7 setting the rms-value calculation range by displaying the time domain screen from the convert screen, the pre-conversion waveform pattern can be checked, the rms-value calculation range can be set, and the rms value o...
Page 90: Function
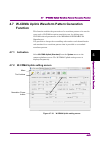
Chapter 4 operations for each function 4-64 4.6 w-cdma downlink waveform pattern generation function this function enables the generation of a waveform pattern to be used in cases such a w-cdma reception sensitivity test, by changing some w-cdma-related parameters of the mx269901a hsdpa/hsupa iqprod...
Page 91
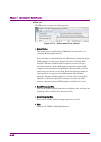
4.6 w-cdma downlink waveform pattern generation function 4-65 4 operat ions for eac h funct ion file menu the file menu contains the following items. Figure 4.6.2-2 screen when file is selected select option this menu item is enabled only if ms2830a was selected in section 4.1 “starting/exiting iq...
Page 92
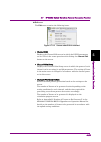
Chapter 4 operations for each function 4-66 edit menu the edit menu contains the following items. Figure 4.6.2-3 screen when edit is selected channel edit displays the channel edit screen in which the p-ccpch and dpch parameters are set. This is the same operation with clicking the channel edit bu...
Page 93
4.6 w-cdma downlink waveform pattern generation function 4-67 4 operat ions for eac h funct ion easy setup menu the easy setup menu contains the following item. Figure 4.6.2-4 screen when easy setup – w-cdma is selected selects the bit rate setting for reference measurement channels (rmc) specified ...
Page 94
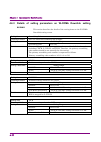
Chapter 4 operations for each function 4-68 table 4.6.2-2 physical channel powers for channels other than rmc 12.2 kbps (for rx test) physical channel power ratio p-cpich p-cpich_ec/ior = 10 db p-ccpch p-ccpch_ec/ior = 12 db sch sch_ec/ior = 12 db pich pich_ec/ior = 15 db dpc h 12.2 kbps dpch_ec...
Page 95
4.6 w-cdma downlink waveform pattern generation function 4-69 4 operat ions for eac h funct ion total power display figure 4.6.2-5 total power display the total power of the channels that are set to on (excluding ocns) is displayed in this field. If the total power displayed here is out of 0.01 db ...
Page 96: Screen
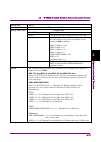
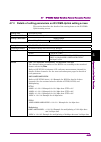
Chapter 4 operations for each function 4-70 4.6.3 details of setting parameters on w-cdma downlink setting screen this section describes the details of the setting items on the w-cdma downlink setting screen. Setting item scrambling code functional outline sets the downlink scrambling code number. S...
Page 97
4.6 w-cdma downlink waveform pattern generation function 4-71 4 operat ions for eac h funct ion setting item dpch functional outline performs settings related to downlink dpch. Setting parameters setting range on/off on or off power 40.00 to 0.00 (db), setting resolution: 0.01 db channelization cod...
Page 98
Chapter 4 operations for each function 4-72 dl_rmc_12_2kbps channel coding parameters table 4.6.3-1 dl reference measurement channel 12.2 kbps physical channel parameters parameter unit level information bit rate kbps 12.2 dpch ksps 30 slot format #i 11 tfci on power offsets po1, po2 and po3 d...
Page 99
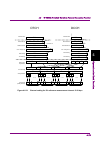
4.6 w-cdma downlink waveform pattern generation function 4-73 4 operat ions for eac h funct ion 343 dcch dtch 30ksps dpch (inluding tfci bits) conv. Coding r=1/3 0 1 14 radio frame fn=4n+1 radio frame fn=4n+2 radio frame fn=4n+3 radio frame fn=4n information data crc attachment rate matching 2nd int...
Page 100
Chapter 4 operations for each function 4-74 dl_rmc_64kbps channel coding parameters table 4.6.3-3 dl reference measurement channel 64 kbps physical channel parameters parameter unit level information bit rate kbps 64 dpch ksps 120 slot format #i 13 tfci on power offsets po1, po2 and po3 db 0 r...
Page 101
4.6 w-cdma downlink waveform pattern generation function 4-75 4 operat ions for eac h funct ion 2007 dcch dtch 120ksps dpch (inluding tfci bits) turbo code r=1/3 0 1 14 radio frame fn=4n+1 radio frame fn=4n+2 radio frame fn=4n+3 radio frame fn=4n information data crc attachment rate matching 2nd int...
Page 102
Chapter 4 operations for each function 4-76 dl_rmc_144kbps channel coding parameters table 4.6.3-5 dl reference measurement channel 144 kbps physical channel parameters parameter unit level information bit rate kbps 144 dpch ksps 240 slot format #i 14 tfci on power offsets po1, po2 and po3 db ...
Page 103
4.6 w-cdma downlink waveform pattern generation function 4-77 4 operat ions for eac h funct ion 4232 dcch dtch 240ksps dpch (inluding tfci bits) turbo code r=1/3 0 1 14 radio frame fn=4n+1 radio frame fn=4n+2 radio frame fn=4n+3 radio frame fn=4n information data crc attachment rate matching 2nd int...
Page 104
Chapter 4 operations for each function 4-78 dl_rmc_384kbps channel coding parameters table 4.6.3-7 dl reference measurement channel 384 kbps physical channel parameters parameter unit level information bit rate kbps 384 dpch ksps 480 slot format #i 15 tfci on power offsets po1, po2 and po3 db ...
Page 105
4.6 w-cdma downlink waveform pattern generation function 4-79 4 operat ions for eac h funct ion 9049 dcch dtch 480ksps dpch (inluding tfci bits) turbo code r=1/3 0 1 14 radio frame fn=4n+1 radio frame fn=4n+2 radio frame fn=4n+3 radio frame fn=4n information data crc attachment rate matching 2nd int...
Page 106
Chapter 4 operations for each function 4-80 setting item ocns functional outline sets ocns on/off. Setting parameters setting range on/off on or off type 16 codes details when ocns is set to on, the power of ocns (orthogonal channel noise simulator) is adjusted so that the total power of all the cha...
Page 107
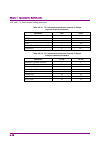
4.6 w-cdma downlink waveform pattern generation function 4-81 4 operat ions for eac h funct ion details (cont’d) ocns consists of 16-channel (for performance requirement) dpch. The table below shows the parameters. Refer to 3gpp ts25.101 (release 5) table c.12 for details. Ocns (16 channels) channel...
Page 108
Chapter 4 operations for each function 4-82 4.6.4 details of setting parameters on channel edit screen when the channel edit button is clicked, the channel edit screen shown below is displayed. This section describes the details of the setting items on this screen. Figure 4.6.4-1 channel edit screen...
Page 109
4.6 w-cdma downlink waveform pattern generation function 4-83 4 operat ions for eac h funct ion setting item p-ccpch edit functional outline performs settings for p-ccpch. Setting parameters setting range sfn cycle short (fixed) details this is the cycle of sfn (system frame number) that is transmit...
Page 110: 4.6.5 Saving/reading
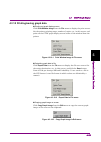
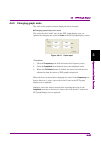
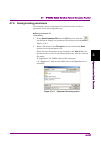
Chapter 4 operations for each function 4-84 4.6.5 saving/reading parameters this numeric values and settings for each item can be saved in a parameter file by using the iqproducer tm . Saving parameter file 1. Select save parameter file from the file menu or click the tool button to display the para...
Page 111
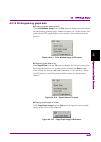
4.6 w-cdma downlink waveform pattern generation function 4-85 4 operat ions for eac h funct ion reading parameter file 1. Select recall parameter file from the file menu or click the tool button to display the parameter file reading screen shown in figure 4.6.5-2. 2. Select a parameter file to be re...
Page 112
Chapter 4 operations for each function 4-86 4.6.6 generating waveform pattern file a waveform pattern file to be used in the vector signal generator option can be generated based on the setting values. In the screen shown in figure 4.6.6-2, the waveform pattern name and comments can be entered and w...
Page 113
4.6 w-cdma downlink waveform pattern generation function 4-87 4 operat ions for eac h funct ion 2. The file name input screen is displayed. File name display area output destination folder selection button package name input box output file name input box comment input box rrc filter off checkbox fi...
Page 114
Chapter 4 operations for each function 4-88 when the rrc filter off check box is selected, symbol data that does not pass through the rrc filter is generated as a waveform pattern. You don’t need to select this check box under normal conditions. 3. Click the ok button to start waveform pattern file ...
Page 115
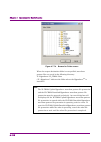
4.6 w-cdma downlink waveform pattern generation function 4-89 4 operat ions for eac h funct ion figure 4.6.6-4 browse for folder screen when the output destination folder is not specified, waveform pattern files are saved in the following directory: x:\iqproducer\w_cdma\data (“x:\iqproducer” indicat...
Page 116
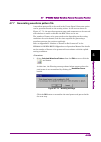
Chapter 4 operations for each function 4-90 4.6.7 auxiliary signal output when a waveform pattern generated by the w-cdma downlink iqproducer tm is selected by the vector signal generator option, a marker signal synchronized with the rf signal is output from the aux connector on the rear panel as an...
Page 117: Function
4.7 w-cdma uplink waveform pattern generation function 4-91 4 operat ions for eac h funct ion 4.7 w-cdma uplink waveform pattern generation function this function enables the generation of a waveform pattern to be used in cases such a w-cdma reception sensitivity test, by editing some w-cdma-related...
Page 118
Chapter 4 operations for each function 4-92 file menu the file menu contains the following items. Figure 4.7.2-2 screen when file is selected select option this menu item is enabled only if ms2830a was selected in 4.1 “starting/exiting iqproducer tm ”. Select whether to enable/disable the arb memo...
Page 119
4.7 w-cdma uplink waveform pattern generation function 4-93 4 operat ions for eac h funct ion edit menu the edit menu contains the following items. Figure 4.7.2-3 screen when edit is selected channel edit displays the channel edit screen in which the dpch parameters are set. This is the same opera...
Page 120
Chapter 4 operations for each function 4-94 tool buttons the following tool buttons are provided: recall parameter file button save parameter file button calculate waveform pattern button exit button the function of each button is the same with the corresponding item in the file or edit menu. Normal...
Page 121
4.7 w-cdma uplink waveform pattern generation function 4-95 4 operat ions for eac h funct ion 4.7.3 details of setting parameters on w-cdma uplink setting screen this section describes the details of the setting items on the w-cdma uplink setting screen. Setting item scrambling code functional outli...
Page 122
Chapter 4 operations for each function 4-96 ul_rmc_12_2kbps channel coding parameters table 4.7.3-1 ul reference measurement channel 12.2 kbps physical channel parameters parameter unit level information bit rate kbps 12.2 dpdch kbps 60 dpcch kbps 15 dpcch slot format #i 0 dpcch/dpdch power rati...
Page 123
4.7 w-cdma uplink waveform pattern generation function 4-97 4 operat ions for eac h funct ion 490 dcch dtch 60kbps dpdch conv. Coding r=1/3 1 2 15 radio frame fn=4n+1 radio frame fn=4n+2 radio frame fn=4n+3 radio frame fn=4n information data crc attachment rate matching 2nd interleaving 600 40 1 • •...
Page 124
Chapter 4 operations for each function 4-98 ul_rmc_64kbps channel coding parameters table 4.7.3-3 ul reference measurement channel 64 kbps physical channel parameters parameter unit level information bit rate kbps 64 dpdch kbps 240 dpcch kbps 15 dpcch slot format #i 0 dpcch/dpdch power ratio db ...
Page 125
4.7 w-cdma uplink waveform pattern generation function 4-99 4 operat ions for eac h funct ion 2293 dcch dtch 240kbps dpdch turbo code r=1/3 1 2 15 radio frame fn=4n+1 radio frame fn=4n+2 radio frame fn=4n+3 radio frame fn=4n information data crc attachment rate matching 2nd interleaving 2400 160 1 •...
Page 126
Chapter 4 operations for each function 4-100 ul_rmc_144kbps channel coding parameters table 4.7.3-5 ul reference measurement channel 144 kbps physical channel parameters parameter unit level information bit rate kbps 144 dpdch kbps 480 dpcch kbps 15 dpcch slot format #i 0 dpcch/dpdch power ratio...
Page 127
4.7 w-cdma uplink waveform pattern generation function 4-101 4 operat ions for eac h funct ion 4702 dcch dtch 480kbps dpdch turbo code r=1/3 1 2 15 radio frame fn=4n+1 radio frame fn=4n+2 radio frame fn=4n+3 radio frame fn=4n information data crc attachment rate matching 2nd interleaving 4800 320 1 ...
Page 128
Chapter 4 operations for each function 4-102 ul_rmc_384kbps channel coding parameters table 4.7.3-7 ul reference measurement channel 384 kbps physical channel parameters parameter unit level information bit rate kbps 384 dpdch kbps 960 dpcch kbps 15 dpcch slot format #i 0 dpcch/dpdch power ratio...
Page 129
4.7 w-cdma uplink waveform pattern generation function 4-103 4 operat ions for eac h funct ion 9525 dcch dtch 960kbps dpdch turbo code r=1/3 1 2 15 radio frame fn=4n+1 radio frame fn=4n+2 radio frame fn=4n+3 radio frame fn=4n information data crc attachment rate matching 2nd interleaving 9600 640 1 ...
Page 130
Chapter 4 operations for each function 4-104 4.7.4 details of setting parameters on channel edit screen when the channel edit button is clicked, the channel edit screen shown below is displayed. This section describes the details of the setting items on this screen. Figure 4.7.4-1 channel edit scree...
Page 131
4.7 w-cdma uplink waveform pattern generation function 4-105 4 operat ions for eac h funct ion setting item dpch edit (phch) functional outline performs settings for ul-dpch. Setting parameters setting range timing offset 0 to 149 tfci 0 to 1023 setting item dpch edit (trch edit) functional outline ...
Page 132
Chapter 4 operations for each function 4-106 4.7.5 details of setting parameters on channel gain setup screen when the channel gain setup is selected from the edit menu, the channel gain setup screen shown below is displayed. This section describes the details of the setting items on this screen. Fi...
Page 133: 4.7.6 Saving/reading
4.7 w-cdma uplink waveform pattern generation function 4-107 4 operat ions for eac h funct ion 4.7.6 saving/reading parameters this numeric values and settings for each item can be saved in a parameter file by using iqproducer tm . Saving parameter file 1. Select save parameter file from the file me...
Page 134
Chapter 4 operations for each function 4-108 reading parameter file 1. Select recall parameter file from the file menu or click the tool button to display the parameter file reading screen shown in figure 4.7.6-2. 2. Select a parameter file to be read from the file list, and then click the open butt...
Page 135
4.7 w-cdma uplink waveform pattern generation function 4-109 4 operat ions for eac h funct ion 4.7.7 generating waveform pattern file a waveform pattern file to be used in the vector signal generator option can be generated based on the setting values. In the screen shown in figure 4.7.7-2, the wave...
Page 136
Chapter 4 operations for each function 4-110 2. The file name input screen is displayed. File name display area output destination folder selection button package name input box output file name input box comment input box rrc filter off checkbox figure 4.7.7-2 file name input screen enter a file na...
Page 137
4.7 w-cdma uplink waveform pattern generation function 4-111 4 operat ions for eac h funct ion when the rrc filter off check box is selected, symbol data that does not pass through the rrc filter is generated as a waveform pattern. You don’t need to select this check box under normal conditions. 3. ...
Page 138
Chapter 4 operations for each function 4-112 figure 4.7.7-4 browse for folder screen when the output destination folder is not specified, waveform pattern files are saved in the following directory: x:\iqproducer\w_cdma\data (“x:\iqproducer” indicates the folder where the iqproducer tm is installed....
Page 139
4.7 w-cdma uplink waveform pattern generation function 4-113 4 operat ions for eac h funct ion 4.7.8 auxiliary signal output when a waveform pattern generated by the w-cdma uplink iqproducer tm is selected by the vector signal generator option, a marker signal synchronized with the rf signal is outp...
Page 140: 4.8 Help Screen
Chapter 4 operations for each function 4-114 4.8 help screen click help on the common platform screen described in section 4.2. This screen displays the version information. Click ok to close the help screen. The following shows an example. Figure 4.8-1 help screen.
Page 141: 4.9.1 Activation
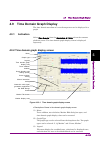
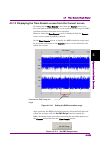
4.9 time domain graph display 4-115 4 operat ions for eac h funct ion 4.9 time domain graph display the time domain waveform of a waveform pattern can be displayed in a graph. 4.9.1 activation select time domain from the simulation & utility tab on the common platform screen. The time domain graph d...
Page 142
Chapter 4 operations for each function 4-116 (4) time domain graph display area a time domain graph is displayed in this area. Graph cursor move and graph zoom-in display can be executed. (5) add/delete (trace addition/deletion) a trace can be added/deleted. (6) cursor position the graph cursor posi...
Page 143: 4.9.3 Displaying
4.9 time domain graph display 4-117 4 operat ions for eac h funct ion 4.9.3 displaying time domain graph by reading file a waveform pattern can be read and displayed in a time domain graph. Time domain graph display using add button 1. Click one of the option buttons in the legend dialog box to sele...
Page 144
Chapter 4 operations for each function 4-118 3. Click the button in the add trace screen, and select a waveform pattern for which a time domain graph is displayed. Figure 4.9.3-4 add trace screen waveform pattern files that have the formats below can be read. For details about the ascii1, ascii2, as...
Page 145: 4.9.4
4.9 time domain graph display 4-119 4 operat ions for eac h funct ion 4. Click the ok button on the add trace screen to read the waveform pattern. When the waveform pattern has been read completely, the time domain graph display screen is displayed again with a trace in the color selected in legend....
Page 146: 4.9.5 Graph
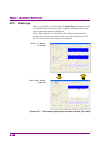
Chapter 4 operations for each function 4-120 4.9.5 graph type when “i, q, marker” is selected from the graph type drop-down list, the time domain waveform of the i-phase, q-phase, and marker data of the selected waveform pattern is displayed. When “power, marker” is selected, the time domain wavefor...
Page 147: 4.9.6
4.9 time domain graph display 4-121 4 operat ions for eac h funct ion 4.9.6 sampling information display the sampling information on the trace selected by a radio button in the legend field is displayed in the lower area of the legend field. The reading start sample and the reading end sample are di...
Page 148: 4.9.7
Chapter 4 operations for each function 4-122 4.9.7 selecting mouse interaction in time domain graph display area graph cursor move or graph zoom-in can be selected for a mouse dragging operation in the time domain graph display area. Click the mouse interaction button to display the mouse interactio...
Page 149: 4.9.8
4.9 time domain graph display 4-123 4 operat ions for eac h funct ion 4.9.8 moving graph cursor the graph cursor displayed in the time domain graph display area can be moved. Moving graph cursor using mouse when the black-line or yellow-line cursor in the time domain graph display area is dragged, t...
Page 150
Chapter 4 operations for each function 4-124 moving graph cursor changing cursor value when the time 1 value in the cursor area of the time domain graph display screen is updated, the black-line cursor moves and the magnitude 1 value is updated. Similarly, when the time 2 value is updated, the yello...
Page 151: 4.9.9
4.9 time domain graph display 4-125 4 operat ions for eac h funct ion 4.9.9 changing graph scale the scale of the graph currently displayed can be changed. Changing graph display area scale the scales for the time (x axis) and amplitude (y axis) of the time domain graph display area are updated by c...
Page 152
Chapter 4 operations for each function 4-126 figure 4.9.9-2 graph scale change by mouse operation specifying display area by mouse operation when zoom is selected for mouse interaction, pointing and dragging an area in the time domain graph enlarges the selected area (within the dotted rectangle)..
Page 153
4.9 time domain graph display 4-127 4 operat ions for eac h funct ion 4.9.10 values displayed on graph this section describes how a trace on the i, q, power, and marker graphs displays the data or marker of the waveform pattern, separately for each graph type. I and q graphs on the i and q graphs (d...
Page 154
Chapter 4 operations for each function 4-128 therefore, when this equipment is actually used to output a modulated signal, the output signal does not necessarily use the 0 db in the power graph as a reference. Note that the sample-unit time scale above the power graph applies only to the trace selec...
Page 155
4.9 time domain graph display 4-129 4 operat ions for eac h funct ion 4.9.11 interaction with signal generation application (quick add mode) the method for updating the time domain graph display in conjunction with waveform pattern generation by a signal generation application can be set and changed...
Page 156
Chapter 4 operations for each function 4-130 4.9.12 marker edit function a new waveform pattern can be created by reading an existing waveform pattern and editing the marker data and name with the marker edit function. The marker edit function cannot be used if ascii1, ascii2, ascii3, or ms269x/ms28...
Page 157
4.9 time domain graph display 4-131 4 operat ions for eac h funct ion set the number of samples prior to the first marker signal output starting point to start point, the number of samples to output marker signals to width, and the number of samples between the marker signal output starting points t...
Page 158
Chapter 4 operations for each function 4-132 close button (for closing marker edit dialog box) click this button to close the marker edit dialog box. Refer to section 4.5.6 “input file format” for details on marker data and rf gate data..
Page 159
4.9 time domain graph display 4-133 4 operat ions for eac h funct ion 4.9.13 displaying the time domain screen from the convert screen by displaying the time domain screen from the convert screen, the pre-conversion waveform pattern can be checked and the range for rms calculation during conversion ...
Page 160: 4.10 Clipping Function
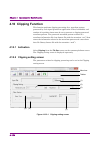
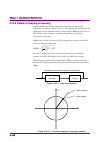
Chapter 4 operations for each function 4-134 4.10 clipping function this function performs clipping processing for a waveform pattern generated by each signal generation application. Filter, bandwidth, and number of repetition times must be set to generate a clipping-processed waveform pattern. The ...
Page 161
4.10 clipping function 4-135 4 operat ions for eac h funct ion menu bar the following menus are provided on the menu bar. the file menu contains the following item. exit exits from the clipping. the simulation menu contains the following items. ccdf displays the ccdf graph display screen. Th...
Page 162
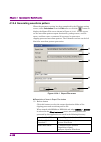
Chapter 4 operations for each function 4-136 description of items on clipping setting screen (1) reference button select the wvi file of the target waveform pattern. (2) filter type set the filter type. Setting options: ideal, none, nyquist, root nyquist, gaussian initial setting: ideal ideal indica...
Page 163: 4.10.3 Setting Method
4.10 clipping function 4-137 4 operat ions for eac h funct ion 4.10.3 setting method 1. Click the button to select the wvi file of the waveform pattern to be used. The full path of the selected wvi file is displayed in the input file text box. 2. Set values in the filter type, roll off/bt, bandwidth...
Page 164
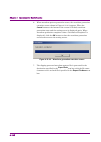
Chapter 4 operations for each function 4-138 4.10.4 generating waveform pattern when the parameter setting has been completed in the clipping setting screen, select calculation from the edit menu or click the button to display the export file screen shown in figure 4.10.4-1. In this screen, set the ...
Page 165
4.10 clipping function 4-139 4 operat ions for eac h funct ion (2) package enter the name of the package of the clipping-processed waveform pattern to be generated. Up to 31 characters can be entered for a package name. Alphanumeric characters and the following symbols may be used: ! % & ( ) + = ` {...
Page 166
Chapter 4 operations for each function 4-140 6. When waveform pattern generation starts, the waveform generation execution screen shown in figure 4.10.4-2 appears. When the cancel button at the bottom of the screen is clicked, waveform generation stops and the setting screen is displayed again. When...
Page 167
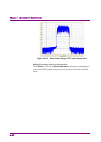
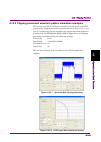
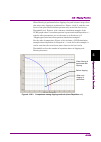
4.10 clipping function 4-141 4 operat ions for eac h funct ion 4.10.5 clipping-processed waveform pattern simulation examples this section provides a simulation example of the spectrum and ccdf graphs of the clipping-processed waveform pattern in figs 4.10.5-1 and 4.10.5-2, respectively. In this exa...
Page 168
Chapter 4 operations for each function 4-142 4.10.6 details of clipping processing during clipping processing, clipping and filtering are performed repeatedly, as shown in figure 4.10.6-1. The clipping processing clips the peaks that exceed threshold level, referencing on rms iq as the basis (0 db)....
Page 169
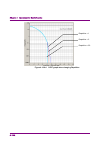
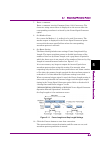
4.10 clipping function 4-143 4 operat ions for eac h funct ion when filtering is performed after clipping, the peak becomes larger than that when only clipping is performed (see figure 4.10.6-3), and the crest factor of the generated waveform pattern may exceed the level set by threshold level. Figu...
Page 170
Chapter 4 operations for each function 4-144. Repetition = 1 repetition = 2 repetition = 20 figure 4.10.6-4 ccdf graph when changing repetition.
Page 171
Chapter 5 waveform pattern generation 5-1 5 w aveform patter n generation this chapter describes in particular the operating procedures for important functions that pertain to the functions that can be operated by the iqproducer tm . 5.1 generating waveform pattern .....................................
Page 172
Chapter 5 waveform pattern generation 5-2 5.1 generating waveform pattern this section describes a series of operations for converting an ascii-format waveform pattern generated by external simulation software to a waveform pattern that can be used by the vector signal generator option using the con...
Page 173
5.1 generating waveform pattern 5-3 5 w aveform patter n generation 7. Enter a comment. Enter a comment into the comment lines 1/2/3 if necessary. The character string entered here is displayed on the screen when the corresponding waveform is selected by the vector signal generator option. 8. Set ma...
Page 174
Chapter 5 waveform pattern generation 5-4..
Page 175
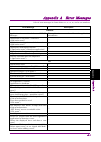
Appendix a error messages a-1 appe ndix a ppendix a a list of error messages is shown below. N 0 , n 1 , n 2 , n 3 , and n 4 are numbers. Error message description platform application is not found from appinfo manager. The application was not found from the application information. Application is n...
Page 176
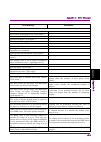
Appendix a error messages a-2 error message description there is no trace to output. Csv output is impossible since no graph is displayed. If the “fft points” is changed, all the trace displayed will be recalculated. Are you sure to change the “fft points”? — sampling rate is different. Do you clear...
Page 177
Appendix a error messages a-3 appe ndix a ppendix a error message description convert initialization error — selection of an inaccurate file. (“file name”) — can not open file. (“file name”) — invalid file format. (“file name”) — the data of a wave-form file is unusual. — can not open file. (“file n...
Page 178
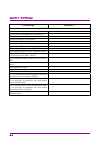
Appendix a error messages a-4 error message description w-cdma downlink/uplink initialization error — selection of an inaccurate file. (“file name”) — can not open file. (“file name”) — invalid file format. (“file name”) — the data of a wave-form file is unusual. — can not write file. (“file name”) ...
Page 179
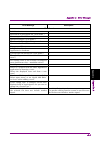
Appendix a error messages a-5 appe ndix a ppendix a error message description time domain initialization error — selection of an inaccurate file. (“file name”) — can not open file. (“file name”) — invalid file format. (“file name”) — the data of a wave-form file is unusual. — can not write file. (“f...
Page 180
Appendix a error messages a-6. Error message description clipping can not open file. — can not write file. — can not read file. — input file is not selected. — the setting value is out of range (“parameter name (minimum value – maximum value)”) — the waveform data file is not generated. — wrong patt...
Page 181
Index index-1 in dex a activation 4.3.1, 4.4.1, 4.5.1, 4.6.1, 4.7.1 b basic operations chapter 3 c ccdf graph display 4.3 ccdf graph display function 1.2.2 ccdf graph display screen 4.3.2 changing graph display area and axis plot interval 4.4.5 changing graph scale 4.3.9, 4.4.9 clipping function 4.1...
Page 182
Index index-2. Operations using keyboard 3.1.2 operations using mouse 3.1.1 operations using up and down cursor keys 3.1.3 overview 1.1 p printing/saving graph data 4.3.10, 4.4.10 s selecting input file 4.5.3 selecting mouse interaction in graph display area 4.3.7, 4.4.7 signal generation applicatio...

